Simple Line

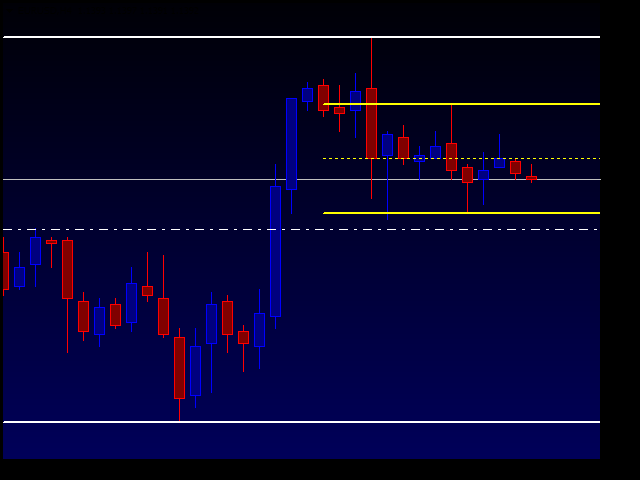
The indicator shows the levels of the past week and day. In addition, it draws a level in percentage. This level is specified relative to the difference between the High and Low of the past month and week. For the daily levels of the past day, the Close levels are additionally displayed. All you need to do is configure the display parameters of the levels to your liking.


Parameters

  • Over the past months installations - settings for the last months;
    PasteMonthsLines - the level display mode is on (off);
    InpPastMonth - the number of months in the calculation of lines (default: 12):
    TypeLinesP_M - type of line for displaying levels;
    InpWidthLinesP_M - thickness of the line displaying the levels;
    InpMonthly_P_Level - enable (disable) the line level in percent;
    PercentageP_M - line level as a percentage of the range of highs and lows. Default = 50;
    TypeLinesP_M_P - line type as a percentage of the range of highs and lows;
    InpWidthLinesP_M_P- line thickness as a percentage of the range of highs and lows;
    ColorLinesP_M_P - line color;
  • Monthly installations - monthly settings;
  • MonthlyLines - enable (disable) displaying the levels;
  • TypeLinesM - line type to display the levels;
  • InpWidthLinesM - line width to display the levels;
  • InpMonthlyPercentageLevel - enable (disable) line level in %;
  • PercentageM - level of the line set as a percentage of the High-Low range. Default = 50;
  • TypeLinesM - type of the line set as a percentage of the High-Low range;
  • InpWidthLinesM - width of the line set as a percentage of the High-Low range;
  • ColorLinesM - line color;
  • Weekly installations - weekly settings;
  • WeeklyLines - enable (disable) displaying the levels;
  • TypeLinesW - line type to display the levels;
  • InpWidthLinesW - line width to display the levels;
  • InpWeeklyPercentageLevel - enable (disable) line level in %;
  • PercentageW - level of the line set as a percentage of the High-Low range. Default = 50;
  • TypeLinesPW - type of the line set as a percentage of the High-Low range;
  • InpWidthLinesPW - width of the line set as a percentage of the High-Low range;
  • ColorLinesW - line color;
  • Daylight settings - daily settings;
  • PreviousDayLines - enable (disable) displaying the levels;
  • TypeLinesPDL - line type to display the levels;
  • InpWidthLinesPDL - line width to display the levels;
  • InpDayCloseLevel - enable (disable) line level of the day closure;
  • TypeLinesPDLClose - line type of the daily Close level;
  • InpWidthLinesPDLClose - line width of the daily Close level;
  • ColorLinesPDL - line color;
  • The first trading day of the week - the first trading day of the week (default is Monday);
  • The last trading day of the week - the last trading day of the week (default is Friday).
おすすめのプロダクト
This is a multi-timeframe version of the popular Hull Moving Average (HMA). The Double HMA MTF Light indicator combines two timeframes on a single chart. The HMA of the higher timeframe defines the trend, and the HMA of the current timeframe defines short-term price movements. The indicator is freely distributed and hasn't audio signals or messages. Its main function is the visualization of price movements. If you need advanced functionality of the HMA multi-timeframe indicator (information ab
FREE
Ppr PA
Yury Emeliyanov
4.5 (2)
"Ppr PA" is a unique technical indicator created to identify "PPR" patterns on the currency charts of the MT4 trading platform. These patterns can indicate possible reversals or continuation of the trend, providing traders with valuable signals to enter the market. Features: Automatic PPR Detection:   The indicator automatically identifies and marks PPR patterns with arrows on the chart. Visual Signals:   Green and red arrows indicate the optimal points for buying and selling, respectively. Ar
FREE
Power Trend Free - the indicator shows the trend strength in the selected period. Input Parameters The indicator has three input parameters: Period - a positive number greater than one, it shows the number of candlesticks used for calculations. If you enter one or zero, there will be no error, but the indicator will not be drawn. Applied Price - the standard "Apply to:" set meaning data used for the indicator calculation: Close - Close prices; Open - Open prices; High - High prices; Low - Low p
FREE
This indicator has been created for finding the probable reversal points of the symbol price. A small candlestick reversal pattern is used it its operation in conjunction with a filter of extremums. The indicator is not redrawn! If the extremum filter is disabled, the indicator shows all points that have a pattern. If the extremum filter is enabled, the condition works – if the history Previous bars 1 candles back contains higher candles and they are farther than the Previous bars 2 candle, such
FREE
The indicator detects and displays М. Gartley's Butterfly pattern. The pattern is plotted by the extreme values of the ZigZag indicator (included in the resources, no need to install). After detecting the pattern, the indicator notifies of that by the pop-up window, a mobile notification and an email. The pattern and wave parameters are displayed on the screenshots. The default parameters are used for demonstration purposes only in order to increase the amount of detected patterns. Parameters z
The indicator shows the potential trend direction by cyclical-wave dependence. Thus, all the rays of the intersection will be optimal rays, in the direction of which the price is expected to move, taking into account the indicator period. Rays can be used as a direction for potential market movement. But we must not forget that the approach must be comprehensive, the indicator signals require additional information to enter the market.
Индикатор Adapter определяет господствующую тенденцию, помогает анализировать рынок на выбранном временном интервале. Прост в настройке и работает на всех парах и всех временных интервалах. Индикаторы тренда дают возможность классифицировать направление ценового движения, определив его силу. Решение этой проблемы помогает инвесторам вовремя войти в рынок и получить хорошую отдачу. Для любого трейдера крайне важно правильно определить направление и силу трендового движения. К сожалению, единств
Индикатор использует сложный алгоритм, который позволяет ему обнаруживать потенциальные развороты тренда. На основе его кода, индикатор сравнивает движение цены со средним диапазоном свечей. Так же индикатор показывает места флета где появляется разворот и приостанова движения цены Работает на любой валютной паре, с любым таймфреймом Дополнительно можно встроить передачу сигналов в телеграм, Выбор цветов позволяет пользователю настроить свою цветовую гамму.
The indicator detects and displays Shark harmonic pattern (see the screenshot). The pattern is plotted by the extreme values of the ZigZag indicator (included in the resources, no need to install). After detecting the pattern, the indicator notifies of that by a pop-up window, a mobile notification and an email. The indicator highlights the process of the pattern formation and not just the complete pattern. In the former case, it is displayed in the contour triangles. After the pattern is comple
The indicator displays signals according to the strategy of Bill Williams on the chart. Demo version of the indicator has the same features as the paid, except that it can work only on a demo account . Signal "First Wise Man" is formed when there is a divergent bar with angulation.  Bullish divergent bar - with lower minimum and closing price in the upper half. Bearish divergent bar - higher maximum and the closing price at the bottom half. Angulation is formed when all three lines of Alligator
FREE
FlatBreakout (Free Version) Flat Range Detector and Breakout Panel for MT4 — GBPUSD Only FlatBreakout is the free version of the professional FlatBreakoutPro indicator, specially designed for flat (range) detection and breakout signals on the GBPUSD pair only. Perfect for traders who want to experience the unique fractal logic of FlatBreakout and test breakout signals on a live market without limitations. Who Is This Product For? For traders who prefer to trade breakout of flat ranges (breakout,
FREE
ハーモニックパターンは市場の転換点を予測するのに最適です。これらのパターンは高い勝率と1日の中での多くの取引機会を提供します。当社のインジケーターは、ハーモニックトレーディングの原則に基づいて、市場反転ポイントを予測する最も一般的なハーモニックパターンを特定します。 重要な注意事項: インジケーターは再描画されず、遅れることはありません(パターンはDポイントで検出されます);再描画されることはありません(パターンは有効またはキャンセルされます)。 使用方法: インジケーターをMT5チャートにドラッグアンドドロップします。 パターン検出をTRUE(ABCD;Gartley)に設定します。 任意のデバイスを設定します(高いデバイス=より多くのパターン;低いデバイス=より少ないパターン)。 好みに合わせて色を調整します。 バルブ/エントリーポイント、TP、SLの警告を有効または無効にします。 パターンが検出された場合: アルゴリズムはDポイントでパターンを検出します。 警告が有効になっている場合、パターン検出を通知します。 パターンが無効になった場合、「パターンがキャンセルされました」という
FREE
LordChannel is an indicator for META TRADER 4 for all forex pairs and financial market metals. The indicator is used to make detections of high/low channels, implementing a technical analysis on possible breakouts and making correct order entries. LordChannel sends signals such as buy and sell in the graphical analysis, it is important to emphasize that the importance of these signals are safe in TIME FRAMES M30, H1, H4. The indicator was created for using bullish/downtrend channels to compl
Schaff Trend Cycleとは Schaff Trend Cycle(STC)は、トレンドの転換点をタイムリーに捉えるために設計されたオシレーター系インジケーターです。従来の移動平均やMACDと比較して、サイクル的な動きとモメンタムを組み合わせることで、トレンドの始まりと終わりをより明確に把握できます。 主な特徴 トレンド転換シグナルの明確化:上昇トレンドではサイクルラインが上向きに、下降トレンドでは下向きに推移します。 レンジ相場でのだましを抑制:サイクル周期を考慮した平滑化処理により、短期的なノイズを減少させます。 パラメーター調整が容易:期間や平滑化係数を変更するだけで、動作感度を初心者から上級者まで幅広く調整可能です。 計算ロジック概要 モメンタムの算出 指定期間の価格変化をもとに、短期および長期のモメンタムを計算します。 サイクル平滑化 モメンタムに対し、二重平滑化(ダブル・スムージング)を適用し、サイクル的な振動成分を抽出します。 正規化処理 0~100の範囲に正規化し、オシレーターとして表示します。 シグナル生成 水平ライン(通常は25と75)を上下に抜
FREE
WPR Breakout MT4
Mohamed Hassan Mohamed Hassan Alsherbiny
When prices breakout resistance levels are combined with   Larry Williams' Percentage Range "WPR"   oscillator breaks out its historical resistance levels then probability emerges to record farther prices.   It's strongly encouraged to confirm price breakout with oscillator breakout since they have comparable effects to price breaking support and resistance levels; surely, short trades will have the same perception. Concept is based on find swing levels which based on number of bars by each side
FREE
FletBoxPush   インディケータは、指定されたパラメータに従って価格変動のフラットエリアを決定します。 設定: TimeFrames-チャート期間の選択。 FlatPips-フラットを決定するためのポイントの制限 FlatBars-フラットを決定するためのバーの数の制限 CountBars-価格変動を分析するための履歴内のバーの数。0では履歴内のすべてのバーが分析されます。 色-フラットとして定義された価格セグメントの色 PriceTag-価格ラベルの追加図面 アラート-ユーザーデータを含むダイアログボックスを表示します テキスト-アラートのカスタムテキスト Send_Mail- [メール]タブの設定ウィンドウで指定されたアドレスにメールを送信します 件名-メールヘッダー Send_Notification- [通知]タブの設定ウィンドウでMetaQuotesIDが指定されているモバイル端末に通知を送信します。
PZ Penta O MT4
PZ TRADING SLU
2.33 (3)
The Penta-O is a 6-point retracement harmonacci pattern which usually precedes big market movements. Penta-O patterns can expand and repaint quite a bit. To make things easier this indicator implements a twist: it waits for a donchian breakout in the right direction before signaling the trade. The end result is an otherwise repainting indicator with a very reliable trading signal. The donchian breakout period is entered as an input. [ Installation Guide | Update Guide | Troubleshooting | FAQ | A
FREE
The Turtle Trading Indicator implements the original Dennis Richards and Bill Eckhart trading system, commonly known as The Turtle Trader. This trend following system relies on breakouts of historical highs and lows to take and close trades: it is the complete opposite to the "buy low and sell high" approach. The main rule is "Trade an N-day breakout and take profits when an M-day high or low is breached (N must me above M)". [ Installation Guide | Update Guide | Troubleshooting | FAQ | All Prod
FREE
The indicator detects and displays 3 Drives harmonic pattern (see the screenshot). The pattern is plotted by the extreme values of the ZigZag indicator (included in the resources, no need to install). After detecting the pattern, the indicator notifies of that by a pop-up window, a mobile notification and an email. The indicator highlights the process of the pattern formation and not just the complete pattern. In the former case, it is displayed in the contour triangles. After the pattern is com
American traders say: “Trend is your friend”, which means “Trend is your friend”. And indeed it is! By trading with the trend, you reduce your risks and gain an advantage, as you increase the mathematical expectation of completed trades and, therefore, earn more profit. Together with the Going straight indicator you will trade with the trend with ease! This is one of the most effective ways to deal with market trends. Trading strategies using the channel indicator belong to the classic methods
This indicator is the undisputed leader among the indicators. And for this statement there is a good reason. The indicator builds a very high quality channel in which it generates signals to enter! What is the ideal strategy for the trader, since the trader always hesitates when choosing a strategy for the job. That is, this indicator will allow you to solve the dilemma of choosing a job by trend or to the channel, since it combines these two basic concepts. Working with the indicator is very
With this system you can spot high-probability trades in direction of strong trends. You can profit from stop hunt moves initiated by the smart money! Important Information How you can maximize the potential of the scanner, please read here: www.mql5.com/en/blogs/post/718109 Please read also the blog about the usage of the indicator: Professional Trading With Strong Momentum This FREE Version of the indicator works only on EURUSD and GBPUSD. The full version of the indicator can be found here:
FREE
「調整可能なフラクタル」はフラクタル インジケーターの高度なバージョンで、非常に便利なトレーディング ツールです。 - ご存知のとおり、標準フラクタル mt4 インジケーターには設定がまったくありません。これはトレーダーにとって非常に不便です。 - 調整可能なフラクタルは、この問題を解決しました。必要な設定がすべて揃っています。 - インジケーターの調整可能な期間 (推奨値 - 7 以上)。 - 価格の高値/安値からの距離を調整可能。 - フラクタル矢印のデザインを調整可能。 - インジケーターにはモバイルおよび PC アラートが組み込まれています。 高品質のトレーディングロボットとインジケーターをご覧になるにはここをクリックしてください! これは、この MQL5 Web サイトでのみ提供されるオリジナル製品です。
StrikePin
Mike Pascal Plavonil
1 (1)
The StrikePin indicator is a technical, analytical tool designed to identify trend reversals and find optimal market entries.  The StrikePin indicator is based on the pin bar pattern, which is the Price Action reversal pattern. An entry signal, in a trending market, can offer a very high-probability entry and a good risk to reward scenario. Be careful: the indicator is repainting since it is looking for highest high and lowest lows.  You should avoid to use it in experts but you can use it in
FREE
The resistance and support lines are the position where the price will have a change, be it a breakout to follow the trend or reverse. The price rule will go from support to resistance and Long's resistance can be Short's support and the opposite is true. Accurately identifying support and resistance lines is the key to being able to trade well and profitably. This indicator is based on the Fractals indicator, the indicator will be redrawn by 2 candles. *Great For Swing Trading *Blue is Support
Fakey Detector — False Breakout (Fakey) Indicator Fakey Detector is an indicator that automatically detects the classic Fakey pattern (false breakout of an inside bar) from Price Action and displays it on the chart using an arrow and breakout level. How it works: The Fakey pattern consists of three candles: Mother Bar — the largest by range Inside Bar — fully contained within the Mother Bar's range Fakey Candle — breaks out (up or down), but then closes back inside the range The indicator
FREE
The   Trendlines Oscillator   helps traders identify trends and momentum based on the normalized distances between the current price and the most recently detected bullish and bearish trend lines. The indicator features bullish and bearish momentum, a signal line with crossings, and multiple smoothing options. USAGE The   Trendlines Oscillator   works by systematically: Identifying pivot highs and lows. Connecting pivots to form bullish (support) and bearish (resistance) trendlines. Measuring
Momentum Breakout Indicator MT4
Mohamed Hassan Mohamed Hassan Alsherbiny
When prices breakout resistance levels are combined with momentum oscillator breaks out its historical resistance levels then probability emerges to record farther prices. It's strongly encouraged to confirm price breakout with oscillator breakout since they have comparable effects to price breaking support and resistance levels; surely, short trades will have the same perception. Concept is based on find swing levels which based on number of bars by each side to confirm peak or trough and in tu
FREE
Basic Supply Demand
Mehran Sepah Mansoor
4.33 (3)
基本的な需給インジケータは、あなたの市場分析を強化し、あらゆるチャート上の重要な機会領域を特定するために設計された強力なツールです。直感的で使いやすいインターフェイスで、この無料のメタトレーダー用インディケータは、需給ゾーンを明確に表示し、より多くの情報に基づいた正確な取引判断を可能にします /  MT5無料版 この指標のダッシュボードスキャナー: ( Basic Supply Demand Dashboard ) 特徴 チャートの需給ゾーンを自動的にスキャンし、面倒な手動分析を不要にします。 直近の需給ゾーンまでの残り距離をグラフィカルに表示 供給ゾーンは特徴的な色で強調表示され、需要ゾーンは別の色で表示されるため、迅速かつ正確な解釈が可能。 このインディケータは、最も近い供給ゾーンまたは需要ゾーンとチャート上の現在価格との距離をpips単位で自動的に計算し、明確かつ定量的な指標を提供します。pips単位の距離はチャート上にはっきりと見やすく表示され、現在価 格との距離が大きい、または小さいエリアを素早く特定できます。 需給ゾーンの接近やブレイクを警告 どのタイムフレームでも機
FREE
「Auto FIBO Pro」Crypto_Forex インジケーターは、取引の補助ツールとして最適です。 - インジケーターは、フィボナッチ レベルとローカル トレンド ライン (赤色) を自動的に計算してチャート上に配置します。 - フィボナッチ レベルは、価格が反転する可能性のある重要な領域を示します。 - 最も重要なレベルは、23.6%、38.2%、50%、61.8% です。 - リバーサル スキャルピングやゾーン グリッド取引に使用できます。 - Auto FIBO Pro インジケーターを使用して、現在のシステムを改善する機会も多数あります。 - Info Spread Swap Display があり、接続されている外国為替ペアの現在のスプレッドとスワップを表示します。 - ディスプレイには、アカウントの残高、エクイティ、マージンも表示されます。 - Info Spread Swap Display は、チャートのどのコーナーにも配置できます。 0 - 左上コーナー、1 - 右上、2 - 左下、3 - 右下。 高品質のトレーディングロボットとインジケーターをご覧にな
このプロダクトを購入した人は以下も購入しています
Precautions for subscribing to indicator This indicator only supports the computer version of MT4 Does not support MT5, mobile phones, tablets The indicator only shows the day's entry arrow The previous history arrow will not be displayed (Live broadcast is for demonstration) The indicator is a trading aid Is not a EA automatic trading No copy trading function The indicator only indicates the entry position No exit (target profit)  The entry stop loss point is set at 30-50 PIPS Or the front hi
Gann Made Easy は、ミスター・ギャンの理論を使用した取引の最良の原則に基づいた、プロフェッショナルで使いやすい外国為替取引システムです。 W・D・ガン。このインジケーターは、ストップロスとテイクプロフィットレベルを含む正確な買いと売りのシグナルを提供します。 PUSH通知を利用して外出先でも取引可能です。 購入後に私に連絡して、取引のヒント、ボーナス、および「GANN MADE EASY」EA アシスタントを無料で入手してください。 おそらく、ギャンの取引手法についてはすでに何度も聞いたことがあるでしょう。通常、ギャンの理論は初心者のトレーダーだけでなく、すでにある程度の取引経験がある人にとっても非常に複雑なものです。なぜなら、ギャンの取引手法は理論的にはそれほど簡単に適用できるものではないからです。私はその知識を磨き、最良の原則を私の外国為替インジケーターに組み込むために数年を費やしました。 このインジケーターは非常に簡単に適用できます。必要なのは、それをチャートに添付し、簡単な取引推奨事項に従うだけです。このインジケーターは常に市場分析の仕事を行い、取引の機会を探しま
M1 SNIPER は使いやすいトレーディングインジケーターシステムです。M1時間足向けに設計された矢印インジケーターです。M1時間足でのスキャルピングのためのスタンドアロンシステムとして、また既存のトレーディングシステムの一部としても使用できます。このトレーディングシステムはM1時間足での取引に特化して設計されていますが、他の時間足でも使用できます。元々、この手法はXAUUSDとBTCUSDの取引用に設計しましたが、他の市場においても役立つと考えています。 インジケーターのシグナルは、トレンドの方向と逆方向に取引できます。インジケーターのシグナルを利用して両方向に取引するのに役立つ特別な取引テクニックをご紹介します。この手法は、特別な動的なサポートとレジスタンスの価格帯を利用することに基づいています。 ご購入後、M1 SNIPER矢印インジケーターをすぐにダウンロードできます。さらに、M1 SNIPERツールのすべてのユーザーに、以下のスクリーンショットに表示されているApollo Dynamic SRインジケーターを無料で提供しています。この2つのインジケーターを組み合わせることで
Super Signal – Skyblade Edition プロ仕様のノンリペイント / ノーラグ・トレンドシグナルシステム。卓越した勝率を実現 | MT4 / MT5 対応 1分足、5分足、15分足などの低い時間足で最も効果を発揮します。 主な特徴: Super Signal – Skyblade Edition は、トレンド取引に特化したスマートなシグナルシステムです。マルチレイヤーのフィルターロジックを用いて、明確な方向性と実際のモメンタムに支えられた強力なトレンドのみを検出します。 このシステムは 天井や底を予測するものではありません 。次の3つの条件がすべて満たされた場合にのみシグナルを発生させます: 明確なトレンド方向 モメンタムの増加 健全なボラティリティ構造 市場セッションに基づく流動性分析と組み合わせることで、シグナルの精度とタイミングがさらに向上します。 シグナルの特性: すべての矢印シグナルは 100% 非リペイント / 遅延なし 一度出現したシグナルは固定され、点滅・消失しません チャート上の矢印、情報パネル、ポップアップ通知、音声アラート、プッシュ通知
Miraculous Indicator – ガン・スクエア・オブ・ナインに基づく100%非リペイントのFXおよびバイナリーツール この動画では、FXおよびバイナリーオプションのトレーダー向けに特別に開発された、非常に正確で強力な取引ツールである Miraculous Indicator を紹介しています。このインジケーターがユニークなのは、伝説的な ガン・スクエア・オブ・ナイン と ガンの振動の法則 に基づいている点で、現代の取引で利用できる最も正確な予測ツールの一つとなっています。 Miraculous Indicatorは 完全に非リペイント であり、ローソク足が確定した後にシグナルが変化したり消えたりすることはありません。つまり、見たものがそのまま利用できます。これにより、トレーダーは自信を持ってエントリーおよびエグジットを行うための信頼性と一貫性のある根拠を得ることができます。 主な特徴: ガン・スクエア・オブ・ナインとガン理論に基づいて構築 100%非リペイントのシグナルシステム すべての時間枠(M1、M5、H1、H4、日足、週足)で機能 FXおよびバイナリーオプション取引
PRO Renko Systemは、特別にRENKOチャートを取引するために設計された高精度の取引システムです。 これは、様々な取引商品に適用することができる普遍的なシステムです。 システムは効果的に正確な逆転信号へのアクセスを与えるいわゆる市場の騒音を中和する。 表示器は非常に使いやすく、信号の生成に責任がある1つの変数だけがあります。 あなたは簡単にお好みの任意の取引ツールとレンコバーのサイズにツールを適応させることができます。 私はいつもあなたが私のソフトウェアで収益性の高い取引を支援するために余分なサポートを提供する準備ができています! 私はあなたに幸せで収益性の高い取引をしたいです! ご購入後にご連絡ください! 私はあなたに私のレンコチャートジェネレータを送信します。 私はまた、私の個人的な推奨事項やシステムの他のモジュールを無料で共有します!
Volatility Trend System - a trading system that gives signals for entries. The volatility system gives linear and point signals in the direction of the trend, as well as signals to exit it, without redrawing and delays. The trend indicator monitors the direction of the medium-term trend, shows the direction and its change. The signal indicator is based on changes in volatility and shows market entries. The indicator is equipped with several types of alerts. Can be applied to various trading ins
現在40%OFF! 初心者やエキスパートトレーダーのためのベストソリューション! このダッシュボードソフトウェアは、28の通貨ペアで動作しています。それは私達の主要な指標(高度な通貨の強さ28と高度な通貨インパルス)の2に基づいています。それは全体の外国為替市場の大きい概観を与えます。それは、すべての(9)時間枠で28の外国為替ペアのための高度な通貨の強さの値、通貨の動きの速度と信号を示しています。チャート上で1つのインディケータを使用して市場全体を観察し、トレンドやスキャルピングの機会をピンポイントで見つけることができたら、あなたのトレードがどのように改善されるか想像してみてください。 このインディケータには、強い通貨と弱い通貨の識別、潜在的な取引の識別と確認がより簡単になるような機能が搭載されています。このインディケータは、通貨の強さや弱さが増加しているか減少しているか、また、すべての時間枠でどのように機能しているかをグラフィカルに表示します。 新機能として、現在の市場環境の変化に適応するダイナミックなマーケットフィボナッチレベルが追加され、すでに当社のAdvanced
Looking for a powerful yet lightweight swing detector that accurately identifies market structure turning points? Want clear, reliable buy and sell signals that work across any timeframe and any instrument? Buy Sell Arrow MT Swing is built exactly for that — precision swing detection made simple and effective. This indicator identifies Higher Highs (HH) , Higher Lows (HL) , Lower Highs (LH) , and Lower Lows (LL) with remarkable clarity. It is designed to help traders easily visualize market str
まず第一に、この取引インジケーターは再描画されず、再描画されず、遅延しないことを強調する価値があります。これにより、手動取引とロボット取引の両方に理想的なものになります。 ユーザーマニュアル:設定、入力、戦略。 アトミックアナリストは、価格の強さとモメンタムを利用して市場でより良いエッジを見つけるためのPA価格アクションインジケーターです。ノイズや誤ったシグナルを除去し、取引ポテンシャルを高めるための高度なフィルターを備えています。複雑なインジケーターの複数のレイヤーを使用して、アトミックアナリストはチャートをスキャンし、複雑な数学的計算をシンプルなシグナルと色に変換します。これにより、どのような初心者トレーダーでも理解して使用し、一貫した取引の決定を行うことができます。 「アトミックアナリスト」は、新規および経験豊富なトレーダー向けにカスタマイズされた包括的な取引ソリューションです。プレミアムインジケーターとトップノッチの機能を1つの取引戦略に組み合わせ、すべてのタイプのトレーダーにとって汎用性のある選択肢にします。 デイリートレーディングとスキャルピング戦略:高速で正確な
通貨強さウィザードは、取引を成功させるためのオールインワン ソリューションを提供する非常に強力な指標です。このインジケーターは、複数の時間枠のすべての通貨のデータを使用して、このまたはその外国為替ペアのパワーを計算します。このデータは、使いやすい通貨インデックスと通貨パワーラインの形式で表され、特定の通貨のパワーを確認するために使用できます。 必要なのは、取引したいチャートにインジケーターを接続することだけです。インジケーターは、取引する通貨の実際の強さを示します。このインジケーターは、トレンドに合わせて取引するときに有利に利用できる売買高の圧力の極値も示します。このインジケーターには、フィボナッチに基づく可能なターゲットも表示されます。 このインジケーターは、PUSH 通知を含むあらゆるタイプのアラートを提供します。 購入後ご連絡下さい。私の取引のヒントをあなたと共有し、素晴らしいボーナスインジケーターを無料で提供します! 幸せで有益な取引をお祈りします。
An exclusive indicator that utilizes an innovative algorithm to swiftly and accurately determine the market trend. The indicator automatically calculates opening, closing, and profit levels, providing detailed trading statistics. With these features, you can choose the most appropriate trading instrument for the current market conditions. Additionally, you can easily integrate your own arrow indicators into Scalper Inside Pro to quickly evaluate their statistics and profitability. Scalper Inside
Scalper Vault は、スキャルピングを成功させるために必要なすべてを提供するプロフェッショナルなスキャルピング システムです。このインジケーターは、外国為替およびバイナリー オプションのトレーダーが使用できる完全な取引システムです。推奨される時間枠は M5 です。 システムは、トレンドの方向に正確な矢印シグナルを提供します。また、トップとボトムのシグナルとギャン マーケット レベルも提供します。 インジケーターは、プッシュ通知を含むすべてのタイプのアラートを提供します。 インジケータの購入後にご連絡ください。私の個人的な取引の推奨事項と素晴らしいボーナス指標を無料で共有します! 幸せで有益な取引をお祈りします!
このインジケーターを購入すると、プロ仕様のトレードマネージャーを無料で差し上げます。 まず第一に、このトレーディングシステムがノンリペイント、ノンリドロー、ノンラグのインジケーターであることを強調する価値がある。これにより、手動取引とロボット取引の両方に理想的なものになっています。 オンラインコース、マニュアル、プリセットのダウンロード。 「スマートトレンドトレーディングシステム MT5」は、新規および経験豊富なトレーダー向けにカスタマイズされた包括的なトレーディングソリューションです。10以上のプレミアムインジケーターを組み合わせ、7つ以上の堅実なトレーディング戦略を備えており、多様な市場状況に対応する多目的な選択肢となっています。 トレンドフォロー戦略:トレンドを効果的に乗り越えるための正確なエントリーとストップロス管理を提供します。 リバーサル戦略:潜在的なトレンドの反転を特定し、トレーダーがレンジ相場を活用できるようにします。 スキャルピング戦略:高速で正確なデイトレードおよび短期取引のために設計されています。 安定性:すべてのインジケーターはノンリペイント、ノンリドロー、ノ
"Dragon's Tail" is an integrated trading system, not just an indicator. This system analyzes each candle on a minute-by-minute basis, which is particularly effective in high market volatility conditions. The "Dragon's Tail" system identifies key market moments referred to as "bull and bear battles". Based on these "battles", the system gives trade direction recommendations. In the case of an arrow appearing on the chart, this signals the possibility of opening two trades in the indicated directi
Gold Scalper Super is an easy-to-use trading system. The indicator can be used as a standalone scalping system on the M1 time frame, as well as part of your existing trading system. Bonus: when purchasing an indicator, Trend Arrow Super is provided free of charge, write to us after purchase. The indicator 100% does not repaint!!! If a signal appears, it does not disappear! Unlike indicators with redrawing, which lead to the loss of a deposit, because they can show a signal and then remove it.
Trend indicator AI
Ramil Minniakhmetov
4.62 (81)
Trend Ai indicatorは、トレンドの識別と実用的なエントリポイントと反転アラートを組み合わせることで、トレーダーの市場分析を強化する優れたツールです。 この指標は、ユーザーが自信と正確さで外国為替市場の複雑さをナビゲートすることを可能にします トレンドAiインジケーターは、主要なシグナル以外にも、プルバックやリトレースメント中に発生するセカンダリエントリポイントを識別し、トレーダーが確立されたトレンド内の価格修正を活用できるようにします。 重要な利点: *MT4およびMT5の仕事 *明確な買いまたは売りシグナル *再描画しません ·すべての資産で動作します 私はeaやセットをtelegram it詐欺で販売しないように注意してください。 すべての設定はここでブログで無料です。  重要! 指示とボーナスを得るために購入後すぐに私に連絡してください! 私の他のプロダクトと同様、実質操作の監視はここに見つけることができます: https://www.mql5.com/en/users/mechanic/seller&nbsp ; 設定および入力: すべての
FX Power: 通貨の強弱を分析して、より賢い取引を実現 概要 FX Power は主要通貨と金の実際の強弱をあらゆる市場状況で理解するための必須ツールです。強い通貨を買い、弱い通貨を売ることで、 FX Power は取引の意思決定を簡素化し、高い確率の取引機会を見出します。トレンドを追従する場合でも、極端なデルタ値を使用して反転を予測する場合でも、このツールはあなたの取引スタイルに完全に適応します。ただ取引するだけではなく、 FX Power で賢く取引をしましょう。 1. なぜ FX Power がトレーダーにとって非常に有益なのか 通貨と金のリアルタイム強弱分析 • FX Power は主要通貨と金の相対的な強弱を計算し、マーケットダイナミクスに関する明確な洞察を提供します。 • どの資産がリードしているか、または後れを取っているかを監視して、取引するペアを賢く選びましょう。 マルチタイムフレームの包括的なビュー • 短期、中期、長期のタイムフレームで通貨と金の強弱を追跡し、マーケットトレンドに基づいて取引戦略を調整できます。 • スキャルピングからスイングトレード
Pulse Scalping Line - an indicator for identifying potential pivot points. Based on this indicator, you can build an effective Martingale system. According to our statistics, the indicator gives a maximum of 4 erroneous pivot points in a series. On average, these are 2 pivot points. That is, the indicator shows a reversal, it is erroneous. This means that the second signal of the indicator will be highly accurate. Based on this information, you can build a trading system based on the Martingale
MetaForecast M4
Vahidreza Heidar Gholami
5 (2)
MetaForecastは、価格データのハーモニクスに基づいて、どんな市場の未来を予測し視覚化します。市場が常に予測可能ではありませんが、価格にパターンがある場合、MetaForecastは可能な限り正確な未来を予測できます。他の類似製品と比較して、MetaForecastは市場のトレンドを分析することでより正確な結果を生成することができます。 入力パラメータ Past size (過去のサイズ) MetaForecastが将来の予測を生成するために使用するバーの数を指定します。モデルは選択したバー上に描かれた黄色の線で表されます。 Future size (将来のサイズ) 予測すべき将来のバーの数を指定します。予測された将来は、ピンクの線で表示され、その上に青い回帰線が描かれます。 Degree (程度) この入力は、MetaForecastが市場で行う分析のレベルを決定します。 Degree 説明  0 Degree 0の場合、価格の全てのピークや谷、そして詳細をカバーするために、「Past size」の入力に大きな値を使用することが推奨されています。  1 (推奨) Degre
チャートを構成し、周期的な価格変動を識別するテクニカル指標。 どのチャートでも動作します。 いくつかの種類の通知。 グラフ自体に追加の矢印があります。 履歴を再描画せずに、キャンドルのクローズに取り組みます。 M5以上のTFを推奨します。 パラメータの使用と設定が簡単です。 異なるパラメータを持つ 2 つのインジケーターを使用する場合、他のインジケーターなしで使用できます。 入力パラメータは2つあります 周期性と信号持続時間 これら 2 つのパラメータは、チャート構造の処理を扱います。 Cyclicity - 反転サイクルが変化する頻度を調整し、サイクルを滑らかにします。 Signal duration - 最小数では価格変動の衝動を検出し、最大数では長期的なトレンドの動きを検出します。
Apollo SR Master は、サポート/レジスタンスゾーンを利用した取引をより容易かつ確実にする特別な機能を備えたサポート/レジスタンスインジケーターです。このインジケーターは、ローカル価格の高値と安値を検出することで、タイムラグなしでリアルタイムにサポート/レジスタンスゾーンを計算します。そして、新たに形成されたSRゾーンを確認するために、インジケーターは特別なシグナルを表示します。このシグナルは、SRゾーンを実際の売りまたは買いシグナルとして考慮して使用できることを示します。この場合、SRゾーンの強度が高まり、SRエリアからの取引が成功する確率も高まります。これがこのインジケーターの基本的な考え方です。 SRゾーンは、ストップロスとテイクプロフィットの設定を容易にします。シグナルの方向に応じて、SRゾーンの上または下のスペースをストップロスとして設定できます。さらに、反対側のSRゾーンは、潜在的なテイクプロフィットエリアとして設定できます。 また、Apollo SRマスターインジケーターをご利用のすべてのユーザーには、「Apollo Price Action System」
Introducing a powerful, precision-engineered indicator that seamlessly combines Pivot Points, Moving Averages, and Multi-Timeframe Analysis to deliver high-probability Buy and Sell signals in real-time. This tool is your strategic edge, designed to identify trend reversals, market momentum, and optimal trade entries, no matter your preferred trading style. Our algorithm goes beyond standard indicators—by analyzing multiple timeframes simultaneously, it spots true market turning points while fi
The Super Arrow Indicator provides non-repainting buy and sell signals with exceptional accuracy. Key Features No repainting – confirmed signals remain fixed Clear visual arrows: green for buy, red for sell Real-time alerts via pop-up, sound, and optional email Clean chart view with no unnecessary clutter Works on all markets: Forex, gold, oil, indices, crypto Adjustable Parameters TimeFrame Default: "current time frame" Function: Sets the time frame for indicator calculation Options: Can be set
このインジケーターは、反転ポイントと価格戻りゾーンを正確に表示します。     主要プレーヤー 。新たなトレンドが形成される場所を把握し、最大限の精度で意思決定を行い、すべての取引をコントロールします。 TREND LINES PRO インジケーターと組み合わせることで、その潜在能力を最大限に発揮します。 VERSION MT5 インジケーターが示す内容: 新しいトレンドの始まりに活性化する反転構造と反転レベル。 リスクと報酬の比率を最小限に抑えた利益 確定 と 損失停止の レベルの表示     RR 1:2   。 インテリジェントな削減ロジックによるストップロス。 指定されたインジケーターから 2 つのトレンド タイプの反転パターンを表示します。 指標: トレンドを追う   TREND LINES PRO   (世界的なトレンドの変化) TREND PRO   (クイックトレンド変更) シンプルで効果的   スキャナー   リアルタイムトレンド(新機能)。 マルチタイムフレームのインストゥルメント フィルタリング。 画面   利益     LOGIC AI信号の後。 当日プラス方
Meravith
Ivan Stefanov
5 (3)
マーケットメーカーのためのツール。 Meravith は次の機能を提供します: すべての時間足を分析し、現在有効なトレンドを表示します。 強気と弱気の出来高が等しくなる流動性ゾーン(出来高均衡)を強調表示します。 異なる時間足のすべての流動性レベルをチャート上に直接表示します。 テキスト形式の市場分析を生成し、参考情報として表示します。 現在のトレンドに基づいて目標値、サポートレベル、ストップロスを計算します。 取引のリスクリワード比を算出します。 口座残高に基づいてポジションサイズを計算し、潜在的な利益を推定します。 また、市場に大きな変化があった場合には警告を表示します。 インジケーターの主要ライン: 強気/弱気の出来高エグゾーストライン ― 目標値として機能します。 市場のトレンドを示すライン。市場が強気か弱気かによって色が変わり、トレンドのサポートとして機能します。主にその色が市場センチメントを示します。 出来高均衡ライン(Eq)。Eq(Volume Equilibrium)ラインはシステムの中核です。これは買い手と売り手の出来高のバランスポイントを表します。市場の流動性を示し
OFFER OFFER! The price of the indicator is kept at 75 dollars only from 20th Feb to 28th Feb. Full Fledged EA and Alert plus for alerts will also be provided in this offer along with the purchase of Indicator. Limited copies only at this price and Ea too. Grab your copy soon Alert plus for indicator with set file is kept in comment section with the image  SMC Blast Signal with FVG, BOS and trend Breakout The SMC Blast Signal is a Precise trading system for Meta Trader 4 that uses Smart Money Con
First 25 copies at $80, after that price becomes $149 (3 copies left) Gold Signal Pro is a powerful MT4 indicator designed to help traders spot strong price reactions in the market. It focuses on clear wick rejections , showing when price strongly rejects a level and often continues in the same direction. Gold Signal Pro is mainly built for scalping gold (XAUUSD) and works best on lower timeframes like M5 and M15 , where timing matters most. That said, it can also be used on any forex pair, a
デイトレーダーマスターは、デイトレーダーのための完全なトレーディングシステムです。システムは2つのインジケーターで構成されています。 1つの指標は売買する矢印信号です。それはあなたが得る矢印インジケーターです。 2つ目のインジケーターを無料で提供します。 2番目のインジケーターは、これらの矢印と組み合わせて使用​​するために特別に設計されたトレンドインジケーターです。 インジケーターは繰り返さず、遅れないでください! このシステムの使用は非常に簡単です。 2色の線で表示されている現在のトレンドの方向に矢印信号をたどる必要があります。青は買いの傾向です。赤い色は売りの傾向です。青い矢印は買いシグナルです。赤い矢印は売りの合図です。トレンドラインの色と一致するように、矢印の色と信号の方向が必要です。 矢印インジケーターは、主に時間間隔M5とM15での日中取引のために作成されました。ただし、技術的には、システムは他の時間間隔で使用できます。 インジケータには、PUSHメッセージ機能を備えたポップアップアラートが装備されています。 購入後、必ず私に書いてください!私はあなたにシステムとの取引の
SHOGUN Trade - 16年間無調整の衝撃。戦略的市場構造と損小利大の極意 2月スペシャルセール – 特別価格 $88(通常価格 $199)! Click here for the MT5 version   https://www.mql5.com/ja/market/product/160183 これが最新のリリースです。  https://www.mql5.com/ja/market/product/166253   この特別オファーは 2月28日 までの期間限定です。 私たちは現在、 さらなる製品開発と最適化 に注力しております。皆様からの貴重なフィードバックを製品に反映させるため、レビューへのご協力を条件にこの割引価格で提供させていただきます。皆様からいただくご意見は、次回のアップデートや新機能の追加に直接活用させていただきます。 開発者も戦慄した「16年間」の真実 まず、添付した画像(バックテスト結果)をご覧ください。これはUSDJPY H1における、**2010年1月1日から2026年1月1日までの「丸16年間」**の検証結果です。 これはEA(自動
作者のその他のプロダクト
It is an analogue of the indicator of levels at https://www.mql5.com/en/market/product/24273 for the MetaTrader 5 platform. The indicator shows the levels of the past month, week and day. In addition, it draws a level in percentage relative to the difference between the High and Low of the past month and week. For the daily levels of the past day, the Close levels are additionally displayed. All you need to do is to configure the display parameters of the levels to your liking. In some cases, af
It is widely known that colors affect the emotional state of a human, especially if this human is a trader. Psychologists recommend that you follow your instincts and select the color of your environment that is most comfortable to you. In order to reduce emotional stress, impact of colors on a person should be considered. The optimal range of the most beneficial colors includes green, yellow-green and green-blue ones. This indicator allows you to manage your emotional state and health. Choose a
FREE
This is an interactive and easy-to-set indicator which allows to form seven equally spaced channels which have your settings simultaneously. All seven channels are enabled by default. But you can easily enable one or another channel using control buttons located in the upper case of the indicator's control panel. You can change a period of the indicator calculation by clicking one of buttons indicating number of the channel in the lower case of the control panel. Two other buttons (one of them i
This EA represents an interactive panel with adjustable parameters destined for installation and deletion of pending orders (orders grid generator). You can place the panel anywhere on the screen or hide it into a dot clicking on the button in the upper left part of the chart (it will be shown after clicking on it for the second time). Number and step of orders, lot size, vertical shift for limit orders - all these things make your work easier. There are functions for restoring according to pend
The purpose of the indicator is drawing an equidistant channel. It is somewhat different from the traditional model. The choice of control parameters is simple and does not require any special description. Enter the calculation interval in hours and the solution to the problem will appear on the screen. Please note that the time involved in calculation of the channel must be greater than the timeframe it will be displayed on. If the parameters you enter are beyond the allowable limits, you will
This indicator is designed for drawing equidistant channels. Two options are available: based on the number of hours in the indicator calculation and by the number of bars. To draw a channel, enter a number 1 or greater. The maximum value is limited by the amount of visible bars. If the parameters you enter are beyond the allowable limits, you will get notified if the indicator restrictions. Please note that the time involved in calculation of the channel must be greater than the timeframe it wi
This is a well-known ZigZag indicator. But it differs by the fact that its plot is based on values of the middle line which is set by a user. It can display Andrews’ Pitchfork and standard or Bobokus Fibo levels. NO REPAINTING. Parameters Period МА — middle line period. Default value is 34. Minimum value is 4. Maximum value is set at your discretion. Used to calculate price - base price to calculate the middle line. The averaging method - method of smoothing the middle line. Turning pitchfork —
The indicator displays the moving average of all periods on one chart. It shows the MA of a one step lower timeframe and all the MAs equal to and higher than it. Parameters Period moving average - Moving Average period (default is 34); Used to calculate price - price used for the MA calculation (default is the average price = (high+low)/2); The averaging method - default is linear-weighted; Moving average shift - MA shift (default is 0). Just enter the MA calculation period and its parameters,
Desk Analytical Table Portfolio Monitoring for Active Traders Overview: The Desk Analytical Table indicator is a professional tool designed for traders managing multiple financial instruments simultaneously. It consolidates key data on open positions, orders, and market statistics into a single window, ensuring seamless portfolio control even during high-intensity trading sessions. Key Features: ️ Multi-Instrument Analysis - Monitor up to 30 assets in real time with quick switching between inst
This is a prototype of the famous Control and management of transactions panel. There are two main differences: Allows to work with all the variety of financial instruments opened by a user and not only with instruments it was attached to; To activate levels of order closure hidden from a broker, it uses not lines but modifiable virtual levels. To enjoy the full functionality of the panel you are advised to have: Desk analytical table . Their combined operation allows to keep the situation under
Inform Panel For ALL Symbols — Advanced Multi-Instrument Trading Management The Inform Panel For ALL Symbols is a sophisticated trading management tool designed to streamline control over all financial instruments in a trader’s portfolio, eliminating the need to attach it to specific charts. Its core innovation lies in using modifiable virtual levels for stop loss (SL) and take profit (TP), allowing discreet order closure hidden from brokers. The panel automatically detects and lists all active
The indicator is based on the two-buffer scheme and does not require any additional settings. It can be used on any financial instrument without any restrictions. The indicator is a known ZigZag, but it does not redraw . The indicator allows to easily detect significant levels on the price chart, as well as demonstrates the ability to determine the probable direction of a price movement. The calculations are based on the candles' Close prices, thus improving the reliability of the levels. Param
The idea of the indicator stems from the necessity to clearly define the borders of support and resistance levels, which helps to plan the opening and closing of positions in the areas that most appropriately determine the process. Look at the breakdowns of the resistance level that confirm the intention of the price to continue the upward movement, after it passed the support level and entered the channel formed by the two levels. The same is for the case when the price enters the channel downw
This indicator is a logical extension of the product at https://www.mql5.com/en/market/product/12526 . The only difference is that price movement is displayed using a histogram with levels, allowing to assess the direction and strength of the movement. How to interpret the signal: 0 - the middle of the channel; above 0.5 - the breakdown of the channel up; below -0.5 - the breakdown of the channel down. Both indicators are displayed in the attached screenshots. Install the indicator and you will
This indicator is the logical continuation of the well-known equidistant channel indicator: https://www.mql5.com/en/market/product/8723 . The main purpose of the indicator is the visualization of price levels relative to the parallel channel using Fibo Bobokus levels in a separate window and the price history. This often allows forecasting the future price movement with a sufficiently high degree of probability. The Fibo levels calculation equation is as follows: FiboLevel = (50-(100*((Close[i]-
This simple to use utility allows opening charts from the list of financial instruments by left clicking their names. The chart window is opened using the Default template. The template name can be changed to one of those stored in Charts-Templates section of the terminal. It is possible to customize the background colors of panels and their labels, and also to select the display type for a more comfortable working environment. This is all you need to know in order to see the result quickly. Pa
If you need to quickly evaluate the results of trading on a current financial instrument by hypothetical price movement in the chosen direction and up to a certain level, set the indicator on any chart that contains open positions and move the line to the desired level after it appears together with the results tab. This is all you need to understand what happens to your deposit if the price is at this level without taking into account existing stop loss and take profit. Enable considering pendi
This is an individual tool for analyzing the market situation. It is very simple to use. After attaching the indicator to the chart, you will see three vertical lines named "VLine 1", "VLine 2" and "VLine 3", following in this order from left to right. For the utility to operate correctly, this sequence should always be observed. Please note: at the first start, the lines are not bound to specific price levels on the chart. This should be done by user in accordance with the following rule: if li
This indicator displays a set of moving average lines across all higher timeframes. The indicator can be installed on any financial instrument and any timeframe. For the analysis of the lines, a panel with timeframe values is provided in the lower right corner. Using the panel, you can easily enable/disable the display of the MA line of any higher timeframe. This allows a more thorough analysis of the market situation. The color of the button matches the color of the moving average line. Parame
This indicator is designed for monitoring RSI levels on the current and higher timeframes. The control panel is user friendly and consists of buttons, with which you can control the display of lines as per the names of the buttons. The button color matches the line color. Parameters "___| Settings of the main indicator " RSI Period - averaging period for index calculation (default is 14); RSI Price type - price used for calculations (default is the Close price); "___| Color palette " Text color
Этот индикатор предназначен для контроля уровней CCI на текущем и старших от него таймфреймах. Панель управления проста в понимании и состоит из кнопок, с помощью которых можно управлять отображением линий, соответствующим указанным на наименовании кнопок. Цвет кнопки совпадает с цветом линии. Этот индикатор из серии подобных индикаторов, которые уже успели завоевать популярность: https://www.mql5.com/ru/market/product/30276 и https://www.mql5.com/ru/market/product/30403 Параметры "___| Setti
This is a well-known ZigZag indicator. But it differs by the fact that its plot is based on values of the middle line which is set by a user. It can display Andrews’ Pitchfork and standard or Bobokus Fibo levels. NO REPAINTING. Parameters Period МА — middle line period. Default value is 34. Minimum value is 4. Maximum value is set at your discretion. Used to calculate price — type of price used for the midline calculations. The averaging method — type of smoothing for the middle line. Turning p
The indicator is similar to https://www.mql5.com/en/market/product/12330 . However, it considers the MQL5 platform features. Peaks and bottoms are calculated based solely on external bars. After a swing is formed, the indicator does not redraw providing opportunities for traders working on horizontal level breakthroughs. Traffic can be reduced by changing the amount of calculated bars in the MinBars variable (default value is 500). All you need is to select the output options, so that you can se
The indicator is based on the two-buffer scheme and does not require any additional settings. It can be used on any financial instrument without any restrictions. The indicator is a known ZigZag, but it does not redraw . The indicator allows to easily detect significant levels on the price chart, as well as demonstrates the ability to determine the probable direction of a price movement. The calculations are based on the candles' Close prices, thus improving the reliability of the levels. Param
フィルタ:
CodeFaceCrunch
161
CodeFaceCrunch 2021.12.16 17:26 
 

ユーザーは評価に対して何もコメントを残しませんでした

Boaz
88
Boaz 2021.09.05 15:17 
 

ユーザーは評価に対して何もコメントを残しませんでした

cvdestyfx
2885
cvdestyfx 2019.12.11 06:04 
 

ユーザーは評価に対して何もコメントを残しませんでした

Yuriy Suslov
374
Yuriy Suslov 2018.09.24 20:59 
 

ユーザーは評価に対して何もコメントを残しませんでした

Singgih Wasito Adhi
355
Singgih Wasito Adhi 2018.04.26 20:11 
 

ユーザーは評価に対して何もコメントを残しませんでした

John Greydanus
597
John Greydanus 2017.10.06 04:09 
 

ユーザーは評価に対して何もコメントを残しませんでした

Jenny Ramages
238
Jenny Ramages 2017.08.28 18:26 
 

ユーザーは評価に対して何もコメントを残しませんでした

Ali irwan
5137
Ali irwan 2017.08.03 07:28 
 

ユーザーは評価に対して何もコメントを残しませんでした

レビューに返信