Inform Panel For ALL Symbols

1

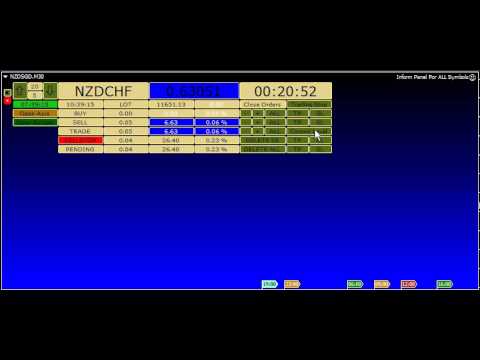
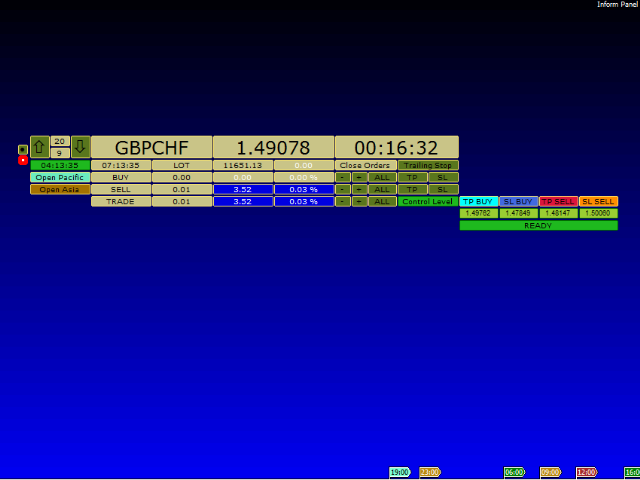
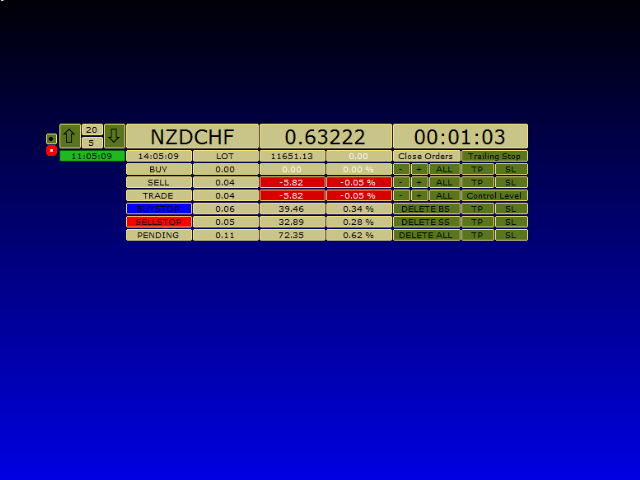
Inform Panel For ALL Symbols — Advanced Multi-Instrument Trading Management

The Inform Panel For ALL Symbols is a sophisticated trading management tool designed to streamline control over all financial instruments in a trader’s portfolio, eliminating the need to attach it to specific charts.

Its core innovation lies in using modifiable virtual levels for stop loss (SL) and take profit (TP), allowing discreet order closure hidden from brokers. The panel automatically detects and lists all active symbols, providing intuitive navigation via "Up" and "Down" buttons, and offers robust tools for order execution and risk management.

Key Features

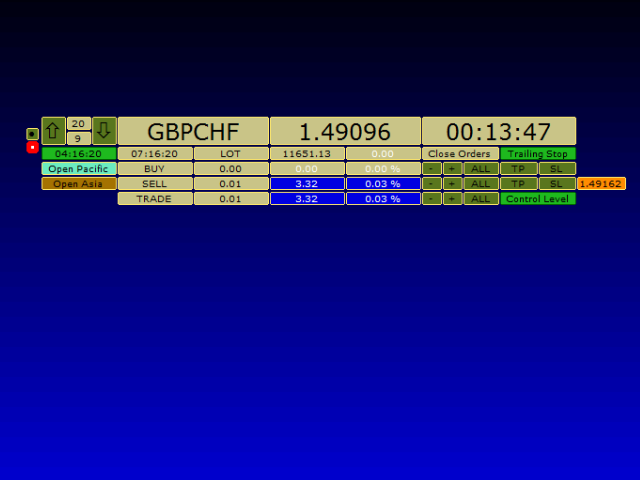
▪️ Multi-Symbol Support

Manage orders across all opened financial instruments from a single interface.

Navigate symbols effortlessly using dedicated buttons.

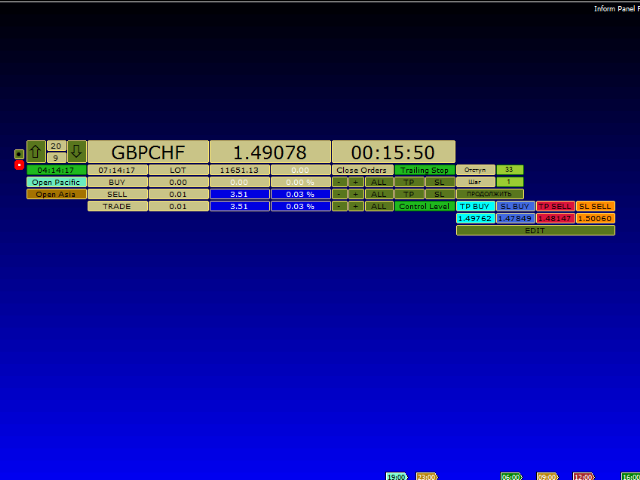
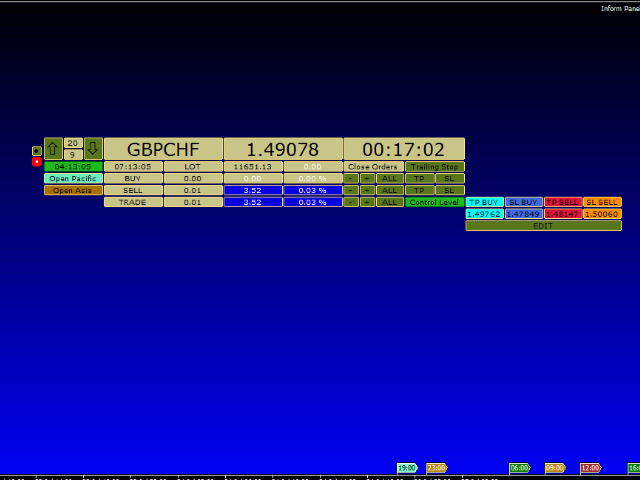
▪️ Virtual Levels for Stealth Trading

Replace visible chart lines with customizable virtual levels to mask TP/SL from brokers.

Compatible with both market orders and pending orders.


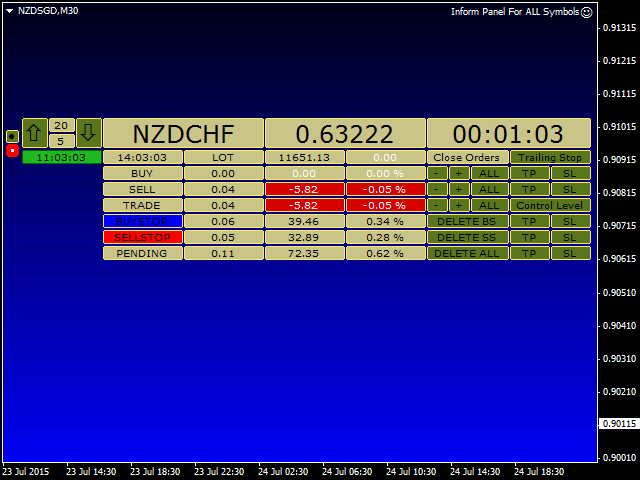
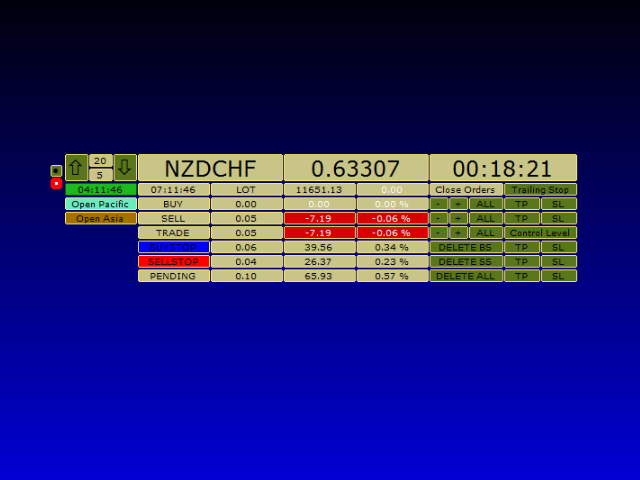
▪️ Advanced Order Control

Close orders by symbol, magic number, profit/loss, or trailing stop.

Delete pending orders selectively by direction.

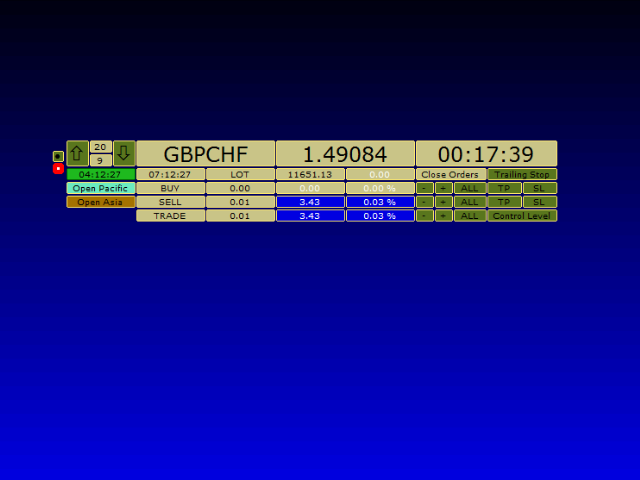
Trailing Stop Options

Virtual Trailing Stop: Activated with both "Control Level" and "Trailing Stop" engaged.

Real Trailing Stop: Triggered with "Control Level" active and "Trailing Stop" released.

▪️ Customizable Interface

Adjust panel colors, background, and element visibility.

Toggle confirmation dialogs for faster execution.

▪️ Position Analytics

Real-time data per symbol:

Order type (market/pending).

Total position size (lots).

Funds allocated (% of deposit and absolute value).

One-Click Actions

Close Loss Orders

Close Profit Orders

Close All

Parameters

▪️ Visual Settings

Include Background?: Enable/disable panel background.

Background Color: Customize screen backdrop (e.g., MediumBlue).

▪️ Order Management

Magic Number: Filter orders by magic number (0 = all symbols).

CloseTrades: true closes all symbol orders; false closes by magic number.

Confirmation of Action: Enable/disable prompts for order removal.


Setup

1. Attach the EA to any chart without open positions to avoid conflicts.

2. In chart properties:

Enable "Line" and "Chart Shift".

Set "Grid" and "Line" to "None".

The panel combines efficiency for multi-asset portfolios, discretion through virtual levels, and flexibility in risk management, making it ideal for traders seeking centralized control over diverse instruments.


おすすめのプロダクト
StealthTrade Commander is an advanced visual trading panel and risk-management utility designed for manual traders, scalpers, and Prop-Firm challengers. This tool helps you execute trades visually directly from the chart, hide your Stop Loss and Take Profit levels from the broker, and strictly control your daily drawdown—a crucial feature for passing and keeping Prop-Firm funded accounts.  KEY FEATURES:  Risk Guardian (Prop-Firm Protector) Max Daily Loss Limit: Automatically closes all trades an
Candlestick Pattern Scanner is a multi-timeframe and multi-symbol dashboard and alert system that checks all timeframes and currency pairs for different candlestick patterns that are formed in them. Scanner is integrated with support and resistance zones so you can check the candlestick patterns in the most important areas of the chart to find breakout and reversal patterns in the price chart. Download demo version   (works on M30,D1,W1 timeframes and 20 symbols of Market Watch window) Read the
「Auto FIBO Pro」Crypto_Forex インジケーターは、取引の補助ツールとして最適です。 - インジケーターは、フィボナッチ レベルとローカル トレンド ライン (赤色) を自動的に計算してチャート上に配置します。 - フィボナッチ レベルは、価格が反転する可能性のある重要な領域を示します。 - 最も重要なレベルは、23.6%、38.2%、50%、61.8% です。 - リバーサル スキャルピングやゾーン グリッド取引に使用できます。 - Auto FIBO Pro インジケーターを使用して、現在のシステムを改善する機会も多数あります。 - Info Spread Swap Display があり、接続されている外国為替ペアの現在のスプレッドとスワップを表示します。 - ディスプレイには、アカウントの残高、エクイティ、マージンも表示されます。 - Info Spread Swap Display は、チャートのどのコーナーにも配置できます。 0 - 左上コーナー、1 - 右上、2 - 左下、3 - 右下。 高品質のトレーディングロボットとインジケーターをご覧にな
Product Name: Risk Commander: Trade Assistant & Strategy Simulator Risk Commander is more than just a trade panel—it is a complete Manual Trading Ecosystem . It serves two powerful purposes: Live Assistant: Helps you execute trades with speed, precision, and perfect risk management in real-time markets. Training Simulator: Fully compatible with the Strategy Tester (Visual Mode) , allowing you to practice manual trading on historical data without risking a cent. NEW! Built-in Simulator Mode S
"Impulses and Corrections 4" is created to help traders navigate the market situation. The indicator shows multi-time frame upward and downward "Impulses" of price movements. These impulses are the basis for determining the "Base" , which is composed of zones of corrections of price movements, as well as "Potential" zones for possible scenarios of price movement. Up and down impulses are determined based on a modified formula of Bill Williams' "Fractals" indicator. The last impulse is always "U
The indicator displays the data of the Stochastic oscillator from a higher timeframe on the chart. The main and signal lines are displayed in a separate window. The stepped response is not smoothed. The indicator is useful for practicing "manual" forex trading strategies, which use the data from several screens with different timeframes of a single symbol. The indicator uses the settings that are identical to the standard ones, and a drop-down list for selecting the timeframe. Indicator Paramet
TradePilot
Hossein Khalil Alishir
TradePilot Expert Advisor (EA) for MetaTrader 4 TradePilot is a professional and user-friendly Expert Advisor (EA) for MetaTrader 4 (MT4) . It simplifies automated trading , risk management , and trade execution using a smart trading panel . Perfect for beginners and experienced traders looking for a reliable trade manager EA with automated lot size calculation . Key Advantages User-Friendly Trading Panel: Customizable panel with buttons and hotkeys. Smart Risk Management: Supports percen
これは、キャンドルの終値を予測する指標です。 このインジケータは、主にD1チャートでの使用を目的としていますが. この指標は、従来の外国為替取引とバイナリオプション取引の両方に適しています。 インジケーターは、スタンドアロンのトレーディングシステムとして使用することも、既存のトレーディングシステムへの追加として機能させることもできます。 このインジケーターは、現在のキャンドルを分析し、キャンドル自体の内部の特定の強度係数と、前のキャンドルのパラメーターを計算します。 したがって、この指標は、市場の動きのさらなる方向性と現在のキャンドルの終値を予測します。 この方法のおかげで、この指標は、短期の日中取引だけでなく、中期および長期の取引にも適しています。 インジケーターを使用すると、市場の状況の分析中にインジケーターが生成する潜在的な信号の数を設定できます。 インジケーターの設定には、このための特別なパラメーターがあります。 また、インジケーターは、チャート上のメッセージの形式で、電子メールで、およびPUSH通知の形式で、新しい信号について通知することができます。 購入後は必ず私に書いて
This utility is designed to help you with your Manual Trading. It allows different ways of closing trades. It can display total number of BUY and SELL orders individually and also their individual profits. It can enter trades without stopl loss and take profits. However upon selecting UseStopLossTakeProfit from the settings it can use best possible stop loss and take profits based on the market conditions. Upon selecting the CloseOppositeTrades  from the settings it can close opposite trades. Fo
Noize Absorption Index - is the manual trading system that measures the difference of pressure between bears forces and bulls forces. Green line - is a noize free index that showing curent situation. Zero value of index shows totally choppy/flat market.Values above zero level shows how powerfull bullish wave is and values below zero measures bearish forces.Up arrow appears on bearish market when it's ready to reverse, dn arrow appears on weak bullish market, as a result of reverse expectation. S
Owl smart levels
Sergey Ermolov
4.26 (38)
MT5版  |   FAQ Owl Smart Levels Indicator   は、 Bill Williams   の高度なフラクタル、市場の正しい波構造を構築する Valable ZigZag、エントリの正確なレベルをマークする Fibonacci レベルなどの一般的な市場分析ツールを含む 1 つのインジケーター内の完全な取引システムです。 利益を得るために市場と場所に。 戦略の詳細な説明 インジケータを操作するための指示 顧問-取引助手 プライベートユーザーチャット ->購入後に私に書いて、私はプライベートチャットにあなたを追加し、あなたはそこにすべてのボーナスをダウンロードすることができます 力はシンプルさにあります! Owl Smart Levels   取引システムは非常に使いやすいので、専門家にも、市場を勉強し始めて自分で取引戦略を選択し始めたばかりの人にも適しています。 戦略と指標に秘密の数式や計算方法が隠されているわけではなく、すべての戦略指標は公開されています。 Owl Smart Levels を使用すると、取引を開始するためのシグナルをすばやく確認し、注
まず第一に、この取引ツールはノンリペイント、ノンリドロー、ノンラグの指標であり、プロの取引に理想的ですことを強調する価値があります。 オンラインコース、ユーザーマニュアル、デモ。 スマートプライスアクションコンセプトインジケーターは、新米から経験豊富なトレーダーまで、非常 に強力なツールです。Inner Circle Trader AnalysisやSmart Money Concepts Trading Strategiesなど、20以上の有用な指標を1つに組み合わせています。このインジケーターはスマートマネーコンセプトに焦点を当て、大手機関の取引方法を提供し、彼らの動きを予測するのに役立ちます。 特に、流動性分析に優れており、機関がどのように取引しているかを理解しやすくしています。市場のトレンドを予測し、価格の動きを慎重に分析するのに優れています。機関の戦略とトレードを合わせることで、市場の動向についてより正確な予測ができます。このインジケーターは多目的であり、市場構造を分析し、重要な注文ブロックを特定し、さまざまなパターンを認識するのに優れています。 このインジケーターは
VR Cub
Vladimir Pastushak
VR Cub は、質の高いエントリーポイントを獲得するためのインジケーターです。このインジケーターは、数学的計算を容易にし、ポジションへのエントリーポイントの検索を簡素化するために開発されました。このインジケーターが作成されたトレーディング戦略は、長年にわたってその有効性が証明されてきました。取引戦略のシンプルさはその大きな利点であり、初心者のトレーダーでもうまく取引することができます。 VR Cub はポジション開始ポイントとテイクプロフィットとストップロスのターゲットレベルを計算し、効率と使いやすさを大幅に向上させます。取引の簡単なルールを理解するには、以下の戦略を使用した取引のスクリーンショットを見てください。 設定、設定ファイル、デモ版、説明書、問題解決方法は、以下から入手できます。 [ブログ] レビューを読んだり書いたりすることができます。 [リンク] のバージョン [MetaTrader 5] エントリーポイントの計算ルール ポジションをオープンする エントリーポイントを計算するには、VR Cub ツールを最後の高値から最後の安値までストレッチする必要があります。 最初
We present you the indicator "Candle closing counter", which will become your indispensable assistant in the world of trading. That’s why knowing when the candle will close can help: If you like to trade using candle patterns, you will know when the candle will be closed. This indicator will allow you to check if a known pattern has formed and if there is a possibility of trading. The indicator will help you to prepare for market opening and market closure. You can set a timer to create a pre
Product Description: MT4 Trade Copier with Advanced Features MT4  Trade Copier is designed to streamline and enhance your trading experience by allowing seamless replication of trades across multiple accounts. It offers advanced features to cater to different trading needs and preferences. Features: Master/Slave Selection: Easily choose between master and slave modes to manage trades effectively. Multiplier for Slave Accounts: Set a multiplier to adjust the size of trades copied to slave a
Price Magnet — Price Density and Attraction Levels Indicator Price Magnet is a professional analytical tool designed to identify key support and resistance levels based on statistical Price Density. The indicator analyzes a specified historical period and detects price levels where the market spent the most time. These zones act as “magnets,” attracting price action or forming a structural base for potential reversals. Unlike traditional Volume Profile tools, Price Magnet focuses on price-time d
The indicator shows the potential trend direction by cyclical-wave dependence. Thus, all the rays of the intersection will be optimal rays, in the direction of which the price is expected to move, taking into account the indicator period. Rays can be used as a direction for potential market movement. But we must not forget that the approach must be comprehensive, the indicator signals require additional information to enter the market.
"The trend is your friend" is one of the best known sayings in investing, because capturing large trendy price movements can be extremely profitable. However, trading with the trend is often easier said than done, because many indicators are based on price reversals not trends. These aren't very effective at identifying trendy periods, or predicting whether trends will continue. We developed the Trendiness Index to help address this problem by indicating the strength and direction of price trend
Super Reversal Pattern Indicator Unlock the power of advanced pattern recognition with our Super Reversal Pattern Indicator. Designed for traders seeking precision and reliability, this indicator identifies one of the most effective reversal patterns in technical analysis, offering a significant edge in your trading strategy. Key Features: Non-Repainting Accuracy: Enjoy the confidence of non-repainting technology. Once a Super Reversal Pattern is detected, it remains static, providing consiste
Gold Bricks FX USES THE TREND WAVE INDICATOR AND IT CAN IDENTIFY THE BEGINNING AND THE END OF A NEW WAVE TREND MOVEMENT. AS AN OSCILLATOR, THE INDICATOR IDENTIFIES THE OVERBOUGHT AND OVERSOLD ZONES. IT WORKS GREAT TO CATCH THE SHORT TERM PRICE REVERSALS AND USES A MARTINGALE STRATEGY TO CLOSE ALL TRADES IN PROFIT. USE DEFAULT SETTINGS ON H1 OR HIGHER TIME FRAME ON ANY PAIR FOR MORE ACCURATE TRADES WHY THIS EA : Smart entries calculated by 4 great strategies The EA can be run on even a $300
Trade with Gann on your side!! MASTER CIRCLE 360 CIRCLE CHART, originally created by Gann admitted that this is “The Mother of all charts”. It is one of the last studies that this great trader left for us. The numeric tab le is apparently quite simple like all the tables and is based on square numbers, the SQUARE OF 12 and is by evolution, one of the most important square numbers. Here we can find CYCLE, PRICE AND TIME thanks to angles and grades, to show past and future support and resistance.
BreakEven Line is a very useful and easy to use indicator. In case of multiple positions opened on the same instrument, the indicator shows the breakeven point where it is possible to close the positions. Its graphic simplicity makes it an unobtrusive and customizable tool. You can enable/disable a line on a chart, so you can make the indicator invisible. Inputs Show cumulative BE (line on/off) Breakeven line color (to change the line color) Breakeven line style Breakeven line width Show short B
Magic Filter MTF is perfect for any strategy. you do not need to load the chart with extra indicators like this one indicator will replace all additional filters for you it can also be a great strategy. it combines well with trading at local minima and maximums (resistance levels) multi-timeframe-multi-currency indicator 4 screen system is used 4 rows of arrows UTB indicators adjusted for different periods when two arrows pointing in the same direction on the same timeframe coincide,I t c
Magical Arrow
Ranguni Abdulsamir Abdulmajid
Magical Arrow Indicator – Clear & Reliable Signals The Magical Arrow Indicator is a non-repainting, trend-following tool that gives you crystal-clear Buy and Sell signals . It  high-probability reversals and entries . No more guesswork – just follow the arrows on your chart! The Magical Arrow Indicator is a powerful, easy-to-use trading tool that helps you catch the most profitable Buy and Sell opportunities in the Forex market. It is designed for beginners and professional traders , giving y
This indicator presents an alternative approach to identify Market Structure. The logic used is derived from learning material created by   DaveTeaches (on X) Upgrade v1.10: add option to put protected high/low value to buffer (figure 11, 12) When quantifying Market Structure, it is common to use fractal highs and lows to identify "significant" swing pivots. When price closes through these pivots, we may identify a Market Structure Shift (MSS) for reversals or a Break of Structure (BOS) for co
トレンドラインマップインジケーターは、トレンドスクリーナーインジケーターのアドオンです。トレンドスクリーナー(トレンドラインシグナル)によって生成されたすべてのシグナルのスキャナーとして機能します。 これは、トレンドスクリーナーインジケーターに基づくトレンドラインスキャナーです。 Trend Screener Pro インジケーターがない場合、Trend Line Map Proは機能しません。 ブログにアクセスすると、トレンドラインマップインジケーターの無料バージョンをダウンロードできます。 Metatrader Testerの制限なしで、購入する前に試してみてください。 :    ここをクリック 1.簡単になる利点 通貨と時間枠に基づいて売買シグナルを表示します。 チャートに矢印が表示されてから価格が増減したピップ数を評価します。 (トレンドスクリーナーインジケーター矢印) 信号のタイミングを表示します。 アラートを売買するための複数の時間枠と複数の通貨のアラートを取得します。 2.トレンドラインマップの使用方法 売買シグナルダッシュボードを表示する方法は?
Trade panel manual is a multifunctional trading assistant. It allows you to open market and pending orders in one click. Value is set via button menu edit or deleted by specific buttons pending orders and the value of take profit and stop loss in one click. Through the edit menu of the button, a value is set that can be easily changed by simply moving level_tp lines for take profit or stop loss levels and for pending orders. It is possible to select orders and determine for them and set the leve
The Point61 indicator is the result of many years of monitoring of price behavior of currency pairs and metals. It is not a secret, that in times of uncertainty, traders are looking for possible levels of support and resistance - the point, where price should stop its movement. There are 2 possible scenarios at these points: 1. Reverse (correction) to the opposite direction; 2. Breakthrough to continue movement. Very often these points are used to set stop orders - TakeProfit or StopLoss
An indicator of pattern #31 ("Long Island") from Encyclopedia of Chart Patterns by Thomas N. Bulkowski. The second gap is in the opposite direction. Parameters: Alerts - show alert when an arrow appears   Push - send a push notification when an arrow appears (requires configuration in the terminal) GapSize - minimum gap size in points ArrowType - a symbol from 1 to 17 ArrowVShift - vertical shift of arrows in points   ShowLevels - show levels ColUp - color of an upward line ColDn - color of a
What are Heiken Ashi Candles? Heiken Ashi, derived from the Japanese term 'Heikin Ashi,' translates to average price bars. It's an indicator depicting price bars on a chart. Formula for Heiken Ashi candles: - Heiken Ashi opening price: (previous candle's opening + closing price) / 2 - Closing price Heiken Ashi: (opening + high + low + closing) / 4 - Heiken Ashi peak: Max of high, opening, or closing price - Heiken Ashi bottom price: Min of low, opening, or closing price How to Read Heiken A
このプロダクトを購入した人は以下も購入しています
Local Trade Copier EA MT4
Juvenille Emperor Limited
4.96 (108)
Local Trade Copier EA MT4 による、驚くほど高速な取引コピーを体験してください。1分で簡単にセットアップできるこの取引コピー機は、同じWindowsコンピュータまたはWindows VPS上の複数のMetaTrader端末間で取引をコピーすることができ、0.5秒未満の高速コピースピードを実現します。 初心者であろうとプロのトレーダーであろうと、 Local Trade Copier EA MT4 には、あなたの特定のニーズに合わせてカスタマイズするための幅広いオプションが用意されています。これは、利益の可能性を高めたい人にとって究極のソリューションです。 今すぐ試してみて、これが市場で最も速くて簡単なトレードコピー機である理由を理解してください。 ヒント: デモアカウントで Local Trade Copier EA MT4 デモバージョンをダウンロードして試すことができます: ここ ダウンロードした無料のデモ ファイルを MT4 >> ファイル >> データ フォルダを開く >> MQL4 >> Experts フォルダに貼り付けて、ターミナルを再起動しま
Trade Assistant MT4
Evgeniy Kravchenko
4.42 (193)
取引 ごとのリスクの 計算、新規注文 の 簡単 な 設置、部分的 な 決済機能 を 持 つ 注文管理、 7 種類 のトレーリングストップなど 、便利 な 機能 を 備 えています 。 追加の資料と説明書 インストール手順 - アプリケーションの手順 - デモアカウント用アプリケーションの試用版 ライン機能 チャート上にオープニングライン、ストップロス、テイクプロフィットを表示します。この機能により、新規注文を簡単に設定することができ、注文を出す前にその特徴を確認することができます。   リスク計算 リスク計算機能は、設定されたリスクとストップロス注文のサイズを考慮して、新規注文のボリュームを計算します。ストップロスの大きさを自由に設定できると同時に、設定したリスクを守ることができます。 Lot calc ボタン - リスク 計算 を 有効 / 無効 にします 。 Risk フィールドでは 、必要 なリスクの 値 を 0 から 100 までのパーセンテージまたは 預金通貨 で 設定 します 。 設定」 タブで 、 リスク 計算 の 種類 を 選択 します :「 $ 通貨」、「 % 残
Exp COPYLOT CLIENT for MT4
Vladislav Andruschenko
4.69 (65)
MetaTrader4のコピー機を取引します。     それは任意の口座からの外国為替取引、ポジション、注文をコピーします。 それは最高の貿易コピー機の1つです     MT4 - MT4、MT5 - MT4     のために     COPYLOT MT4     バージョン(または     MT4 - MT5  MT5 - MT5     のために     COPYLOT MT5     バージョン)。 MT5のバージョン 完全な説明   +DEMO +PDF 購入する方法 インストールする方法     ログファイルの取得方法     テストと最適化の方法     Expforex のすべての製品 のコピー機 バージョン       MetaTrader 5 ターミナル(   МТ5 - МТ5、МТ4 - МТ5   )-   コピーロットクライアントMT5 独自のコピーアルゴリズムにより、すべての取引がマスターアカウントからクライアントアカウントに正確にコピーされます。 また、動作速度が速いことでも知られています。タフなエラー処理。 強力な機能セット。 プログラムは、複数
Trade Manager EAへようこそ。これは、取引をより直感的、正確、そして効率的にするために設計された究極の リスク管理ツール です。これは単なるオーダー実行ツールではなく、包括的な取引計画、ポジション管理、リスク管理のためのソリューションです。初心者から上級者、迅速な実行を必要とするスキャルパーまで、Trade Manager EAはあらゆるニーズに対応し、為替、指数、商品、暗号通貨などさまざまな市場で柔軟に対応します。 Trade Manager EAを使用すると、複雑な計算が過去のものになります。市場を分析し、エントリーポイント、ストップロス、テイクプロフィットのレベルをチャート上のラインでマークし、リスクを設定するだけで、Trade Managerが最適なポジションサイズを即座に計算し、SLとTPをピップ、ポイント、口座通貨でリアルタイムに表示します。すべての取引が簡単かつ効果的に管理されます。 主な機能: ポジションサイズ計算機 :定義されたリスクに基づいて取引サイズを瞬時に決定します。 簡単な取引計画 :エントリー、ストップロス、テイクプロフィットを設定するためのド
Copy Cat More Trade Copier MT4 (コピー猫MT4) は単なるローカル取引コピーツールではなく、現代の取引課題に対応するために設計された完全なリスク管理と実行フレームワークです。Propファームのチャレンジから個人の資産管理まで、強力な実行力、資金保護、柔軟な設定、高度な取引処理を組み合わせ、あらゆる状況に適応します。 このコピーツールは Master(送信側) と Slave(受信側) の両モードで動作し、成行注文や指値注文のリアルタイム同期、取引修正、部分決済、Close By 操作をサポートします。デモ口座・リアル口座の両方に対応し、取引用パスワードまたは投資家パスワードでも利用可能です。Persistent Trade Memory 技術により、EA・ターミナル・VPS が再起動しても復元可能です。複数の Master と Slave を同時に管理でき、ブローカー間の違いはプレフィックス/サフィックスの自動調整やシンボルマッピングで処理されます。 マニュアル/設定: Copy Cat Trading Copier マニュアル Copy Cat Mo
MT4 to Telegram Signal Provider は使いやすく、完全にカスタマイズ可能なツールで、Telegramに信号を送信し、あなたのアカウントを信号提供者に変えることができます。 メッセージのフォーマットは 完全にカスタマイズ可能です! しかし、簡単な使用のために、あらかじめ定義されたテンプレートを選択し、メッセージの特定の部分を有効または無効にすることもできます。 [ デモ ]   [ マニュアル ] [ MT5バージョン ] [ Discordバージョン ] [ Telegramチャンネル ]  New: [ Telegram To MT5 ] セットアップ ステップバイステップの ユーザーガイド が利用可能です。 Telegram APIの知識は必要ありません。開発者が必要なものをすべて提供します。 主要機能 購読者に送信される注文の詳細をカスタマイズする機能 例えばブロンズ、シルバー、ゴールドなど、階層型のサブスクリプションモデルを作成できます。ゴールドサブスクリプションでは、すべての信号が得られますなど。 ID、シンボル、またはコメントによる注文のフ
Tired of complex order placement and manual calculations? Trade Dashboard is your solution. With its user-friendly interface, placing orders becomes effortless, by a single click, you can open trades, set stop loss and take profit levels, manage trade lot size, and calculate risk to reward ratios, allowing you to only focus on your strategy. Say goodbye to manual calculations and streamline your trading experience with Trade Dashboard. Download  Demo Version  right now. You can find  Details of
TradePanel MT4
Alfiya Fazylova
4.85 (92)
Trade Panel は、多機能の取引アシスタントです。このアプリケーションには手動取引用の 50 を超える取引機能が含まれており、ほとんどの取引操作を自動化できます。 注意、アプリケーションはストラテジー テスターでは動作しません。購入する前に、デモアカウントでデモ版をテストできます。デモ版 ここ 。 完全な手順 こちら 。 取引。 ワンクリックで取引操作を実行できます: 自動リスク計算を使用して未決の注文とポジションをオープンします。 ワンクリックで複数の注文とポジションをオープンします。 注文グリッドを開きます。 未決の注文とポジションをグループごとにクローズします。 ポジション反転 (買いを閉じて売りを開く、または売りを閉じて買いを開く)。 ポジションをロックします(買いポジションと売りポジションの量を均等にする追加のポジションをオープンします)。 ワンクリックですべてのポジションを部分的にクローズします。 すべてのポジションのテイクプロフィットとストップロスを同じ価格レベルに設定します。 すべてのポジションのストップロスをポジションの損益分岐点レベルに設定します。 注文とポ
The product will copy all telegram signal to MT4   ( which you are member  ) , also it can work as remote copier.  Easy to set up, copy order instant, can work with almost signal formats, image signal, s upport to translate other language to English Work with all type of channel or group, even channel have "Restrict Saving Content", work with  multi channel, multi MT5 Work as remote copier: with signal have ticket number, it will copy exactly via ticket number. Support to backtest signal. How to
Smart Channel M4
Vahidreza Heidar Gholami
The trend in the market can be predicted using trend lines but the problem is you don’t know where exactly the price is going to touch the trend line where you can put your pending orders on. Smart Channel Expert Advisor makes it possible to put an advanced channel around the price data, which can be configured to handle placing orders, opening and closing positions, managing risk per trade, spread, slippage, and trailing stop-loss and take-profit automatically. Features Money Management (Calcul
VirtualTradePad mt4 Extra
Vladislav Andruschenko
4.86 (59)
ワンクリックで取引できるトレーディングパネル。ポジションと注文の操作!チャートまたはキーボードから取引。 手動取引用の取引パネル。チャート(チャートウィンドウ)またはキーボードから取引できます。開閉、リバース、ロックポジションと注文を処理する МetaТrader4のメインオーダーのトレーディングコントロールパネル:売買、売却、売却、売却、売却、閉じる、削除、修正、トレーリングストップ、ストップロス、takeproft MT5のバージョン 完全な説明   +DEMO +PDF 購入する方法 インストールする方法     ログファイルの取得方法     テストと最適化の方法     Expforex のすべての製品 シンボルウィンドウからの取引とキーボードからの取引! あなたはMetaTrader 4ターミナル - バーチャルコントロールパネルVirtualTradePadのためのユニークなプラグインを持っています。 Description on English 注意!  ストラテジーテスターの 取引方法を学びたい場合は、無料の TesterPad ユーティリティをチェックしてくだ
One tool to protect all your EAs — news filter, equity protection, time filter and more — free demo available Take a Break has evolved from a basic news filter into a comprehensive account protection solution. It pauses your other Expert Advisors during news events or based on custom filters. When trading resumes, it automatically restores your entire chart setup , including all EA settings. Typical use cases: One news filter for all your EAs. Pause trading during news or high volatility — and c
Exp Averager
Vladislav Andruschenko
4.82 (22)
Exp-Averager は、 平均化取引を開始することで、特定のドローダウンを受けた取引を平均化するように設計されています。 アドバイザーは、現在のトレンドに沿って、または逆に新しいポジションを開くことができます。 一連のポジションに適用されるスマート トレーリング ストップ機能も含まれています。 アドバイザはポジションのロットサイズを増減できます。 これは、損失ポジションを平均価格に近づけるために広く使用されている戦略です。 MT5のバージョン 完全な説明 +DEMO +PDF 購入する方法 インストールする方法     ログファイルの取得方法     テストと最適化の方法     Expforex のすべての製品 リンク TickSniper スキャルパー の平均化システムの例 平均化機能を備えたユニバーサル取引アドバイザー The X Expert Advisor は、チャートが関連付けられている通貨ペアで動作します。 たとえば、EURUSD の平均化を有効にするには、EURUSD チャートを開いて Expert Advisor を実行します。 注記 このシステムは
Comprehensive on chart trade panel with the unique ability to be controllable from mobile as well. Plus has a library of downloadable configuration, e.g. exit rules, extra panel buttons, pending order setup and more. Please see our product video. Works with all symbols not just currency pairs. Features On chart panel plus controllable from free app for Windows, iPhone and Android Built-in script engine with library of downloadable configuration, e.g. add 'Close All Trades in Profit' button, exit
Trading History - A program for trading and money management on the history of quotes in stratagy tester. It can work with pending and immediate orders, and is equipped with trailing stop, breakeven and take profit functions. Very good for training and testing different strategies. Manual (Be sure to read before purchasing) Advantages 1. Allows you to test any trading strategy in the shortest possible time 2. An excellent simulator for trading training. You can gain months of trading experience
Exp4 Duplicator
Vladislav Andruschenko
4.5 (22)
Expert Advisor は 、アカウントMetaTrader 4で 取引を繰り返し、ポジションを設定するか、事前に設定された回数だけシグナルを送信します。 手動または別のエキスパートアドバイザーによって開かれたすべての取引をコピーします。 シグナルをコピーし、シグナルからロットを増やします ! 他のEAの多くを増やします。 次の機能がサポートされています:コピーされた取引のカスタムロット、ストップロスのコピー、テイクプロフィット、トレーリングストップの使用。 MT5のバージョン 完全な説明 +DEMO +PDF 購入する方法 インストールする方法     ログファイルの取得方法     テストと最適化の方法     Expforex のすべての製品 リンク MetaTraderのトレードコピー機はこちらから入手できます:   COPYLOT 注意 注:これは、端末間の取引用のコピー機ではありません。 ストラテジーテスターでエキスパートアドバイザーをテストし、ビジュアルモードでEAPADPROツールバーと取引することができます! EAを1つの通貨ペアにインストールするだけで
Eezeorder 2
Tawanda Tinarwo
5 (2)
NEW VERSION!  NB: IF YOU ARE USING A VERY HIGH RESOLUTION MACHINE AND THE EA DISPLAY LOOKS TOO SMALL, CONTACT ME SO I CAN HELP YOU. Open Multiple Trades on MT4 in 1 click at one price. Enter the Lot size Specify the number of trades you want to open Choose whether you want TP SL or Trailing Stop Once you are done, click Buy or Sell Open Multiple Pending Orders on MT4 in 1 click at one price. Enter the Lot size Specify the gap from the current price, where you want to place the pending order Spe
--------------Welcome to use [MQL5 Signal Analyze Master]------------------  Function: Draw order tracks of MQL5 MT4 and MT5 signal on MT4 chart. [Using guide] 1.Use it as Experts. 2.Download history record from MQL5 signal(MT4 signal or MT5 signal).  3.Paste history record file below "MQL4/Files/" 4.Load [Signal Analyze Master] on the symbol chart what you want to analyze. 5.Paste the history record file name to parameter 'FileName' 6.Select  SignalType  match the history you download on MT4
News Filter EA that send you a Push notification to your MT4 phone APP and TURN OFF MT4 Automatically Before News.  This EA doesn't work in backtest From 1.7 version  the EA have  Close all trades before news functions added. You only need to allow that url in MT4 options: To see the url and how to add it to MT4, visit this post: https://www.mql5.com/en/blogs/post/754402 When Metatrader is turned off, it saves the status of all the charts, indicators and Expert Advisors that you have in them
RSI Divergence Scanner is a multi-timeframe and multi-symbol dashboard and alert that checks all timeframes and symbols to find divergences between price chart and RSI indicator. This divergence scanner is integrated with support and resistance zones so you can check the RSI divergences in the most important areas of the chart to find trend reversals in the price chart. Download demo version   (works on M 1,M5,M30,W1 timeframes) Full description of scanner parameters ->   click here . How to get
EA Hedger
Sergej Chukhista
4 (4)
トレーディングアドバイザーを購入したり、シグナルをサブスクライブしたり、手動でトレードしたりしましたか?!リスク管理を忘れないでください。 EA Hedger は、ヘッジを使用してリスクを管理できるようにする多くの設定を備えたプロのトレーディングユーティリティです。 ヘッジは、すでに開いているポジションとは反対のポジションを開くことを含む取引手法です。ヘッジの助けを借りて、ポジションを完全にまたは部分的にブロック(ロック)することができます。 この製品を購入することが有益なのはなぜですか。 信頼性 -アドバイザーは徹底的にチェックされ、テストされています 有用性 -Expert Advisorは実際の取引で使用され、その作業に効果的です パフォ ーマンス-ヘッジを使用した取引の結果は、ヘッジなしの取引の結果よりも大幅に優れています 可用性 -アドバイザーのコストは1か月あたりわずか4.91ドルまたは1日あたり0.17ドルです-これは1〜2スプレッドです サポート –ディスカッションでは、販売者に質問したり、アドバイスを受けたりすることができます 開発 -製品への希望を書くことができ、
Simple and Easy MT4 Trade Panel by Winidecorw I created this EA to make your life easier by making it easier and faster to open your trades. The price will increase progressively, take advantage now! Simplify Your Trading with the Simple and Easy MT4 Trade Panel Are you tired of wasting time setting up each trade in MetaTrader 4? With the simple and easy MT4 trading dashboard, taking your trading to the next level has never been so quick and easy! This Trade Assistant dashboard is the Simple an
MT4 to Discord Signal Provider は、Discord へ直接トレーディングシグナルを送信するために設計された、使いやすく完全にカスタマイズ可能なユーティリティです。このツールは、あなたのトレーディングアカウントを効率的なシグナルプロバイダーに変えます。 スタイルに合わせてメッセージフォーマットをカスタマイズ!利便性を考え、事前にデザインされたテンプレートから選択し、メッセージのどの要素を含めるか除外するかを選択できます。 [ デモ ] [ マニュアル ] [ MT5 バージョン ] [ Telegram バージョン ]  New: [ Telegram To MT5 ] セットアップ 簡単なセットアップのために、私たちの詳細な ユーザーガイド に従ってください。 Discord API の事前知識は必要ありません。必要なツールはすべて提供されます。 主な特徴 購読者の更新のための注文詳細をカスタマイズ。 ブロンズ、シルバー、ゴールドなど、各レベルで異なるシグナルアクセスを提供する階層的サブスクリプションモデルを実装。 注文が実行されたチャートのスクリーン
EASY Insight AIO – スマートで手間いらずな取引のオールインワンソリューション 概要 数秒で市場全体——FX、ゴールド、暗号資産、指数、さらには株式まで——を、手作業のチャート確認や複雑なセットアップ・インジケーター導入なしにスキャンできたらどうでしょうか? EASY Insight AIO はAIトレードのための究極のプラグ&プレイ型エクスポートツールです。市場全体のスナップショットを、クリーンなCSVファイルで一括出力。ChatGPT、Claude、Gemini、Perplexityなど、さまざまなAIプラットフォームで即座に解析できます。 ウィンドウの切り替えやグラフのごちゃごちゃしたオーバーレイはもう不要。自動エクスポートされる純粋で構造化されたインサイトだけで、無駄なチャート監視に悩まされず、スマートなデータ主導の判断に集中できます。 なぜEASY Insight AIOなのか? 本当のオールインワン • セットアップ不要、インジケーターのインストール不要、チャートへのオーバーレイ不要。インストールして起動し、エクスポートするだけです。 マルチアセット対
TelegramからMT4へ: 究極のシグナルコピーソリューション Telegram to MT4 は、DLLを必要とせず、TelegramのチャンネルやチャットからMetaTrader 4プラットフォームに取引シグナルを直接コピーできる最先端のユーティリティです。この堅牢なソリューションは、比類のない精度とカスタマイズオプションにより、シグナルのシームレスな実行を保証し、時間を節約し、効率性を向上させます。 [ Instructions and DEMO ] 主な特徴 直接的なTelegram API統合 電話番号とセキュアコードで認証します。 ユーザーフレンドリーな EXE ブリッジを使用して、チャット ID を簡単に取得および管理します。 複数のチャネル/チャットを追加、削除、更新して、同時に信号をコピーします。 高度なフィルターによる信号解析 カスタム例外語 (例: 「レポート」、「概要」) を含む不要な信号をスキップします。 柔軟な SL および TP 形式 (価格、ピップ、ポイント) をサポートします。 シグナルが価格ではなくポイントを指定する場合、エントリ ポイントを自動
THIS EA IS A SEMI-AUTO EA, IT NEEDS USER INPUT. Manual & Test Version Please TEST this product before   BUYING  and watch my video about it. Contact me for user support or bug reports, or if you want the MT5 version! MT5 Version I do not guarantee any profits or financial success using this EA. With this Expert Advisor, you can: Implement your own   Zone Recovery   strategy to capitalize on trending markets. Create   Grid   trading strategies, to profit from ranging markets. Place orders easil
Riskless Pyramid
Snapdragon Systems Ltd
5 (1)
Introduction This powerful MT4 trade mangement EA offers a way potentially to aggressively multiply trade profits in a riskfree manner. Once a trade has been entered with a defined stoploss and take profit target then the EA will add three pyramid add-on trades in order to increase the overall level of profit. The user sets the total combined profit target to be gained if everything works out. This can be specified either as a multiple of the original trade profit or as a total dollar amount. Fo
Seconds Chart — MetaTrader 4で秒足チャートを作成するユニークなツールです。 Seconds Chart を使用すると、秒単位のタイムフレームでチャートを構築でき、標準的な分足や時間足チャートでは得られない柔軟性と分析精度を実現します。例えば、 S15 は15秒足を表します。あらゆるインジケーター、エキスパートアドバイザー、スクリプトを利用可能で、標準的なチャートと同様に便利に操作できます。 標準的なツールとは異なり、 Seconds Chart は超短期のタイムフレームでも高い精度と遅延なく作業できるように設計されています。 Seconds Chartの利点 1秒から900秒 までのタイムフレームをサポート。 瞬時の読み込み MT5ターミナルからのティックデータベースのインポートにより、過去データを即時利用可能。 MT5ターミナルで「 Tick Database 」ユーティリティを最初に起動する必要があります。 リアルタイムでデータが更新され、 遅延やラグなし 。 複数の秒足チャートを同時に作成可能。 Seconds Chartが最適な用途 スキャルピング
これは視覚的な取引パネルであり、取引を簡単に配置および管理し、人為的エラーを回避し、取引活動を強化するのに役立ちます。使いやすい視覚的なインターフェースと、健全なリスクおよび位置管理アプローチを組み合わせています。 [ インストールガイド | 更新ガイド | トラブルシューティング | よくある質問 | すべての製品 ] 驚くほど使いやすい チャートから簡単に取引 正確なリスク管理との取引、手間のかからない 資本の保存が最優先事項です 気をつけずに利益を上げましょう できるだけ早くリスクのない取引をお楽しみください 開かれているすべての取引の自動トレーリングストップ 最初のストップロスは、取引が行われるとすぐに配置されます EAは、取引を行った後に次のタスクを実行します。 最初のストップロス/テイクプロフィットは自動的に配置されます できるだけ早くフリーライドにロックします(オプション) ストップロスを初めて損益分岐点に移動します(オプション) 停止するまで、希望の方法を使用してストップロスを追跡します その他のクールな機能は次のとおりです。 優れたターミナルアクティビティレポート
Trade Manager は、リスクを自動的に計算しながら、取引を迅速に開始および終了するのに役立ちます。 過剰取引、復讐取引、感情的な取引を防止する機能が含まれています。 取引は自動的に管理され、アカウントのパフォーマンス指標はグラフで視覚化できます。 これらの機能により、このパネルはすべてのマニュアル トレーダーにとって理想的なものとなり、MetaTrader 4 プラットフォームの強化に役立ちます。多言語サポート。 MT5バージョン  |  ユーザーガイド + デモ Trade Manager はストラテジー テスターでは機能しません。 デモについてはユーザーガイドをご覧ください。 危機管理 % または $ に基づくリスクの自動調整 固定ロットサイズを使用するか、ボリュームとピップに基づいた自動ロットサイズ計算を使用するオプション RR、Pips、または価格を使用した損益分岐点ストップロス設定 トレーリングストップロス設定 目標に達したときにすべての取引を自動的に終了するための 1 日あたりの最大損失 (%)。 過度のドローダウンからアカウントを保護し、オーバートレードを防ぎま
作者のその他のプロダクト
It is an analogue of the indicator of levels at https://www.mql5.com/en/market/product/24273 for the MetaTrader 5 platform. The indicator shows the levels of the past month, week and day. In addition, it draws a level in percentage relative to the difference between the High and Low of the past month and week. For the daily levels of the past day, the Close levels are additionally displayed. All you need to do is to configure the display parameters of the levels to your liking. In some cases, af
It is widely known that colors affect the emotional state of a human, especially if this human is a trader. Psychologists recommend that you follow your instincts and select the color of your environment that is most comfortable to you. In order to reduce emotional stress, impact of colors on a person should be considered. The optimal range of the most beneficial colors includes green, yellow-green and green-blue ones. This indicator allows you to manage your emotional state and health. Choose a
FREE
This is an interactive and easy-to-set indicator which allows to form seven equally spaced channels which have your settings simultaneously. All seven channels are enabled by default. But you can easily enable one or another channel using control buttons located in the upper case of the indicator's control panel. You can change a period of the indicator calculation by clicking one of buttons indicating number of the channel in the lower case of the control panel. Two other buttons (one of them i
This EA represents an interactive panel with adjustable parameters destined for installation and deletion of pending orders (orders grid generator). You can place the panel anywhere on the screen or hide it into a dot clicking on the button in the upper left part of the chart (it will be shown after clicking on it for the second time). Number and step of orders, lot size, vertical shift for limit orders - all these things make your work easier. There are functions for restoring according to pend
The purpose of the indicator is drawing an equidistant channel. It is somewhat different from the traditional model. The choice of control parameters is simple and does not require any special description. Enter the calculation interval in hours and the solution to the problem will appear on the screen. Please note that the time involved in calculation of the channel must be greater than the timeframe it will be displayed on. If the parameters you enter are beyond the allowable limits, you will
This indicator is designed for drawing equidistant channels. Two options are available: based on the number of hours in the indicator calculation and by the number of bars. To draw a channel, enter a number 1 or greater. The maximum value is limited by the amount of visible bars. If the parameters you enter are beyond the allowable limits, you will get notified if the indicator restrictions. Please note that the time involved in calculation of the channel must be greater than the timeframe it wi
This is a well-known ZigZag indicator. But it differs by the fact that its plot is based on values of the middle line which is set by a user. It can display Andrews’ Pitchfork and standard or Bobokus Fibo levels. NO REPAINTING. Parameters Period МА — middle line period. Default value is 34. Minimum value is 4. Maximum value is set at your discretion. Used to calculate price - base price to calculate the middle line. The averaging method - method of smoothing the middle line. Turning pitchfork —
The indicator displays the moving average of all periods on one chart. It shows the MA of a one step lower timeframe and all the MAs equal to and higher than it. Parameters Period moving average - Moving Average period (default is 34); Used to calculate price - price used for the MA calculation (default is the average price = (high+low)/2); The averaging method - default is linear-weighted; Moving average shift - MA shift (default is 0). Just enter the MA calculation period and its parameters,
Desk Analytical Table Portfolio Monitoring for Active Traders Overview: The Desk Analytical Table indicator is a professional tool designed for traders managing multiple financial instruments simultaneously. It consolidates key data on open positions, orders, and market statistics into a single window, ensuring seamless portfolio control even during high-intensity trading sessions. Key Features: ️ Multi-Instrument Analysis - Monitor up to 30 assets in real time with quick switching between inst
This is a prototype of the famous Control and management of transactions panel. There are two main differences: Allows to work with all the variety of financial instruments opened by a user and not only with instruments it was attached to; To activate levels of order closure hidden from a broker, it uses not lines but modifiable virtual levels. To enjoy the full functionality of the panel you are advised to have: Desk analytical table . Their combined operation allows to keep the situation under
The indicator is based on the two-buffer scheme and does not require any additional settings. It can be used on any financial instrument without any restrictions. The indicator is a known ZigZag, but it does not redraw . The indicator allows to easily detect significant levels on the price chart, as well as demonstrates the ability to determine the probable direction of a price movement. The calculations are based on the candles' Close prices, thus improving the reliability of the levels. Param
The idea of the indicator stems from the necessity to clearly define the borders of support and resistance levels, which helps to plan the opening and closing of positions in the areas that most appropriately determine the process. Look at the breakdowns of the resistance level that confirm the intention of the price to continue the upward movement, after it passed the support level and entered the channel formed by the two levels. The same is for the case when the price enters the channel downw
This indicator is a logical extension of the product at https://www.mql5.com/en/market/product/12526 . The only difference is that price movement is displayed using a histogram with levels, allowing to assess the direction and strength of the movement. How to interpret the signal: 0 - the middle of the channel; above 0.5 - the breakdown of the channel up; below -0.5 - the breakdown of the channel down. Both indicators are displayed in the attached screenshots. Install the indicator and you will
The indicator shows the levels of the past week and day. In addition, it draws a level in percentage. This level is specified relative to the difference between the High and Low of the past month and week. For the daily levels of the past day, the Close levels are additionally displayed. All you need to do is configure the display parameters of the levels to your liking. Parameters Over the past months installations - settings for the last months; PasteMonthsLines - the level display mode is on
This indicator is the logical continuation of the well-known equidistant channel indicator: https://www.mql5.com/en/market/product/8723 . The main purpose of the indicator is the visualization of price levels relative to the parallel channel using Fibo Bobokus levels in a separate window and the price history. This often allows forecasting the future price movement with a sufficiently high degree of probability. The Fibo levels calculation equation is as follows: FiboLevel = (50-(100*((Close[i]-
This simple to use utility allows opening charts from the list of financial instruments by left clicking their names. The chart window is opened using the Default template. The template name can be changed to one of those stored in Charts-Templates section of the terminal. It is possible to customize the background colors of panels and their labels, and also to select the display type for a more comfortable working environment. This is all you need to know in order to see the result quickly. Pa
If you need to quickly evaluate the results of trading on a current financial instrument by hypothetical price movement in the chosen direction and up to a certain level, set the indicator on any chart that contains open positions and move the line to the desired level after it appears together with the results tab. This is all you need to understand what happens to your deposit if the price is at this level without taking into account existing stop loss and take profit. Enable considering pendi
This is an individual tool for analyzing the market situation. It is very simple to use. After attaching the indicator to the chart, you will see three vertical lines named "VLine 1", "VLine 2" and "VLine 3", following in this order from left to right. For the utility to operate correctly, this sequence should always be observed. Please note: at the first start, the lines are not bound to specific price levels on the chart. This should be done by user in accordance with the following rule: if li
This indicator displays a set of moving average lines across all higher timeframes. The indicator can be installed on any financial instrument and any timeframe. For the analysis of the lines, a panel with timeframe values is provided in the lower right corner. Using the panel, you can easily enable/disable the display of the MA line of any higher timeframe. This allows a more thorough analysis of the market situation. The color of the button matches the color of the moving average line. Parame
This indicator is designed for monitoring RSI levels on the current and higher timeframes. The control panel is user friendly and consists of buttons, with which you can control the display of lines as per the names of the buttons. The button color matches the line color. Parameters "___| Settings of the main indicator " RSI Period - averaging period for index calculation (default is 14); RSI Price type - price used for calculations (default is the Close price); "___| Color palette " Text color
Этот индикатор предназначен для контроля уровней CCI на текущем и старших от него таймфреймах. Панель управления проста в понимании и состоит из кнопок, с помощью которых можно управлять отображением линий, соответствующим указанным на наименовании кнопок. Цвет кнопки совпадает с цветом линии. Этот индикатор из серии подобных индикаторов, которые уже успели завоевать популярность: https://www.mql5.com/ru/market/product/30276 и https://www.mql5.com/ru/market/product/30403 Параметры "___| Setti
This is a well-known ZigZag indicator. But it differs by the fact that its plot is based on values of the middle line which is set by a user. It can display Andrews’ Pitchfork and standard or Bobokus Fibo levels. NO REPAINTING. Parameters Period МА — middle line period. Default value is 34. Minimum value is 4. Maximum value is set at your discretion. Used to calculate price — type of price used for the midline calculations. The averaging method — type of smoothing for the middle line. Turning p
The indicator is similar to https://www.mql5.com/en/market/product/12330 . However, it considers the MQL5 platform features. Peaks and bottoms are calculated based solely on external bars. After a swing is formed, the indicator does not redraw providing opportunities for traders working on horizontal level breakthroughs. Traffic can be reduced by changing the amount of calculated bars in the MinBars variable (default value is 500). All you need is to select the output options, so that you can se
The indicator is based on the two-buffer scheme and does not require any additional settings. It can be used on any financial instrument without any restrictions. The indicator is a known ZigZag, but it does not redraw . The indicator allows to easily detect significant levels on the price chart, as well as demonstrates the ability to determine the probable direction of a price movement. The calculations are based on the candles' Close prices, thus improving the reliability of the levels. Param
フィルタ:
Marco
529
Marco 2019.07.10 01:54 
 

ユーザーは評価に対して何もコメントを残しませんでした

620500
21
620500 2015.11.27 11:21 
 

这信号怎么设置 刚开始测试的时候用的好好的 后来买了正版就不能运作了 求大神帮忙

レビューに返信