TimeFilter

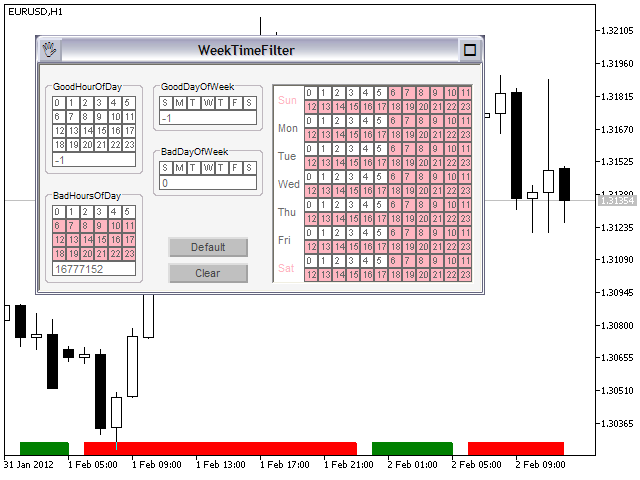
TimeFilter indicator allows to select visually bit masks (GoodHourOfDay, BadHoursOfDay, GoodDayOfWeek, BadDaysOfWeek), used in the Intraday Time Filter module of the Standard Library. The use of time filters allows to take into account the details of trade sessions.

Parameters:

GoodHourOfDay

Number of the only hour of day (from 0 to 23) when trade signals will be enabled. If the value is -1, the signals will be enabled through the whole day.

BadHoursOfDay

The bit field. Each bit of this field corresponds to an hour of day (0 bit - 0 hour, ..., 23 bit - 23-rd hour). If the value of a bit is equal to 0, trade signals will be enabled during the corresponding hour. If the value of a bit is equal to 1, trade signals will be disabled during the corresponding hour. A specified number is represented as a binary number and is used as bit mask.

Disabled hours have higher priority than the enabled ones.

GoodDayOfWeek

Number of the only day of week (from 0 to 6, where 0 is Sunday), when trade signals will be enabled. If the value is -1, the signals will be enabled on any day.

BadDaysOfWeek

The bit field. Each bit of this field corresponds to a day of week (0 bit - Sunday, ..., 6 bit - Saturday). If the value of a bit is equal to 0, trade signals will be enabled during the corresponding day. If the value of a bit is equal to 1, trade signals will be disabled during the corresponding day. A specified number is represented as a binary number and is used as bit mask.

Disabled days have higher priority than the enabled ones.


おすすめのプロダクト
Before installing the HeatMap indicator make sure you are using a broker that gives you access to the Depth of market (DOM) !! This indicator creates a heatmap on your chart allowing you to see the buy or sell limit orders easily and in real time. You have the possibility to change the setting and the colors of the HeatMap in order to adapt to all markets and all charts. Here is an example of a setting you can use with the NASDAQ100 on the AMPGlobal broker :  https://www.youtube.com/watch?v=x0Y
High Low Open Close
Alexandre Borela
4.98 (44)
このプロジェクトが好きなら、5つ星レビューを残してください。 このインジケータは、指定されたためのオープン、ハイ、ロー、クローズ価格を描画します 特定のタイムゾーンの期間と調整が可能です。 これらは、多くの機関や専門家によって見られた重要なレベルです トレーダーは、彼らがより多くのかもしれない場所を知るために有用であり、 アクティブ。 利用可能な期間は次のとおりです。 前の日。 前週。 前の月。 前の四半期。 前年。 または: 現在の日。 現在の週。 現在の月。 現在の四半期。 現年。
FREE
市場ボリュームプロファイル指標 + スマートオシレーター。通貨ペア、株式、先物、暗号資産など、ほぼすべての銘柄で動作し、リアルボリュームとティックボリュームの両方に対応しています。プロファイル作成範囲は、1週間や1ヶ月などの自動設定のほか、境界線(赤と青の2本の垂直線)を動かして手動で設定することも可能です。ヒストグラム形式で表示され、特定の価格レベルにおけるヒストグラムの幅は、その価格帯で行われた取引量(約定数)を表します。 Mode level line color パラメータを使用すると、価格が反発する可能性が高い重要なボリュームレベルを自動表示できます。また、 Maximum color パラメータは、指定した範囲全体で最も取引が集中した最大ボリュームレベルを個別に表示します。 スマートオシレーターは買われすぎ・売られすぎのゾーンを表示します。複数のインジケーターからの情報を分析し、処理されたデータに基づいて、買われすぎと売られすぎのゾーンを対応する色で塗りつぶします。 Volume every day では、 Range period パラメータでプロファイル作成の時間間隔を
The Mirror Chart MT5 is a overlay indicator specifically designed to project a second financial instrument directly onto the main chart window. This tool is invaluable for traders who rely on correlation analysis, as it visualizes the price movements of two different instruments in real time. Unlike traditional overlays, this indicator utilizes intelligent, dynamic centering and scaling logic. It continuously analyzes the visible price range in the current window for both symbols and calculates
FREE
概要 このインジケーターは、クラシックな ドンチャンチャネル を強化したバージョンで、実践的なトレード機能を追加しています。 標準の3本線(上限、下限、中央線)に加え、 ブレイクアウト を検出し、チャート上に矢印で視覚的に表示します。また、チャートを見やすくするために、 現在のトレンド方向と逆側のラインのみを表示 します。 インジケーターの機能: 視覚的シグナル :ブレイクアウト時にカラフルな矢印を表示 自動通知 :ポップアップ、プッシュ通知、Eメール RSIフィルター :市場の相対的な強弱に基づいてシグナルを検証 カスタマイズ可能 :色、ラインの太さ、矢印コード、RSI閾値など 動作原理 ドンチャンチャネルは次のように計算します: 上限線 :直近N本のクローズ済みローソク足の最高値 下限線 :直近N本のクローズ済みローソク足の最安値 中央線 :最高値と最安値の平均値 上方ブレイクアウト は終値が上限線を超えたときに発生し、 下方ブレイクアウト は終値が下限線を下回ったときに発生します。 インジケーターは以下を行います: 3本のドンチャンラインを描画 方向転換後の最初のブレイクアウト
FREE
Haven Volume Profileは、取引量の分布に基づいて重要な価格レベルを識別するための多機能なボリュームプロファイル分析インジケーターです。市場をより深く理解し、重要なエントリーポイントとエグジットポイントを特定したいプロのトレーダー向けに設計されています。 その他の製品 ->  こちら 主な機能: Point of Control (POC) 計算 - 最大の取引活動が行われるレベルで、最も流動性の高いレベルを特定するのに役立ちます Value Area(高い活動の領域)の定義とカスタマイズ可能な取引量の割合で、取引範囲をより正確に評価できます ティックボリュームと実際の取引量の両方に対応し、さまざまな市場タイプや取引戦略に対応しています 計算期間(日数)の柔軟な設定により、任意の時間枠にツールを適応させることができます ターミナルのライトテーマとダークテーマに自動的に適応し、ユーザーインターフェースの視覚的な体験を向上させます レベルの視覚化が明確で、スタイルや色をカスタマイズでき、グラフ分析と迅速な意思決定を支援します このインジケーターは、重要な価格レベルや統合ゾー
FREE
MarketPro toolkit
Johannes Hermanus Cilliers
Start earning profits by copying All trades are sent by our successful Forex trader & are extremely profitable. You can earn profits by copying trades daily Trial Period included You'll also get access to extremely powerful trading education which is designed in a simple way for you to become a profitable trader, even if you have no trading experience. https://ec137gsj1wp5tp7dbjkdkxfr4x.hop.clickbank.net/?cbpage=vip
FREE
The indicator highlights the points that a professional trader sees in ordinary indicators. VisualVol visually displays different volatility indicators on a single scale and a common align. Highlights the excess of volume indicators in color. At the same time, Tick and Real Volume, Actual range, ATR, candle size and return (open-close difference) can be displayed. Thanks to VisualVol, you will see the market periods and the right time for different trading operations. This version is intended f
FREE
Level Volume Pro
John Samfel Bucton Josol
HAT IT DOES   MONTHLY HIGH & LOW — AUTO-DRAWN EVERY MONTH Draws the High and Low of every month for the current year (or any year you set). Each level extends as a horizontal ray into the future so you always see where price is reacting to historical monthly extremes. Color-coded (blue = high, red = low), labeled (JAN HIGH, FEB LOW etc.), fully customizable width and style. Toggle individual months on or off.   WEEKLY HIGH & LOW
Statistical Arbitrage Spread Generator for Cointegration [MT5] What is Pair Trading? Pair trading is a market-neutral strategy that looks to exploit the relative price movement between two correlated assets — instead of betting on the direction of the market. The idea? When two assets that usually move together diverge beyond a statistically significant threshold, one is likely mispriced. You sell the expensive one, buy the cheap one , and profit when they converge again. It’s a statistica
FREE
SMC Venom Model BPR インジケーターは、スマート マネー (SMC) コンセプトで取引するトレーダー向けのプロフェッショナル ツールです。価格チャート上の 2 つの主要なパターンを自動的に識別します。 FVG   (フェアバリューギャップ) は、3 本のローソク足の組み合わせで、最初のローソク足と 3 番目のローソク足の間にギャップがあります。ボリュームサポートのないレベル間のゾーンを形成し、価格修正につながることがよくあります。 BPR   (バランス価格範囲) は、2 つの FVG パターンの組み合わせで、「ブリッジ」を形成します。これは、価格がボリュームアクティビティの少ない動きで動くときに、ブレイクアウトしてレベルに戻るゾーンで、ローソク足の間にギャップを作成します。 これらのパターンは、大規模な市場プレーヤーと一般参加者の相互作用が発生するチャート上のボリュームと価格動向の分析に基づいて、トレーダーが主要なサポート/レジスタンス レベル、ブレイクアウト ゾーン、エントリ ポイントを識別するのに役立ちます。 インジケーターは、長方形と矢印の形でパターンを視覚
Free automatic Fibonacci is an indicator that automatically plots a Fibonacci retracement based on the number of bars you select on the BarsToScan setting in the indicator. The Fibonacci is automatically updated in real time as new highest and lowest values appears amongst the selected bars. You can select which level values to be displayed in the indicator settings. You can also select the color of the levels thus enabling the trader to be able to attach the indicator several times with differe
FREE
CoPilot — デイリートレーディングダッシュボード 数字を把握し、明確にトレードする。 MT4バージョン CoPilotとは? CoPilotは プロフェッショナルグレード のトレーディングアシスタントで、毎日のパフォーマンス統計を リアルタイム でチャートに直接表示します—— ライブエクイティカーブ はトレードごとに更新されます。チャートを離れずにセッションを即座に把握したいアクティブトレーダー向けに設計されており、CoPilotは すべてのシンボルのその日のクローズド取引 を集計し、シンプルでカラーコード化されたインタラクティブパネルに表示します。 ターミナルの履歴タブに切り替える必要はもうありません。手計算も不要です。CoPilotはあなたの 副操縦士 として常に監視し、常に計算し、常に目の前に表示します。 リアルタイム統計パネル CoPilotは3つのセクションに整理された完全な日次パフォーマンス指標を表示します: アクティビティ — 本日の総取引数、クローズド取引、オープンポジション、勝敗数、 勝率 (%) 、ブレークイーブン取引。勝率の色は動的に変化:50%超で緑、5
The Penta-O is a 6-point retracement harmonacci pattern which usually precedes big market movements. Penta-O patterns can expand and repaint quite a bit. To make things easier this indicator implements a twist: it waits for a donchian breakout in the right direction before signaling the trade. The end result is an otherwise repainting indicator with a very reliable trading signal. The donchian breakout period is entered as an input. [ Installation Guide | Update Guide | Troubleshooting | FAQ | A
FREE
VFI Quantum
Nikita Berdnikov
5 (1)
Introducing VFI (Volume Flow Indicator) – a trading indicator that analyzes the relationship between volume and price movement to identify key trading opportunities. The indicator displays the strength and direction of volume flow, providing clear signals about potential entry and exit points. Signals are formed based on zero line crossovers, crossovers between the VFI line and its exponential moving average (EMA), and when the indicator exits overbought and oversold zones. Attention! This stra
FREE
Donchian Pro
Paulo Henrique Faquineli Garcia
4.75 (4)
The Donchian Channel Channels are among the most popular tools of technical analysis, as they visually convey to the analyst the limits within which most price movement tends to occur. Channel users know that valuable information can be obtained at any time, whether prices are in the central region of a band or close to one of the border lines. One of the best known techniques to explore these concepts is Bollinger Bands. However, John Bollinger was not the only one to research the application
FREE
VWAP_PC_MQL5 — a simple home-built VWAP indicator showing real-time volume-weighted price levels directly on your MT5 chart. TF: Works on all timeframes. Pair: Compatible with all symbols — Forex, indices, commodities, and stocks. Settings: Applied Price – price type used for VWAP calculation (Close, Typical, Weighted, etc.) Line Color / Width / Style – customize VWAP line appearance Session Reset – optional reset per day or continuous mode How it works (VWAP principle): VWAP (Volume Weighted
FREE
Follow The Line MT5
Oliver Gideon Amofa Appiah
4.6 (35)
This indicator obeys the popular maxim that: "THE TREND IS YOUR FRIEND" It paints a GREEN line for BUY and also paints a RED line for SELL. (you can change the colors). It gives alarms and alerts of all kinds. IT DOES NOT REPAINT and can be used for all currency pairs and timeframes. Yes, as easy and simple as that. Even a newbie can use it to make great and reliable trades. NB: For best results, get my other premium indicators for more powerful and reliable signals. Get them here: https://www.m
FREE
インディケータは現在のクオートを作成し、これを過去のものと比較して、これに基づいて価格変動予測を行います。インジケータには、目的の日付にすばやく移動するためのテキスト フィールドがあります。 オプション: シンボル - インジケーターが表示するシンボルの選択; SymbolPeriod - 指標がデータを取る期間の選択; IndicatorColor - インジケータの色; HorisontalShift - 指定されたバー数だけインディケータによって描画されたクオートのシフト; Inverse - true は引用符を逆にします。false - 元のビュー。 ChartVerticalShiftStep - チャートを垂直方向にシフトします (キーボードの上下矢印)。 次は日付を入力できるテキストフィールドの設定で、「Enter」を押すとすぐにジャンプできます。
MA Color Candles Indicator MA Color Candles is an indicator for visually displaying market trends by coloring chart candles. It does not add objects or distort price data, instead coloring real candles based on the state of two moving averages. This enables quick trend assessment and use as a filter in trading strategies. How It Works Bullish trend: Fast MA above slow MA, slow MA rising (green candles). Bearish trend: Fast MA below slow MA, slow MA falling (red candles). Neutral state: Candles
FREE
Was: $249  Now: $99   Market Profile defines a number of day types that can help the trader to determine market behaviour. A key feature is the Value Area, representing the range of price action where 70% of trading took place. Understanding the Value Area can give traders valuable insight into market direction and establish the higher odds trade. It is an excellent addition to any system you may be using. Inspired by Jim Dalton’s book “Mind Over Markets”, this indicator is designed to suit the
DF Fib Trader Pro DF Fib Trader Proは、MetaTrader 5向けに設計された自動取引システムです。 フィボナッチベースの価格水準とトレンドおよびストラクチャー分析を組み合わせ、エントリーポイントとエグジットポイントを決定します。このEAはロングポジションとショートポジションの両方をサポートし、リスク管理パラメータも組み込まれています。 主な機能: • フィボナッチ・リトレースメントとエクステンション・ロジックを用いて、エントリーポイント、SLポイント、TPポイントをプロットします。 • ロットサイズと損切り/利益確定レベルを設定可能 • エントリーポイントは1つまたは2つから選択可能 • 市場状況に応じて、固定または動的な損切り/利益確定をサポート • 複数の時間枠と通貨ペアに対応 • 最大スプレッド、スリッページ、取引頻度の制御オプションを搭載 • 自動取引管理:損益分岐点、トレーリングストップ、部分決済オプション • 希望に応じて成行注文もサポート入力項目の概要: • リスク管理:ロットサイズ、取引ごとのリスク、最大取引回数 • エントリー
FREE
Volume Weighted Average Price or VWAP is an indicator wich shows different average prices on chart. This is very useful to find strong negotiation price areas and as trend following. Configurations: Day, Week and Month - Show different VWAPs according to the period. You can change each line style on "colors" tab. Any doubt or suggestion please contact us. Enjoy! This is a free indicator, but it took hours to develop. If you want to pay me a coffee, I appreciate a lot   <3 PayPal, Skrill, Nete
FREE
FlatBreakout MT5 (Free Version) Flat Range Detector and Breakout Panel for MT5 — GBPUSD Only FlatBreakout MT5   is the free version of the professional FlatBreakoutPro MT5 indicator, specially designed for flat (range) detection and breakout signals on the   GBPUSD   pair only. Perfect for traders who want to experience the unique fractal logic of FlatBreakout MT5 and test breakout signals on a live market without limitations. Who Is This Product For? For traders who prefer to trade breakout of
FREE
Second Level Candles And Alligator Indicators 每12秒产生一个K线,而且自带Alligator指标,对超短线选手交易非常有帮助。程序启动时可能不成功,是因为MT5 MqlTick 数据加载少的原因。可以通过修改显示的数据参数避免,比如display=100,程序正常之后再将参数调大 display=300 。如果数据不正常,也可以采用重新加载的方式解决。 如果您对这个指标有任何建议,请联系作者。  Second Level Candles And Alligator Indicators  produced a candle per 12 seconds,include Alligator, it's helpful to Short-Term Trading。You'd better reload the indicator every start MT5 or change display parameter to reslove data bug. Please attach author when  you had some su
FREE
Value Chart Candlesticks
Flavio Javier Jarabeck
4.57 (14)
The idea of a Value Chart indicator was presented in the very good book I read back in 2020 , " Dynamic Trading Indicators: Winning with Value Charts and Price Action Profile ", from the authors Mark Helweg and David Stendahl. The idea is simple and the result is pure genius: Present candlestick Price analysis in a detrended way! HOW TO READ THIS INDICATOR Look for Overbought and Oversold levels. Of course, you will need to test the settings a lot to find the "correct" one for your approach. It
FREE
Price Magnet — Price Density and Attraction Levels Indicator Price Magnet is a professional analytical tool designed to identify key support and resistance levels based on statistical Price Density. The indicator analyzes a specified historical period and detects price levels where the market spent the most time. These zones act as “magnets,” attracting price action or forming a structural base for potential reversals. Unlike traditional Volume Profile tools, Price Magnet focuses on price-time d
(Special New Year promotion - free price!) The indicator displays the actual 'Scale in points per bar' (identical to the manual setting in the Terminal, see screenshot) in the upper right corner of the chart. The displayed value changes INSTANTLY whenever the chart scale is changed! (This is very convenient when planning screenshots). In Settings: Change language (Russian/English), font size of the displayed text, text label offset coefficient from the graph corner, equally in X and Y directi
FREE
Balance History Indicator The Balance History indicator visually tracks the entire trading history of your account for the selected timeframe. It plots three key performance metrics: Profit – Displayed in Green Loss – Displayed in Red Zero Profit/Break-even – Displayed in Gray Balance Curve – Displayed as a SkyBlue line This indicator helps you instantly see the distribution of profitable and losing periods over time, along with your running account balance. It's ideal for evaluating historic
FREE
MACD Colored ZeroLag
Farzin Sadeghi Bonjar
4.73 (11)
It is the MQL5 version of zero lag MACD that was available for MT4 here: https://www.mql5.com/en/code/9993 Also there was a colored version of it here but it had some problems: https://www.mql5.com/en/code/8703 I fixed the MT4 version which has 95 lines of code. It took me 5 days to write the MT5 version.(reading the logs and testing multiple times and finding out the difference of MT5 and MT4!) My first MQL5 version of this indicator had 400 lines of code but I optimized my own code again and n
FREE
このプロダクトを購入した人は以下も購入しています
Trade Assistant MT5
Evgeniy Kravchenko
4.42 (209)
取引 ごとのリスクの 計算、新規注文 の 簡単 な 設置、部分的 な 決済機能 を 持 つ 注文管理、 7 種類 のトレーリングストップなど 、便利 な 機能 を 備 えています 。 追加の資料と説明書 インストール手順   -   アプリケーションの手順   -   デモアカウント用アプリケーションの試用版 ライン機能 チャート上にオープニングライン、ストップロス、テイクプロフィットを表示します。この機能により、新規注文を簡単に設定することができ、注文を出す前にその特徴を確認することができます。   リスク計算 リスク計算機能は、設定されたリスクとストップロス注文のサイズを考慮して、新規注文のボリュームを計算します。ストップロスの大きさを自由に設定できると同時に、設定したリスクを守ることができます。 Lot calc ボタン - リスク 計算 を 有効 / 無効 にします 。 Risk フィールドでは 、必要 なリスクの 値 を 0 から 100 までのパーセンテージまたは 預金通貨 で 設定 します 。 設定」 タブで 、 リスク 計算 の 種類 を 選択 します :「 $ 通
Trade Manager EAへようこそ。これは、取引をより直感的、正確、そして効率的にするために設計された究極の リスク管理ツール です。これは単なるオーダー実行ツールではなく、包括的な取引計画、ポジション管理、リスク管理のためのソリューションです。初心者から上級者、迅速な実行を必要とするスキャルパーまで、Trade Manager EAはあらゆるニーズに対応し、為替、指数、商品、暗号通貨などさまざまな市場で柔軟に対応します。 Trade Manager EAを使用すると、複雑な計算が過去のものになります。市場を分析し、エントリーポイント、ストップロス、テイクプロフィットのレベルをチャート上のラインでマークし、リスクを設定するだけで、Trade Managerが最適なポジションサイズを即座に計算し、SLとTPをピップ、ポイント、口座通貨でリアルタイムに表示します。すべての取引が簡単かつ効果的に管理されます。 主な機能: ポジションサイズ計算機 :定義されたリスクに基づいて取引サイズを瞬時に決定します。 簡単な取引計画 :エントリー、ストップロス、テイクプロフィットを設定するためのド
Local Trade Copier EA MT5
Juvenille Emperor Limited
4.96 (136)
Local Trade Copier EA MT5 による、驚くほど高速な取引コピーを体験してください。1分で簡単にセットアップできるこの取引コピー機は、同じWindowsコンピュータまたはWindows VPS上の複数のMetaTrader端末間で取引をコピーすることができ、0.5秒未満の高速コピースピードを実現します。 初心者であろうとプロのトレーダーであろうと、 Local Trade Copier EA MT5 には、あなたの特定のニーズに合わせてカスタマイズするための幅広いオプションが用意されています。これは、利益の可能性を高めたい人にとって究極のソリューションです。 今すぐ試してみて、これが市場で最も速くて簡単なトレードコピー機である理由を理解してください。 ヒント: デモアカウントで Local Trade Copier EA MT5 デモバージョンをダウンロードして試すことができます: ここ ダウンロードした無料のデモ ファイルを MT5 >> ファイル >> データ フォルダを開く >> MQL5 >> Experts フォルダに貼り付けて、ターミナルを再起動しま
Farmed Hedge Yield Farming | All Markets (Manual - Hybrid - Semi/Automated EA) MULTI-ASSET SUPPORT Trade any asset available on your broker - Forex: Major, Minor, Exotic pairs - Crypto: BTC, ETH, XRP, SOL, BNB - Stocks: Apple, Tesla, Amazon, Google, etc. - Commodities: Gold, Silver, Oil, Gas - Indices: US30, NAS100, SPX500, DAX40 - Any CFD your broker offers VERIFIED TRADING RESULTS - Farmed Hedge Yield Axi Copy:  https://www.mql5.com/en/signals/2356376 - Farmed Hedge Yield Exn Copy:   https:/
ベータリリース Telegram to MT5 Signal Trader はまもなく正式なアルファ版をリリースします。いくつかの機能はまだ開発中で、小さな不具合に遭遇する可能性があります。問題が発生した場合はぜひご報告ください。皆さまのフィードバックがソフトウェア改善に役立ちます。 Telegram to MT5 Signal Trader は、 Telegram のチャンネルやグループからの取引シグナルを自動的に MetaTrader 5 にコピーする強力なツールです。 パブリックおよびプライベートの両方のチャネルに対応し、複数のシグナル提供元を複数のMT5口座に接続可能です。ソフトウェアは高速で安定し、すべての取引を細かく制御できます。 インターフェースは直感的で、ダッシュボードとチャートは見やすく設計されており、リアルタイムで動作状況をモニターできます。 必要環境 MQL の制限により、EA は Telegram と通信するためのデスクトップアプリが必要です。 インストーラーは公式の インストールガイド にあります。 主な機能 マルチプロバイダー: 複数の Telegram
TradePanel MT5
Alfiya Fazylova
4.87 (153)
Trade Panelは多機能なトレーディングアシスタントです。アプリには手動取引用の50以上のトレーディング機能が搭載されており、ほとんどの取引作業を自動化することができます。 注意!割引は2026年5月5日まで有効です。2026年5月6日から価格は100ドルになります。 購入前に、デモアカウントでアプリのデモ版をテストすることができます。デモアカウント用のアプリの試用版をダウンロードするには、次のリンクをご利用ください: https://www.mql5.com/en/blogs/post/750865 。 完全な手順 こちら 。 取引。 ワンクリックで取引操作を行うことができます: リスクを自動計算して指値注文やポジションを開く。 複数の注文やポジションをワンクリックで開く。 注文のグリッドを開く。 保留中の注文やポジションをグループごとに閉じる。 ポジションの方向を反転(Buyを閉じてSellを開く、またはSellを閉じてBuyを開く)。 ポジションをブロックする(不足している量のポジションを開くことでBuyとSellのポジション量を等しくする)。 すべてのポジションを部分的に
Power Candles Strategy Scanner - 自動最適化型マルチシンボル設定ファインダー パワーキャンドル・ストラテジー・スキャナーは 、パワーキャンドル・インジケーターを駆動するのと全く同じ自己最適化エンジンを、マーケットウォッチに登録されているすべての銘柄に対して並行して実行します。1つのパネルで、現在統計的に取引可能な銘柄、各銘柄で勝率の高い戦略、最適なストップロス/テイクプロフィットの組み合わせが表示され、新たなシグナルが発生した瞬間に通知が届きます。 このツールは、Stein Investmentsのエコシステムの一部です。  18種類以上のツールをすべて閲覧し、AIを活用したセットアップの推奨を受け取り、  https://stein.investments でコミュニティに参加しましょう 市場動向を網羅。銘柄ごとに3,000件以上の自動最適化。2種類のアラート。ワンクリックでチャートを切り替えて即座にアクション。 なぜこれが必要なのか 多くのマルチ銘柄スキャナーは、 価格の動き (ボラティリティ、変動率、銘柄ごとのRSI)を表示するだけです。それ
ABQ Visual Risk Sizer
Cristian David Castillo Arrieta
ABQ Visual Risk Sizer - Institutional Risk & Trade Execution カテゴリ:ユーティリティ / リスク管理 手動によるロット計算は、時間とコストの浪費につながります。 現代のトレーディング、特にプロップファーム(Prop Firms)の口座を運用する場合、ロット計算の誤りや注文入力のわずか5秒の遅れが、デイリードローダウンルールの違反や絶好のエントリーポイントを逃す原因となります。 ABQ Visual Risk Sizer は、この問題を根本的に解決するために設計された機関投資家レベルのツールです。複雑なリスクの数学的計算を、MetaTrader 5のチャート上で直接、直感的かつ迅速、そして100%正確な視覚的体験へと変貌させます。 外部のカレンダ計算機やExcelシートはもう必要ありません。チャート上のラインをドラッグするだけで、ワンクリックで取引を実行できます。 ABQ Visual Risk Sizer が必要な理由 プロップファームのための完全保護: 各取引で、設定した正確なリスク比率(または金額)を維持します。ゴールド
Trade Dashboard simplifies how you open, manage, and control your trades, with built-in lot size calculation. It allows you to execute trades, manage risk, and control positions directly on the chart, with tools such as partial close, breakeven, and trailing stop. Designed to reduce manual work and help you stay focused on your trading decisions. A demo version is available for testing. Detailed explanations of features are provided within the MQL5 platform. Installation instructions are include
Exp COPYLOT CLIENT for MT5
Vladislav Andruschenko
3.82 (34)
MetaTrader 5 用のプロフェッショナル取引コピー機 MetaTrader 向けの高速・高性能・信頼性の高い 取引コピー機 です。 COPYLOT は、MT4 と MT5 のターミナル間で Forex 取引をコピーでき、 Hedge 口座と Netting 口座の両方に対応しています。 COPYLOT MT5 版の対応構成: - MT5 Hedge → MT5 Hedge - MT5 Hedge → MT5 Netting - MT5 Netting → MT5 Hedge - MT5 Netting → MT5 Netting - MT4 → MT5 Hedge - MT4 → MT5 Netting MT4 版 完全な説明 + DEMO + PDF 購入方法 インストール方法 ログファイルの取得方法 テストと最適化の方法 Expforex のすべての製品 MT4 ターミナルへのコピーも可能です(MT4 → MT4、MT5 → MT4): COPYLOT CLIENT for MT4 COPYLOT は、2台、3台、さらには10台のターミナル間で同時に動作できる、プロフェッ
EA を買う前に、本当に耐えられるのか、それともバックテストでたまたま良く見えただけなのかを確認してください。 ほとんどのロボットは、見栄えのするバックテストと一緒に売られています。 右肩上がりのカーブ。 良い Profit Factor。 ほとんど疑いのない見た目。 それでも、その多くの EA は、市場がその履歴どおりに動かなくなった瞬間に崩れ始めます。 なぜでしょうか。 それは、バックテストが証明するのは一つだけだからです。 その戦略が、ある特定の価格の流れでは機能したということです。 別の流れでも通用することは証明しません。 頑健であることも証明しません。 もちろん、その EA があなたのお金に値することも証明しません。 なぜなら、あなたが EA を買うのは過去のきれいなカーブを眺めるためではないからです。 変化する市場で使うために買うのです。 AntiOverfit PRO がすること AntiOverfit PRO は、MetaTrader 5 の Expert Advisor が本当にしっかりしているのか、それとも特定の過去データにたまたまうまくはまっているだけなのかを確
Trade copier MT5
Alfiya Fazylova
4.59 (41)
Trade Copierは、取引口座間の取引をコピーして同期するように設計された専門的なユーティリティです。 コピーは、同じコンピューターまたはvps にインストールされている、サプライヤーのアカウント/端末から受信者のアカウント/端末に行われます。 キャンペーン - すでに「Trade copier MT5」をご購入の方は、「Trade copier MT4」を無料で入手できます(MT4 → MT5 および MT4 ← MT5 のコピー用)。詳細な条件については、どうぞ個別メッセージでお問い合わせください。 購入する前に、デモ アカウントでデモ バージョンをテストできます。 デモ版 こちら 。 詳細な説明は こちら 。 主な機能と利点: MT5ネッティングアカウントを含む、MT5> MT5、MT4> MT5、MT5> MT4のコピーをサポートします。 高いコピー速度(0.5秒未満)。 ベンダーモードと受信者モードは同じ製品内に実装されています。 チャートから直接リアルタイムでコピーを制御できる、簡単で直感的なインターフェイス。 接続が切断されたり、端末が再起動されたりしても、設定と位
Footprint Chart Pro — Professional OrderFlow EA for MetaTrader 5 Version 6.34 | Professional tool for real traders | Institutional-Grade Visualization DEMO USERS - PLEASE SELECT EVERY TICK / REAL TICK WHEN TESTING AND YOU HAVE DOWNLOADED HISTORICAL DATA. IF YOU SEE A WAITING SCREEN AND IT IS NOT DOWNLOADING, IT MEANS YOU HAVE LOW HISTORICAL DATA. TRY 1 MIN AND 5 MIN FIRST ON 1 DAY DATA. ONE DAY DATA SHOULD BE THE NEWEST AND MOST CURRENT DATE. PLEASE WAIT UNTIL THE MARKET HAS ROLLED OVER PERIOD.
Timeless Charts
Samuel Manoel De Souza
5 (4)
Timeless Charts is an advanced charting solution designed for professional traders seeking for custom charts / custom timeframes , including seconds charts / seconds timeframe, renko charts / renko bars, cluster charts / footprint charts and advanced tools present in most of the popular platforms. Unlike traditional offline charts or simplistic custom indicators, this solution constructs fully custom bars with true timestamp accuracy , down to miliseconds, allowing for a powerful and precise tr
Copy Cat More Trade Copier MT5 (コピーキャット MT5) は、今日の取引課題に対応して設計されたローカルトレードコピーシステムと完全なリスク管理・実行フレームワークです。プロップファームのチャレンジから個人ポートフォリオ管理まで、堅牢な実行、資本保護、柔軟な設定、高度な取引処理の組み合わせで、あらゆる状況に適応します。 コピーシステムはマスター(送信側)とスレーブ(受信側)の両方のモードで動作し、成行注文と指値注文、取引修正、部分決済、両建て決済操作のリアルタイム同期を行います。デモ口座とライブ口座、取引ログインまたは投資家ログインの両方に対応し、EA、ターミナル、またはVPSが再起動してもパーシスタント取引メモリシステムを通じて復旧を保証します。複数のマスターとスレーブをユニークIDで同時に管理でき、ブローカー間の違いはプレフィックス/サフィックス調整またはカスタムシンボルマッピングを通じて自動的に処理されます。 マニュアル/設定  | Copy Cat More MT4 | チャンネル  特別機能: 設定が簡単 — わずか30秒で完了(ビデオをご覧
MT5 to Telegram Signal Provider は、Telegramのチャット、チャンネル、またはグループに 指定された シグナルを送信することができる、完全にカスタマイズ可能な簡単なユーティリティです。これにより、あなたのアカウントは シグナルプロバイダー になります。 競合する製品とは異なり、DLLのインポートは使用していません。 [ デモ ] [ マニュアル ] [ MT4版 ] [ Discord版 ] [ Telegramチャンネル ]  New: [ Telegram To MT5 ] セットアップ ステップバイステップの ユーザーガイド が利用可能です。 Telegram APIの知識は必要ありません。必要な全ては開発者から提供されます。 主な特長 購読者に送信する注文の詳細をカスタマイズする機能 例えば、Bronze、Silver、Goldといった階層型のサブスクリプションモデルを作成できます。Goldサブスクリプションでは、すべてのシグナルが提供されます。 id、シンボル、またはコメントによって注文をフィルターできます 注文が実行されたチャート
Seconds Chart - MetaTrader 5で秒足チャートを作成するユニークなツールです。 Seconds Chart を使用すると、秒単位のタイムフレームでチャートを構築でき、標準的な分足や時間足チャートでは得られない柔軟性と分析精度を実現します。例えば、 S15 は15秒足を表します。カスタムシンボルをサポートしているインジケーターやEAをすべて使用できます。標準的なチャートと同様に便利に操作できます。 標準的なツールとは異なり、 Seconds Chart は超短期のタイムフレームでも高い精度と遅延なく作業できるように設計されています。 Seconds Chartの利点 1秒から900秒 までのタイムフレームをサポート。 組み込みのティックデータベースにより、ヒストリカルデータを 瞬時にロード 。 リアルタイムでデータが更新され、 遅延やラグなし 。 複数の秒足チャートを同時に作成可能。 Seconds Chartが最適な用途 スキャルピング や高頻度取引。 正確なエントリーとエグジット。 短期タイムフレームでの取引戦略のテスト。 タイムフレームの設定 デフォルトの設
MetaTrader 5 用トレーディングパネル — チャートとキーボードから行うプロフェッショナルなワンクリック取引 アクティブトレーダーのために設計された高機能 Trading Panel。標準の MetaTrader 操作よりも、はるかに速く、直感的に、そして効率的に取引を実行できます。 本パネルは、ポジション管理、未決注文管理、利益コントロール、執行スピードをひとつのプロフェッショナルなワークスペースに集約した実践的なソリューションです。 これは単なる補助ツールではありません。MetaTrader 5 のための本格的な trading cockpit です。チャートから直接操作し、キーボードで素早くコマンドを実行し、自動計算や視覚的なガイドを活用することで、手動トレードをより速く、より明確に、より快適にします。 このパネルを使えば、チャート上からワンクリックで注文を実行でき、標準の MetaTrader コントロールと比べて最大 30 倍速く取引操作を行うことができます。 MT4 バージョン | 完全説明 + DEMO + PDF | 購入方法 | インストール方法 | ログ
HINN MAGIC ENTRY – the ultimate tool for entry and position management! Place orders by selecting a level directly on the chart! full description   ::  demo-version  :: 60-sec-video-description Key features: - Market, limit, and pending orders - Automatic lot size calculation - Automatic spread and commission accounting - Unlimited partitial take-profits  - Breakeven and trailing stop-loss and take-profit  functions - Invalidation leves - Intuitive, adaptive, and customizable interface - Works
Custom Alerts AIO:マルチマーケット監視を一括で実現 — 設定不要ですぐに使えるインテリジェントツール 概要 Custom Alerts AIO は、追加のインジケーター設定が不要で、インストール後すぐに利用できる高機能マーケットスキャナーです。FX Power、FX Volume、FX Dynamic、FX Levels、IX Power を内部にすべて統合し、主要なすべての資産クラス(為替、金属、指数、暗号資産)を一括監視できます。MetaTrader の仕様により、株式は個別のシンボルとして追加可能ですが、一般的には利用頻度は低めです。 1. なぜ Custom Alerts AIO を選ぶべきか 追加ライセンス不要 • 必要なすべての Stein Investments インジケーターが内蔵されており、すぐに使用可能です。 • チャートに表示されるグラフィックは省略されており、アラート生成に特化した構成です。 市場を広範囲にカバー • 為替、金属、暗号資産、株価指数に対応(株式は手動追加可能)。 • シンボル名を入力する必要はなく、プロパティで資産クラス
Cerberus Equity Watcher
Samuel Bandi Roccatello
5 (3)
Cerberus the Equity Watcher はリスク管理ツールであり、アカウントの資産を常に監視し、不完全な EA や裁量的なトレーダーの場合は感情的な行動によって引き起こされる大きなドローダウンを回避します。これは、バグを含む可能性のある EA や、予想外の市況でうまく機能しない可能性のある EA に依存するシステマティック トレーダーにとって非常に役立ちます。 Cerberus では、最小エクイティ値と (オプションで) 最大値を設定できます。これらのいずれかに達すると、すべてのポジションがフラットになり、すべての未決注文がクローズされ、すべての EA が「強制終了」されます。すべての位置を平坦化すると、ユーザーの携帯電話に通知が送信され、画面に明確なメッセージが表示されます。 「平坦化」の後、Cerberus は株式価値を監視し続け、再初期化されるまでそれ以上の取引の試みを停止し続けます。 Cerberus によって実行されるすべての操作は、画面に明確に表示され、Expert advisor タブに報告され、通知がユーザーに送信されます。ユーザーのミスを避けるために、
あなたがメンバーである任意のチャネルから(プライベートおよび制限されたものを含む)シグナルを直接あなたのMT5にコピーします。  このツールは、トレードを管理し監視するために必要な多くの機能を提供しながら、ユーザーを考慮して設計されています。 この製品は使いやすく、視覚的に魅力的なグラフィカルインターフェースで提供されています。設定をカスタマイズして、数分で製品を使用を開始できます! ユーザーガイド + デモ  | MT4版 | Discord版 デモを試してみたい場合は、ユーザーガイドにアクセスしてください。 Telegram To MT5 受信機は、ストラテジーテスターで動作しません! Telegram To MT5の特徴 複数のチャネルから一度にシグナルをコピー プライベートおよび制限されたチャネルからシグナルをコピー BotトークンまたはChat IDは必要ありません   (必要に応じて使用することができます) リスク%または固定ロットを使用して取引 特定のシンボルを除外 すべてのシグナルをコピーするか、コピーするシグナルをカスタマイズするかを選択 すべてのシグナルを認
Ultimate Extractor - Professional Trading Analytics for MT5 *****this is the local HTML version of Ultimate Extractor. !!!!!it is not compatible with Cloud!!!! For the online version please reach out to me directly****** Ultimate Extractor transforms your MetaTrader 5 trading history into actionable insights with comprehensive analytics, interactive charts, and real-time performance tracking. What It Does Automatically analyzes your MT5 trading history across all Expert Advisors and generates
The core idea: using the user interface, you configure the parameters the chart must meet before entering a position (or positions), choose which entry models to use, and set the rules for when trading and planning should end. Lazy Trader  handles the rest: it  takes over all the routine chart watching and execution! full description  :: 3 key videos [1] ->  [2]   ->  [3] What can it do? - Understands Larry Williams market structure - Understands swing market structure by Michael Huddleston
The product will copy all telegram signal to MT5 ( which you are member) , also it can work as remote copier.  Easy to set up, copy order instant, can work with almost signal formats, image signal,  s upport to translate other language to English Work with all type of channel or group, even channel have "Restrict Saving Content", work with  multi channel, multi MT5 Work as remote copier: with signal have ticket number, it will copy exactly via ticket number. Support to backtest signal. How to s
TelegramからMT5へ: 究極のシグナルコピーソリューション Telegram to MT5 を使えば、取引がシンプルになります。DLL を必要とせず、Telegram のチャンネルやチャットから MetaTrader 5 プラットフォームに取引シグナルを直接コピーできる最新ツールです。この強力なソリューションは、正確なシグナル実行、豊富なカスタマイズオプション、時間の節約、そして効率性の向上を実現します。 [ Instructions and DEMO ] 主な特徴 直接的なTelegram API統合 電話番号とセキュアコードで認証します。 ユーザーフレンドリーな EXE ブリッジを通じてチャット ID を簡単に管理できます。 複数のチャネル/チャットを追加、削除、更新して、同時に信号をコピーします。 高度なフィルターによる信号解析 例外的な単語 (例: 「レポート」、「結果」) を含む不要な信号をスキップします。 柔軟な SL および TP 形式 (価格、ピップ、ポイント) をサポートします。 価格ではなくポイントを指定するシグナルのエントリ ポイントを自動的に計算します。
Anchor: The EA Manager Run your full EA portfolio without conflicts, without stacked risk, and without watching every chart yourself. Anchor coordinates up to 64 Expert Advisors on a single account so only one trades at a time. Attach Anchor to any chart. Type your EA names and magic numbers in one line. Anchor handles the rest. Built for portfolios. Built for discipline. Built for prop firms. The Problem Running multiple EAs on the same account creates risk. Two gold EAs can open opposite posit
This is exactly what the name says. Visual strategy builder . One of a kind. Turn your trading strategies and ideas into Expert Advisors without writing single line of code. Generate mql source code files with a few clicks and get your fully functional Expert Advisors, which are ready for live execution, strategy tester and cloud optimization. There are very few options for those who have no programming skills and can not create their trading solutions in the MQL language. Now, with Bots Builde
Trade Manager DashPlus
Henry Lyubomir Wallace
5 (13)
DashPlus は、MetaTrader 5プラットフォーム上での取引効率と効果を向上させるために設計された高度なトレード管理ツールです。リスク計算、注文管理、高度なグリッドシステム、チャートベースのツール、パフォーマンス分析など、包括的な機能を提供します。 主な機能 1. リカバリーグリッド 逆境の市場環境下で取引を管理するための平均化および柔軟なグリッドシステムを実装します。 取引回復のための戦略的なエントリーおよびエグジットポイントを可能にします。 2. スタックグリッド 強い市場の動きの中でポジションを追加することで、有利な取引での潜在的なリターンを最大化するように設計されています。 トレンド市場で利益を得られるよう、勝ち取引を拡大します。 3. 損益(P&L)ライン チャート上に直接、潜在的な利益と損失のシナリオを視覚的に表示します。 設定を調整し、P&Lラインをドラッグして、実行前にさまざまな取引結果を評価します。 4. バスケットモード 同じシンボルでの複数ポジションの管理を簡素化し、それらを単一の集約ポジションにまとめます。 平均価格に基づいて、ストップロスやテイクプ
FUTURES ORDERFLOW FOOTPRINT CHART Professional OrderFlow EA for MetaTrader 5 Version 1.01| Professional tool for real traders | Institutional-Grade Visualization STRATEGY TESTER USERS - PLEASE SELECT EVERY REAL TICK WHEN TESTING AND YOU HAVE DOWNLOADED HISTORICAL DATA. IF YOU SEE A WAITING SCREEN AND IT IS NOT DOWNLOADING, IT MEANS YOU HAVE LOW HISTORICAL DATA. TRY 1 MIN AND 5 MIN FIRST ON 1 DAY DATA. ONE DAY DATA SHOULD BE THE NEWEST AND MOST CURRENT DATE. PLEASE WAIT UNTIL THE MARKET HAS ROL
作者のその他のプロダクト
This utility is used to visually choose an indicator for trailing stop and select its parameters. The Expert Advisor modifies the Stop Loss order position opened for the instrument of the current chart based on indicator values. Uses indicators Parabolic SAR , NRTR (Nick Rypock Trailing Reverse) , Moving Average or linear regression channel. The indicators are added to or removed from the chart using the 'show' checkbox. The following options are available: Parabolic - trailing stop based on th
The indicator is an inter-week hourly filter. When executing trading operations, the indicator allows considering time features of each trading session. Permissive and restrictive filter intervals are set in string form. The used format is [first day]-[last day]:[first hour]-[last hour]. See the screenshots for examples. Parameters: Good Time for trade - intervals when trading is allowed. Bad Time for trade - intervals when trading is forbidden. time filter shift (hours) - hourly shift. percenta
TrailingStop 4
Andrej Nikitin
4.83 (6)
The Expert Advisor modifies the Stop Loss order position opened for the instrument of the current chart based on indicator values. Uses indicators Parabolic SAR ,  NRTR (Nick Rypock Trailing Reverse) ,  Moving Average  or linear regression channel. Switchable modes: Trailing stop only when in profit; Trailing stop only following the price; On every teak or on formed bars; Trailing for each order separately or for a total position. Has an option of "hidden stop", also you can exclude individual
Ticks Bars
Andrej Nikitin
4 (2)
This tick indicator draws synthetic bars/candlesticks that contain a definite number of ticks. Parameters: option prices - price option. It can be Bid, Ask or (Ask+Bid)/2. the number of ticks to identify Bar - number of ticks that form OHLC. price levels count - number of displayed price levels (no levels are displayed if set to 0 or a lower value). calculated bar  - number of bars on the chart. Buffer indexes: 0 - OPEN, 1 - HIGH, 2 - LOW, 3 - CLOSE.
FREE
Tick
Andrej Nikitin
4.5 (2)
A simple tick indicator of Bid and Ask prices. The period separator (1 minute) is displayed as a histogram. Parameters Price_levels_count - number of price levels to be displayed. Bar_under_calculation - number of bars of the indicator to be displayed on the chart.
FREE
Ticks
Andrej Nikitin
3 (1)
A simple tick indicator of Bid and Ask prices. The period separator (1 minute) is displayed as a histogram. Parameters Show Bid Line - show/hide the Bid line; Show Ask Line - show/hide the Ask line; Show Labels - show/hide the last price values.
FREE
The indicator draws two simple moving averages using High and Low prices. The MA_High line is displayed when the moving average is directed downwards. It can be used for setting a stop order for a sell position. The MA_Low line is displayed when the moving average is directed upwards. It can be used for setting a stop order for a buy position. The indicator is used in the TrailingStop Expert Advisor. Parameters Period - period of calculation of the moving average. Deviation - rate of convergence
FREE
The Relative Strength Index indicator drawn using a tick chart. After launching it, wait for enough ticks to come. Parameters: RSI Period - period of averaging. overbuying level - overbought level. overselling level - oversold level. calculated bar - number of bars on the chart for the indicator calculation. The following parameters are intended for adjusting the weight of RSI signals (from 0 to 100). You can find their description in the Signals of the Oscillator Relative Strength Index section
The Envelopes indicator drawn using a tick chart. After launching it, wait for enough ticks to come. Parameters: Averaging period - period of averaging. Smoothing type - type of smoothing. Can have any values of the enumeration ENUM_MA_METHOD . Option prices - price to be used. Can be Ask, Bid or (Ask+Bid)/2. Deviation of boundaries from the midline (in percents) - deviation from the main line in percentage terms. Price levels count - number of displayed price levels (no levels are displayed if
The Stochastic Oscillator indicator is drawn on the tick price chart. After launching it, wait for enough ticks to come. Parameters: K period - number of single periods used for calculation of the stochastic oscillator; D period - number of single periods used for calculation of the %K Moving Average line; Slowing - period of slowing %K; Calculated bar - number of bars in the chart for calculation of the indicator. The following parameters are intended for adjusting the weight of signals of the
The Moving Average Convergence/Divergence(MACD) indicator drawn using a tick chart. After launching it, wait for enough ticks to come. Parameters: Fast EMA period - indicator drawn using a tick chart. Slow EMA period - slow period of averaging. Signal SMA period - period of averaging of the signal line. calculated bar - number of bars on the chart for the indicator calculation. The following parameters are intended for adjusting the weight of MACD signals (from 0 to 100). You can find their desc
The Bollinger Bands indicator drawn using a tick chart. After launching it, wait for enough ticks to come. Parameters: Period - period of averaging. Deviation - deviation from the main line. Price levels count - number of displayed price levels (no levels are displayed if set to 0). Bar under calculation - number of bars on the chart for the indicator calculation. Buffer indexes: 0 - BASE_LINE, 1 - UPPER_BAND, 2 - LOWER_BAND, 3 - BID, 4 - ASK.
The Moving Average of Oscillator(OsMA) indicator drawn using a tick chart. After launching it, wait for enough ticks to come. Parameters: Fast EMA period - fast period of averaging. Slow EMA period - slow period of averaging. Signal SMA period - period of averaging of the signal line. calculated bar - number of bars for the indicator calculation.
The Commodity Channel Index(CCI) indicator drawn using a tick chart. After launching it, wait for enough ticks to come. Parameters: period - number of single periods used for the indicator calculation. calculated bar - number of bars for the indicator calculation. The following parameters are intended for adjusting the weight of CCI signals (from 0 to 100). You can find their description in the Signals of the Commodity Channel Index section of MQL5 Reference. The oscillator has required directio
The Average Directional Movement Index indicator drawn using a tick chart. After launching it, wait for enough ticks to come. Parameters: Period - period of averaging. Сalculated bar - number of bars on the chart for the indicator calculation. Buffer indexes: 0 - MAIN_LINE, 1 - PLUSDI_LINE, 2 - MINUSDI_LINE.
The Standard Deviation (StdDev) indicator drawn using a tick chart. After launching it, wait for enough ticks to come. Parameters: Period - period of averaging. Method - method of averaging. calculated bar - number of bars for the indicator calculation.
The Momentum indicator drawn using a tick chart. After launching it, wait for enough ticks to come. Parameters: period - period of the indicator calculation. levels count - number of displayed levels (no levels are displayed if set to 0) calculated bar - number of bars for the indicator calculation.
The Bulls Power indicator drawn using a tick chart. After launching it, wait for enough ticks to come. Parameters: Period - period of averaging. The number of ticks to identify high/low - number of single ticks for determining high/low. Calculated bar - number of bars for the indicator calculation. The following parameters are intended for adjusting the weight of Bulls Power signals (from 0 to 100). You can find their description in the Signals of the Bulls Power oscillator section of MQL5 Refer
The  Bears Power indicator drawn using a tick chart. After launching it, wait for enough ticks to come. Parameters: Period - period of averaging. The number of ticks to identify high/low - number of single ticks for determining high/low. Calculated bar - number of bars for the indicator calculation. The following parameters are intended for adjusting the weight of Bears Power signals (from 0 to 100). You can find their description in the Signals of the Bears Power oscillator section of MQL5 Refe
The  Average True Range (ATR)  indicator drawn using a tick chart. After launching it, wait for enough ticks to come. Parameters: ATR Period  - number of single periods used for the indicator calculation. The number of ticks to identify Bar  - number of single ticks that form OHLC. Price levels count  - number of displayed price levels (no levels are displayed if set to 0 or a lower value). price mode  - choice of prices under calculation (can be bid, ask or average). Сalculated bar  - number of
The  Williams' Percent Range (%R)  indicator drawn using a tick chart. After launching it, wait for enough ticks to come. Parameters: WPR Period  - period of the indicator. Overbuying level  - overbought level. Overselling level  - oversold level. price mode  - choice of prices under calculation (can be bid, ask or average). Сalculated bar  - number of bars for the indicator calculation. The following parameters are intended for adjusting the weight of WPR signals (from 0 to 100). You can find t
The  Price Channel  indicator drawn using a tick chart. After launching it, wait for enough ticks to come. Parameters: Period  - period for determining the channel boundaries. Price levels count  - number of displayed price levels (no levels are displayed if set to 0). price mode  - choice of prices under calculation (can be bid, ask or average). Bar under calculation  - number of bars on the chart for the indicator calculation. Buffer indexes: 0 - Channel upper, 1 - Channel lower, 2 - Channel m
Description: Abigail is a medium-term trading system making profit during the price rollback. The Expert Advisor has been optimized for working on EURUSD. However, it can successfully work with other currency pairs as well. You can examine the Expert Advisor's trading statistics for different brokers and symbols at MetaTrader 4 and MetaTrader 5 Trading Signals sections. Parameters: Risk management: enter volume - market entry volume. If the value is greater than 0 - number of lots, if less than
TimeFilter indicator allows you to visually select bit masks (GoodHourOfDay, BadHoursOfDay, GoodDayOfWeek, BadDaysOfWeek) for the  Intraday Time Filter  module of trading signals of the Standard Library. The use of time filters allows you to take into account the particulars of each trading session in performing trading operations.
The indicator is an inter-week hourly filter. When executing trading operations, the indicator allows considering time features of each trading session. Permissive and restrictive filter intervals are set in string form. The used format is [first day]-[last day]:[first hour]-[last hour]. See the screenshots for examples. Parameters: Good Time for trade - intervals when trading is allowed. Bad Time for trade - intervals when trading is forbidden. time filter shift (hours) - hourly shift. percenta
The script creates account summary report in a separate window. The report can be created for all deals and for deals on selected financial instruments. It is possible to specify a time interval of calculation and save report to an htm file. Script inputs report starting date - initial report generation date. symbols selection for report - select a method of choosing tools for a report generation. allSymbol - report is generated for deals performed on all symbols. onlyCurrentSymbol - report is
The EA performs trade operations of closing position groups. Positions are grouped by type. It is possible to select orders by the profit (loss) value. It is possible to form the closure groups manually. You can set a value for automatic closure of a positions group after reaching a certain profit/loss level or price level. The additional functions of the EA are called using the hot keys: SHIFT+A - show/hide Auto exit options. SHIFT+S - show/hide Settings panel. SHIFT+V - sound ON/OFF. SHIFT+I -
The Expert Advisor for increasing (or opening) market positions. Allows specifying the desired risk, target and searching for the best open price and trade volume. Configurable Parameters: lots - directly the volume of the position increase. % equity - the amount of growth as a percentage of the amount of funds. stop loss - directly the level of the stop loss order. loss - the level of the stop loss order depending on the allowable loss. take profit - directly the take profit level of the o
The Expert Advisor notifies that a price has crossed a line on the chart. It handles two types of lines - horizontal line and a trendline. The number of lines is unlimited. Parameters: prefix of signal line - prefix of object (line) names processed by the indicator. If the parameter is empty, it handles all object types: horizontal lines and trendlines. price Mode - price type (bid or ask). timeout - crossing alert timeout. number of repeats - the limit of crossing alert repeats. number of comme
フィルタ:
レビューなし
レビューに返信