YouTubeにあるマーケットチュートリアルビデオをご覧ください
ロボットや指標を購入する
仮想ホスティングで
EAを実行
EAを実行
ロボットや指標を購入前にテストする
マーケットで収入を得る
販売のためにプロダクトをプレゼンテーションする方法
MetaTrader 5のためのエキスパートアドバイザーとインディケータ - 31
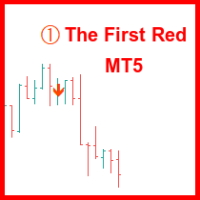
「The First Red」インジケーターは、ダリウシュ・ダルゴ(Dariusz Dargo)が考案した戦略に基づき、「The First Red」戦略および「Second Red」、「First Green」、「Second Green」などの拡張条件を満たすローソク足をチャート上で特定してマークするために設計されています。この戦略は、局所的な極値の分析とMACDオシレーターのシグナルを中心に展開されています。 第一の赤いローソク足(First Red Candle): ローソク足が局所的な最高値を形成し、MACDヒストグラムが下降方向に転じたときに「First Red」としてマークされます。 チャート上のシンボル:ローソク足の上に赤い下向きの矢印。 第二の赤いローソク足(Second Red Candle): 「First Red」に続く第二の下降ローソク足で、方向転換を確認します。 チャート上のシンボル:ローソク足の上に赤い数字「2」。 第一の緑のローソク足(First Green Candle): ローソク足が局所的な最安値を形成し、MACDヒストグラムが上昇方向

ProVolaBot は、合成指数市場の取引を目的として設計されたアルゴリズム取引ロボットです。
以下の市場で特に安定したパフォーマンスを示しています: 主要かつ最も効果的な市場 • Boom 900 および Crash 1000(Deriv)
• GainX 999 および PainX 999(WellTrade) これらの市場は、ProVolaBot が最も高い安定性、統計的優位性、および収益性の可能性を示した環境です。 追加で対応可能な市場 • Volatility 100(1s)Index(Deriv) ProVolaBot は V100(1s)でも動作しますが、複雑なボラティリティ構造により、過去の結果では主要市場と比較して収益性が低くなっています。
この市場は、経験豊富なユーザー向けとして推奨されます。 アプローチと動作ロジック ProVolaBot は、自動的な構造ブレイク(Breakout)検出に基づく戦略を採用し、規律ある実行ルール、リスク管理、シグナルフィルタリング、および取引回数制限と組み合わせています。 本ロボットは、明確なパラメータとリスク管理の枠組みの下で

Metatrader 5 version of the famous Andre Machado's Tabajara indicator. If you don't know Andre Machado's Technical Analysis work you don't need this indicator... For those who need it and for those several friend traders who asked this porting from other platforms, here it is...
FEATURES
8-period Moving Average 20-period Moving Average 50-period Moving Average 200-period Moving Average Colored candles according to the inflexion of the 20-period MA
SETTINGS You can change the Period of all MA's
FREE
Free RSI Multi-Strategy EA for MT5 Overview This free MQL5 Expert Advisor (EA) is designed to trade automatically using six powerful RSI-based strategies. Whether you prefer trend-following, breakout trading, scalping, or counter-trend strategies, this EA provides flexibility and adaptability to different market conditions.
Features & Strategies The EA includes six RSI trading strategies: RSI Overbought & Oversold – Classic reversal strategy based on extreme RSI levels. RSI Divergence – Id
FREE

このライブラリを使用すると、任意の EA を使用して取引を管理でき、説明に記載されているスクリプト コードを使用して任意の EA に簡単に統合でき、完全なプロセスを示すビデオのデモ例も利用できます。
- 指値注文、SL 指値注文、利食い指値注文の発行
- マーケット、SLマーケット、TPマーケットの注文を行う
- 指値注文の変更
- 注文をキャンセルする
- 注文のクエリ
- レバレッジ、マージンの変更
- 位置情報の取得
もっと...
MT5 に Binance チャートがない場合を除き、暗号チャートのレンタルはオプションです。
スクリプトのデモについては、 ここをクリックしてください
トレーディングパネルでの取引をご希望の場合は、 この製品に興味があるかもしれません

MT4バージョン: https://www.mql5.com/ja/market/product/90950 MT5バージョン: https://www.mql5.com/ja/market/product/93706
Rebate Hunter – マルチペアヘッジグリッドEA(ダイナミックアダプティブ)
Rebate Hunterは、安定した取引量を確保しながら、バスケット利益をコントロールできるよう設計された、マルチペアヘッジグリッドEAです。このEAは、売買を同時に開始し(ヘッジエントリー)、ダイナミックアダプティブグリッドディスタンスと自動バスケットクローズシステムを用いてポジションを管理します。
このアプローチは、安定した利益サイクルと高い取引量を重視しつつ、様々なボラティリティ状況に対応できるEAを求めるトレーダー向けに構築されており、取引量ベースのリベートプログラムの恩恵を受ける口座に最適です。
主な機能 真のヘッジエントリー(買い+売り) Rebate Hunterは、エクスポージャーのバランスを保ち、方向性への依存を軽減するために、2つのポジションを同時に

This indicator uses support and resistance, volume and some special formula to calculate the volume to filter the candles. If the volume reaches a specific value, And at the same time, Candle breaks the support/resistance line, There would be a signal and we can enter the market. Signals appear when the current candle closes. then you can enter the trade when a new candle appears. Please don't forget to follow your money management plan.
MT4 Version Support/Resistance Breakout MT4 : https:/

El indicador utiliza múltiples marcos de tiempo para analizar las mejores entradas de compra en el auge 1000. Está diseñado para ayudar a operar únicamente en picos de auge. el indicador tiene dos flechas; los rojos y azules. la formación de la flecha roja indica que debe estar preparado para una flecha azul que es una señal de entrada de compra. el indicador no ofrece puntos de salida. siempre recopile 3 pips, es decir, si ingresó a una operación a 10230,200, puede salir a 10260,200 con SL a 1
FREE

Trade the Ichimoku Kinko Hyo Indicator with complete freedom using a powerful and flexible EA. It implements many entry strategies and useful features, like customizable trading sessions and a martingale mode. [ Installation Guide | Update Guide | Troubleshooting | FAQ | All Products ] Easy to use and supervise It implements several entry conditions Customizable break-even, SL, TP and trailing-stop settings Works for ECN/Non-ECN brokers Works for 2-3-4-5 digit symbols Implements a martingale fea
FREE

Lock is a powerful tool for saving a trader's money. Instead of the traditional stop loss, you can now use this robot. The robot will place a pending lock — a counter order. When the price moves sharply against the trader, the lock becomes a market one, and therefore the loss does not increase, but freezes at the same level. The main position is saved and will bring profit as soon as the lock closes. Each position is locked by a separate lock. The number of positions is not limited.
The robot c

このダッシュボードは、選択されたシンボルの最新の利用可能なハーモニックパターンを表示するので、時間を節約し、より効率的に / MT4バージョン 。
無料インジケーター: Basic Harmonic Pattern
インジケーター列 Symbol : 選択したシンボルが表示されます。 Trend : 強気または弱気 Pattern : パターンの種類(ガートレー、バタフライ、バット、カニ、サメ、サイファー、ABCD) Entry : エントリー価格 SL: ストップロス価格 TP1: 1回目の利食い価格 TP2: 2回目の利食い価格 TP3: 3回目の利食い価格 Current price : 現在値 Age (in bars): 最後に描画されたパターンの年齢
主な入力項目 Symbols: "28 Major Currency Pairs "または "Selected Symbols "から選択。 Selected Symbols: カンマで区切られた監視したいシンボル("EURUSD,GBPUSD,XAUUSD")。ブローカーがペアに接

GOLD PIVOT DOMINATOR is an expert advisor for gold trading (XAUUSD), developed according to the principles of institutional market logic. Only 5 copies at premium price, then the price will increase! GOLD PIVOT DOMINATOR is an expert advisor for gold trading (XAUUSD), developed using the principles of institutional market logic and prioritizing the quality of trading decisions over their quantity. The strategy is focused on working from key pivot zones of support and resistance , with mandatory

This indicator calculates support and resistance prices in multi-timeframe with different formulation and draw them on the chart that style do you choose. And If you want, Indicator can alert you when the current price arrive these pivot levels. Formulations: Classic, Camarilla, Woodie, Demark, Floor, Fibonacci
Alert Options: Send Mobil Message, Send E-mail, Show Message, Sound Alert
Levels: PP, S1, S2, S3, S4, S5, R1, R2, R3, R4, R5, TC, BC and Middle Points Why do you need this indicator:
Ti
FREE
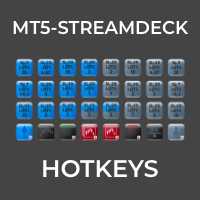
MT5-StreamDeck offers the possibility to use a certain number of pre-programmed Hot-keys with a clearly defined role. So by the push of a button you can open a trade with a pre-defined lot size, stoploss and take profit. Close all your trades, close the ones in profit, or in loss, set Break-even or set a trailing stop. All this with a Hot key button. See the feature list for all the actions that can take place at the push of a button. Ideal for Quick Scalping or day trading with set risk managem

Quantum Force EA – Disciplined Automated Gold Trading System (No Martingale / No Grid Trading) Short Description Designed Around a 1:3 Risk-reward Structure on MQL5 MetaTrader 5 A disciplined and fully automated trading system for XAUUSD (Gold).
Quantum Force EA combines adaptive logic gold scalping, volatility filters, trend following and capital protection techniques to rule-based trade execution without using martingale or grid strategies. Fully customise
Full Description Quantum Force EA i

"CHOMPER PULLBACK"
Trend Pullback Reversed – Aggressive Reversal Strategy Trend Pullback Reversed is a high-performance Expert Advisor designed for M5/M15 trading on XAUUSD, Forex, and other major pairs. This EA implements an aggressive reversal pullback strategy , detecting deep pullbacks in trending markets and executing trades against the classic pullback signal , turning potential continuations into high-probability reversals. Key Features: Reversed Signal Logic: Buys on classic sell-pullba
FREE

TrendSniiper v2.0 — Artificial Intelligence Powering Your Trades "When the market screams chaos, TrendSniiper hears patterns."
Have you ever wondered why some traders seem to have a sixth sense for avoiding bad trades? It's not luck. It's not mystical intuition. It's pattern recognition — the same technology that enables self-driving cars to avoid accidents and doctors to detect diseases before symptoms appear. Now, this technology is in your hands.
The Smart Trading Revolution Tren

This indicator draws trading zones based on fractals from higher periods, which simplifies trading by levels.
This indicator draws two types of trading zones on one chart.
For example, if the current period is H1, then trading zones will be searched for by fractals from H4 and D1.
In the standard settings, fractal zones from H4 will be drawn in yellow, and from D1 - in green.
When zones are superimposed, colors are mixed at the intersection of zones. I don’t know how to fix this at the mome
FREE

BITCOIN QUANTUM PROFIT V6 - INTELLIGENT TP Expert Advisor Specialized for BTCUSD - M1 Timeframe Optimized Important : ActiverModeMarketTest : false TECHNICAL OVERVIEW Bitcoin Quantum Profit V6 is a professional Expert Advisor specifically designed and optimized for BTCUSD trading on M1 timeframe . It integrates a revolutionary Intelligent Take Profit system that adapts to Bitcoin's unique volatility and exploits micro-movements in the 24/7 crypto market. BITCOIN M1 SPECIALIZATION Dedicated BTCUS
FREE

説明
ICSM(Impulse-Correction SCOB Mapper)は、価格の動きを分析し、有効なインパルス、修正、およびSCOB(Single Candle Order Block)を識別するインジケーターです。柔軟性があり、情報量が多く、使いやすく、最も流動性の高い関心領域に対するトレーダーの認識を大幅に向上させるため、あらゆるタイプのテクニカル分析で使用できる強力なツールです。
設定
一般 | ビジュアル
カラーテーマ — ICSMのカラーテーマを定義します。
SCOB | ビジュアル
SCOBを表示 — SCOBを有効/無効にします;
SCOBをマークする — SCOB表現のスタイルオプションのリストを表します;
SCOB色 — SCOBの色を定義します;
ICM | ビジュアル
ICMラインを表示 — ICM(Impulse-Correction Mapper)ラインを有効/無効にします;
ICトレンドを表示 — チャートの下部にある色付きの仕切りを通じてインパルス-修正トレンドの視覚化を有効/無効にします;
ライン色 — ICMラインの色

EA Performance Monitor - Your Trading Command Center Overview EA Performance Monitor is a comprehensive monitoring tool for MetaTrader 5 that provides real-time oversight of all Expert Advisors running across your charts. This utility displays performance metrics, risk assessment, and account health in a centralized dashboard, enabling efficient portfolio management and informed decision-making. Key Features Mission Control Dashboard Transform your trading workspace into a professional command

BoxLevels Pro — 前日のレンジとブレイクアウト
BoxLevels Pro は前日の高値・安値レンジボックスを自動で描画し、次のセッションでのブレイクアウトを矢印で表示します。FX・指数・金属・CFD のレンジ戦略やブレイクアウト、平均回帰に最適な軽量ツールです。 なぜ機能するのか
前日のレンジは重要な流動性ゾーンになることが多く、次のセッションでの最初の明確なブレイクは方向性のボラティリティを生みやすいです。BoxLevels Pro はこれらの瞬間を強調し、距離ルールで偽ブレイクをフィルタリングします。 主な特徴 前日ボックス:高値・安値・ミッドラインを影付きで表示。 次セッションのブレイク矢印:連続 N 本の終値がレンジ外でシグナル。 距離フィルター:Auto / Points / Pips / %Range(+ 最小距離設定)。 セッション開始時刻(UTC):完全にカスタマイズ可能。 ラベル:H / L / MID の値をボックス横に表示。 カスタムスタイル:色・枠・塗り・線・矢印サイズ・オフセットを設定可能。 軽量で安定:バッファなし、リペイントなし。 対応
FREE

Grid Masters Grid Matrix Pro MT5 — スマート双方向グリッドシステム
高確率トレードゾーン(PP、R1、S1)を自動で検出し、動的な買い/売りグリッドを構築する高度なEA。トレーリング、エクイティロック、利益ロック凍結、ポジションの「X取引日後に自動決済」機能を搭載。チャート上の BUY、SELL、CLOSE ALL ボタンで即時手動操作が可能。
---
概要
Grid Masters Grid Matrix Pro MT5は、プロ仕様の双方向グリッドEAです。市場の主要な均衡ゾーン周辺に自動で買い/売りグリッドを生成し、エクイティロック、利益ロック凍結、スマートトレーリング、時間ベースのポジションクローズでリスクを動的に管理します。
手動監視でも完全自動でも、構造に基づく注文、リスク管理、柔軟なグリッド運用を提供します。
---
主な機能
ゾーン自動検出(PP、R1、S1) — 均衡ゾーン到達時に即反応
双方向グリッドロジック — 設定可能な間隔、TP、SL、ロットサイズでBUY/SELLグリッドを対称配置
エクイティ & 利益

Doji Flow : Precision Trading, Powered by Heikin-Ashi Doji Intelligence Welcome to Doji Flow , a meticulously crafted, next-generation trading system designed to transform subtle market indecision into consistent opportunity. Built for the astinct trader seeking clarity in chaos, this expert advisor combines advanced Heikin-Ashi Doji detection with smart, adaptive risk management ,all in one seamless, robust package. - Key Features - Heikin-Ashi Doji Detection
Identifies high-probability
FREE
Coppy Master MT5 は、 MetaTrader 4 端末と MetaTrader 5 端末間で取引をコピーするためのツールです。両方向のコピーをサポートします:
MT5 から MT4、MT4 から MT5、また同じタイプのアカウント間でも可能です。 正しく動作させるには、すべてのターミナルを 1 台のコンピューターまたは VPS で起動する必要があります。
[ Instruction and Demo ] MetaTrader 4 にコピーするには、製品の別のバージョンである Coppy Master MT4 が 必要です。 主な機能: 接続タイプ
マスターモードとレシーバーモード。注文の送受信ロジックを柔軟に設定できます。 注文管理
成行注文と保留注文のコピー。取引の同期クローズ、部分クローズ、取引の反転、SL/TP の変更のサポート。 シンボルの操作
プレフィックスとサフィックスのサポート。個々の文字の除外/包含。アセットにカスタム名を割り当てる機能。 制限とリスク管理
1 日あたりの取引回数、1 日の最大損失、コピーを停止する残高レベルの制限。 音量

OneClick Trade Panelは、重要な取引機能を指先一つで操作できるプロフェッショナルな取引管理ツールです。迅速かつ効率的な取引管理を必要とするトレーダー向けに設計されたこのEAは、複雑な取引タスクをワンクリック操作で簡素化します。
このツールを使用することで、従来の手動方法よりも迅速かつ効率的に保有ポジションを管理できます。
このEAの機能 このエキスパートアドバイザーは、3つの主要な取引管理機能を提供します。
SL/TPをブレークイーブンに移動 - スマートな取引保護
利益が出ている取引の場合、ストップロスをエントリー価格に自動的に移動します
損失が出ている取引の場合、テイクプロフィットをエントリー価格に移動します
すべての保有ポジションをワンクリックで保護
部分決済 - 利益を段階的に確定
ポジションの一定割合(10%、25%、50%など)を決済します
設定で割合を構成可能
複数のポジションに同時に対応
全決済 - 緊急脱出
すべての保有ポジションを即座に決済します
現在のシンボルまたはすべてのシンボルで動作
迅速な市場からの撤退に最適

AW Donchian Trend EA - トレンドインジケーター AW Donchian Trend のシグナルに基づいて取引するアドバイザー。インジケーター戦略 TakeProfit と StopLoss を使用し、さらにアドバイザーには Trailing、オーバーラップ、損益分岐点機能が組み込まれています。マルチタイムフレーム フィルタリング、自動ロット計算を使用して、デポジットからリスク パーセンテージを節約できます。機能的には、時間やさまざまな平均化オプションで作業できます。 アドバイザーの指示と説明 -> ここ / MT4バージョン -> ここ 利点: 異なるストップロスシナリオも損益分岐点であり、 テイクプロフィットやトレーリングのバリエーション 内蔵時間制御、 あらゆるタイプの取引商品に対応 自動ロット計算と重複、 カスタマイズ可能なマルチタイムフレームフィルター、 オプションで平均化を使用できます。 ポジションを開くための戦略: 1) 「S uccess_Rate 」。より正確なシグナルを処理するための成功率を指定します。値が
Elevate Your Trading with Advanced Anchored Volume Weighted Average Price Technology Unlock the true power of price action with our premium Anchored VWAP Indicator for MetaTrader 5 - the essential tool for precision entries, strategic exits, and high-probability trend continuation setups. Write me a DM for a 7 day free trial. Anchored VWAP Plus gives traders unprecedented control by allowing custom anchor points for Volume Weighted Average Price calculations on any chart. With support for 4 sim
FREE

Volume Footprint Analysis is a precision-engineered, volume-based indicator that transforms raw market volume into an intuitive, color-coded signal system. Built on concepts from Volume Spread Analysis (VSA) and Smart Money principles, this tool removes the guesswork from volume interpretation and gives traders clear, actionable insights on when to buy or sell — on any timeframe and across any trading instrument. MT4 Version - https://www.mql5.com/en/market/product/138564/ Join To Learn Mark
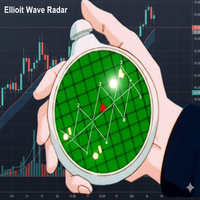
このインジケーターは何をしますか? このインジケーターは、チャートを自動的に分析して エリオット波動のパターン (推進波と修正波)を特定し、リアルタイムで波1、2、3、4、5がどこにあるかを表示します。さらに、 価格予測 、 出来高の検証 、および 三角保ち合いの検出 も含まれています。 この「レーダー」バージョンはどのように改善されましたか? 目標の予測: 第5波での価格の行方を提案します。 出来高による検証: 出来高が検出されたパターンを支持しているか確認します。 三角保ち合いの検出: 複雑な修正(収縮、拡張、対称)を特定します。 確率分析: 検出されたパターンの信頼性(%)を示します。 複数の代替カウント: 市場が曖昧な場合に、複数の有効な選択肢を提供します。 色と線の見方 波の線: 青: 推進波 (1、3、5)— 主要なトレンド。 赤: 修正波 (2、4)— トレンド内の後退。 黄色い線(推奨される後退) この線は、修正が終了する可能性が最も高い水準を示します。 もし価格が後退し、黄色の線の基部(価格に最も近い点であり、エントリーレベルとして機能します)を破ると、その線が反対側
FREE

ICT Silver Bullet CRT EA: Master the Market's True Rhythm Are you an ICT student who understands the power of timing and liquidity, but struggles to be present for every high-probability setup? Do you want to automate the precision of the "Silver Bullet" strategy to ensure you never miss an opportunity? Introducing the ICT Silver Bullet CRT EA , the ultimate tool for traders who think in terms of liquidity, market structure, and fair value. This Expert Advisor was meticulously programmed to repl
FREE

This indicator is designed to help traders to help them Synchronize objects across all charts that have the same pair/currency.
Applicable objects: -Rectangle
-Trendlines
-Trendlines by Angle
-Horizontal Lines
-Vertical Lines
-Arrow Lines
-Channels
- Text boxes
Known Issues : - Visualization is not copied to the other charts. - If indicator is only placed in one chart, other charts with the same pair/currency will have difficulty deleting the objects if there is no "Sync Objects In Charts" in
FREE

This is a multi timeframe version of the Supply and Demand indicator . It allows you to analyze a chart using the law of supply and demand on three different timeframes at a time. You will see zones of sales and purchases and determine the most profitable points to open positions. The indicator is based on the principle of market fractality. Supply and demand zones show places where a strong buyer or seller has made the price reverse and change its direction. The indicator has several types of
FREE
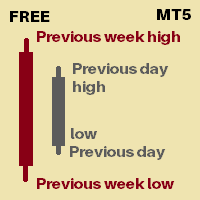
Its an indicator that will show you
Previous day high Previous day low Previous week high Previous week low You can set how many days of history you would like to see for previous day high low and previous week high low Currently 30 days of PDH/L will be marked 4 weeks of PWH/L will be marked You can change it from indicator settings. Dates are shown at marking lines to identify which date does that marking belongs to.
Thank you :) Always open to feedback and criticism if it helps me provide yo
FREE

Product Description: Swing Points & Liquidity (MT5) What it does:
This indicator automatically identifies significant "Swing Highs" and "Swing Lows" (Fractals) on your chart. It assumes that these points represent Liquidity (where Stop Losses and Buy/Sell stops are resting) or Supply and Demand Zones . When a Swing High is formed, it projects a Red Box/Line to the right (Supply/Resistance). When a Swing Low is formed, it projects a Green Box/Line to the right (Demand/Support). As

This indicator implements the QQE (Qualitative Quantitative Estimation) algorithm for MetaTrader 5, incorporating volatility bands logic. The indicator combines the Relative Strength Index (RSI) with Average True Range (ATR) to determine market direction. The histogram changes color based on the interaction between the RSI momentum and the calculated volatility channel. Technical Logic: The algorithm smoothes the RSI values and constructs upper and lower bands. When the smoothed RSI breaks these
FREE

The "Support Resistance Dynamic" indicator is a powerful technical analysis tool for the MetaTrader 5 platform, designed to automatically identify and plot dynamic Support and Resistance zones on price charts. This indicator helps traders easily recognize important price levels, potential reversal points, or breakout areas, thereby enabling more informed trading decisions. 2. Key Features Dynamic S/R Identification : Automatically identifies support and resistance zones based on an advanced Pivo
FREE

this is a highly profitable semi-auto grid strategy.
MT4 Version
======== Usage======== :
Symbol: Any Main pairs Timeframe: H1 or higher Recommend Lots: 0.01 per 1000 USD
Note: Grid strategy is alwasy with some risk due to the increasely accumulated risk lots. but the high profit makes such strategy still being popular no matter how forex industry developed.
semi-auto trading should be the best way to equilibrate profit and risk. this EA has integrated many useful options for user to con
FREE

日本のローソク足パターン EA ΜΤ5 は、よく知られている日本のローソク足パターンに基づいた、8 つの組み込み戦略を備えた完全に自動化された Expert Advisor です。 独自の数の設定があり、あらゆる市場条件で非常に用途が広いです。 この EA には、ECN Raw Spread ICMarkets アカウント (ニューヨーク ベースの GMT+3 タイム ゾーン サーバー) 用に特別に最適化された、多くのシンボル/商品用の新しいセット ファイルが付属しています。 他のブローカーまたは口座タイプを使用することもできますが、ブローカー/口座に合わせて必要な時間を調整する必要がある場合があります. アドバイス: 私のEAは市場を予測する魔法のシステムではなく、マーチンゲールやグリッド戦略を使わずに安定した結果を得るために構築された、堅実でよく設計されたツールです。成功するためには忍耐と規律が必要です。すべてのEAを定期的に最適化し、年に2回新しいセットファイルを公開し、毎月パフォーマンスを確認しています。常に私が推奨するセットファイルのみを使用し、1シンボルあたりのリ
Supertrend G5 Indicator Supertrend G5 is a high-performance trend-following tool designed to accurately identify market reversal points. By displaying a color-coded line directly on the chart, this indicator helps you quickly recognize bullish trends (green) and bearish trends (red), supporting optimal entry and exit points. Key Features: Clear Buy/Sell Signals Buy when the Supertrend line changes from red to green (beginning of an uptrend). Sell when the Supertrend line changes from green to re
FREE

The RSI Engine EA は、SPLpulseによって開発されたMetaTrader 5 (MT5) プラットフォーム用の自動売買ロボット(EA)です。その中核機能は、相対力指数(RSI)インジケーターからのシグナルに基づいて取引戦略を実行することです。このEAは高度に設定可能で、ユーザーは複数のRSIベースのエントリー戦略から選択し、確認フィルターを適用し、特定のリスクパラメータで取引を管理することができます。 取引戦略とシグナル EAのロジックは、主にユーザーが選択可能なエントリーおよびエグジット戦略によって駆動されます。 エントリーシグナル ユーザーは、取引シグナルを生成するために以下の方法の1つ以上を選択できます。 RSIダイバージェンス(デフォルト戦略): デフォルトで有効になっている主要な戦略は、RSIダイバージェンスに基づく取引です。EAは過去60本(設定変更可能)のバーをスキャンし、価格の動きとRSIインジケーターが逆方向に動いている時を特定します。これはしばしば反転が差し迫っていることを示唆します。 強気のダイバージェンス(買いシグナル): 価格が新安値
FREE
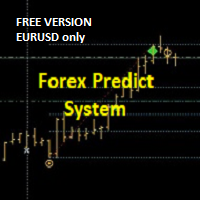
+++++++++++++++++++++++++++++
+++ FREE VERSION - EURUSD ONLY
+++++++++++++++++++++++++++++
Please add PREFIX and/or SUFFIX via settings if your Broker Chart Symbol is different (e.g. suffix = .r).
+++
This is forecast system.
On the moment of the breakout/forecast: the indicator draws retrace zone (yellow) and three targets. The levels act as support and resistance. It can be used on all pairs/indices/timeframes/periods. For the higher timeframes (H4, H1, M30) it's better to engage at Optima
FREE

Gold Trading Bot Description: MSTrade Xauusd Scalping Overview:
MSTrade Xauusd Scalping is a non-Martingale Expert Advisor (EA) designed for XAU/USD (Gold) trading. It focuses on capital preservation, strict risk management, and low drawdowns by executing one trade at a time. The bot uses technical analysis, volatility filters, and adaptive risk controls for consistent performance in all market conditions. Key Features: Non-Martingale Strategy Single-Trade Focus: Opens one position per direc
FREE
RSIEAΜΤ5 は、よく知られた非常に効率的な相対力指数を取引するためのユニークで完全に自動化されたエキスパートアドバイザーであり、同時に、すべてのオープンポジションを合わせて、バスケットレベルで取引口座の利益および/または損失を管理することができます。 RSI EA MT5 には、相対力指数の取引、ライブバーでのRSI極値でのオープン取引、クローズドキャンドルでのRSI極値でのオープン取引、RSI踏切でのオープン取引の4つの異なる戦略があります。この最後の戦略は、相対強度インジケーターのユニークなアプローチです。これは、トレンドフォロー戦略であり、逆転戦略ではないためです。この EA には、ECN Raw Spread ICMarkets アカウント (ニューヨーク ベースの GMT+3 タイム ゾーン サーバー) 用に特別に最適化された、多くのシンボル用に提供されたセット ファイルが付属しています。他のブローカーまたはアカウントタイプを使用することもできますが、ブローカー/アカウントに合わせて必要な時間調整を行う必要がある場合があります。 アドバイス: 私のEAは市場を予

Steady Gain Protector is a simplified entry-level version of the Gold Rocket HFT trading system. It is designed for users who want a basic automated trading experience with fixed parameters and limited functionality. This Expert Advisor opens BUY positions only , using a dual Exponential Moving Average (EMA) crossover combined with short-term price momentum confirmation. The system is intended for small accounts and traders who prefer a simple structure with controlled exposure. Trading Logic
FREE

CYBERIA PRO SCALPER Contact me privately after purchase to receive the optimized set files with the best settings! Preset test XAUUSD CYBERIA PRO 3.8 – Launch Offer and Pricing Introductory price: $400 for the first 5 buyers - 3/5 Last two copies of Cyberia at $400 before the price increases to $600.
Then $600 for the next 10 buyers
Followed by $800 for the next 10 buyers
Subsequent pricing will be adjusted according to market conditions and product maturity Product Overview CYBERIA PRO

AlgoRex専用ボラティリティアダプター AlgoRexのボラティリティアダプターは、ATR(平均真の範囲)とRSI(相対力指数)を駆使して、市場の揺れをリアルタイムで分析します。この機能により、市場の変動にも対応し、トレンドの変化を捉えることが可能です。トレーダーは、この技術を活用して、市場の動きに合わせた取引チャンスを見極めることができます。 動的取引調整機能 現在の市場環境に基づいて、トレーディング戦略を自動的に調整するAlgoRexの動的取引調整機能は、様々な市場状況に対応します。この機能は、リアルタイムの市場分析を基にして、エントリーとエグジットのポイントを最適化します。 おすすめ通貨ペア EURUSD USD/JPY GBPUSD おすすめ時間足 H1
FREE
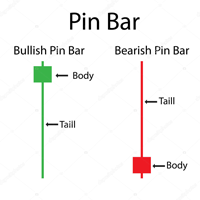
Pin bar pattern is characterized by a long upper or lower wick with a small body relative to the size of the wick with little to no lower or upper shadows. Pin bars are not to be traded in isolation , but need to be considered within the larger context of the chart analysis. A pin bar entry signal, in a trending market, can offer a very high-probability entry and a good risk to reward scenario.
Inputs Multiplier ; AlertOn - enable alerts; EmailAlert - enable email alerts; PushAlert - en
FREE

Extended Round 1 Special Pricing for Early Adopters | Current Price: $299 - Only 10 copies left at this price | Next Price: $399
Aureus MT5 is a cutting-edge Expert Advisor designed exclusively for trading Gold. Combining the precision of a price reversal trading strategy with advanced machine learning, Aureus MT5 provides traders with a reliable tool to navigate the complexities of the Gold market. Strategy Aureus MT5 employs a multi-faceted approach with three distinct price reversal strat

MT5用のMarket Structure Break Outを紹介します – プロフェッショナルなMSBおよびUnbroken Zoneインジケーター。 MT4バージョンも利用可能です。こちらをご覧ください: https ://www .mql5 .com /en /market /product /109958 このインジケーターは継続的に更新されています。 私たちは、マーケット構造に基づいた非常に正確なエントリーおよびエグジットポイントを提供することに尽力しています。現在バージョン1.1に達しており、今ご参加いただければ以下の最新の変更が含まれます: 買いと売りのターゲット: 買いと売りのポジションに対して最適な利益確定レベルに関する明確な情報を取得できます。 最新のMSB方向: 最も最近のMarket Structure Breakoutの方向を表示して、より良い意思決定をサポートします。 改良されたビジュアルモード: ライト、ダーク、またはカスタムテーマに合わせてチャートをカスタマイズできます。 ライブテストの切り替え: 新しいオンスクリーンボタンで、ライブ

VR ティックは、 スキャルピングベースの戦略のための特別なインジケーターです。このインジケーターのおかげで、トレーダーは金融商品のメインチャート上でティックチャートを直接見ることができます。ティック チャートを使用すると、できるだけ正確に市場にポジションを入力したり、市場でポジションを決済したりできます。 VR Ticks は、方向に応じて色が変わる線の形で目盛りデータをプロットします。これにより、目盛りの状況を視覚的に理解し、評価することができます。ティック チャートの利点は、時間枠を考慮せず、価格の変化に基づいて構築されることです。 VR Ticks は可能な限り最小限のチャートを作成します。 設定、設定ファイル、デモ版、説明書、問題解決方法は [ブログ] でご覧いただけます
[リンク] でレビューを読んだり書いたりできます。
[MetaTrader 4] のバージョン ティックは 1 つの値動きです。 1 つの価格変動に対して、価格は 1 ポイントまたは数ポイント変化する可能性があります。 ティックは動きである ことを理解することが重要です。 このインジケーターには、右下にアス
FREE

フェニックス・トレンド強度メーター (MT5)
MetaTrader 5 向け市場環境とトレンド強度分析ツール。ADX、RSI、方向性指数を単一パネルに統合し、市場状況をリアルタイムで分類します。
目的
多くのトレーダーが失敗するのは、エントリーポイントが悪いからではなく、間違った市場環境に誤った戦略を適用するためです。フェニックス・トレンド強度計は、市場がレンジ相場か、トレンド形成中か、強いトレンドか、あるいは消耗リスク領域に入りつつあるかをトレーダーが瞬時に判断するのを支援します。
本指標は、トレンド強度をADXで、方向性バイアスをDIで、モメンタムバランスをRSIで分析します。これらを視覚的なメーターに統合し、明確なテキストベースの相場状態分類(レンジ、慎重なロング/ショート、強いロング/ショート、リスク/延長)を表示します。パネルは新しいバーで更新され、オプションで相場状態変化や消耗アラートを含みます。
インストール
MQL5マーケットからダウンロードし、任意のチャートに添付してください。パネルは事前最適化されたデフォルト値で即座に表示されます。
要件
Meta
FREE

The Swing High Low Indicator is an essential tool for traders who rely on price action. It automatically marks key reversal points (swing highs in red, swing lows in green), helping you visualize trends, spot breakouts, and draw precise trendlines. By highlighting these critical levels, the indicator reveals market structure shifts—whether the trend is strengthening, reversing, or entering consolidation. Perfect for all timeframes and strategies, it turns raw price data into actionable tra
FREE

Este indicador traça uma reta baseada em regressão linear, esta reta é dinâmica e é atualizada a cada tick. O cálculo de regressão linear é feito considerando o número de candles definido pelo tamanho da janela fornecida pelo usuário. São traçadas duas linhas, uma superior e uma inferior, para guiar a estratégia do usuário, a distância dessas linhas para a linha central deve ser configurada. É possível definir os estilos, cores e espessuras de cada uma das linhas.
Esse indicador foi inicialmen
FREE

Combination of Ichimoku and Super Trend indicators. 1. ARC (Average Range times Constant) The concept of ARC or Volatility System was introduced by Welles Wilder Jr. in his 1978 book, New Concepts in Technical Trading Systems . It has since been adapted and modified into the popular Super Trend indicator.
The fundamental idea behind ARC is simple: to identify support and resistance levels, you multiply a constant with the Average True Range (ATR) . Then, you either subtract or add the resulting
FREE

YOU CAN NOW DOWNLOAD FREE VERSIONS OF OUR PAID INDICATORS . IT'S OUR WAY OF GIVING BACK TO THE COMMUNITY ! >>> GO HERE TO DOWNLOAD
More About Advanced Currency Meter Every good forex system has the following basic components: Ability to recognize the trend direction. Ability to identify the strength of the trend and answer the basic question Is the market trending or is it in a range? Ability to identify safe entry points that will give a perfect risk to reward (RR) ratio on every position.
FREE

The Inside Bar pattern is a very well known candlestick formation used widely by traders all over the world and in any marketplace. This approach is very simple and adds a little confirmation candle, so it adds a third past candlestick to the count to confirm the direction of the move (upward or downward). Obviously, there is no power on this candlestick formation if the trader has no context on what it is happening on the market he/she is operating, so this is not magic, this "radar" is only a
FREE

Universal Auto-Dynamic Engine (UAD-Engine) v7.3 UAD-Engine v7.3 は、 XAUUSD (ゴールド) および BTCUSD (ビットコイン) での精密な取引のために設計されたプロフェッショナルなエキスパートアドバイザー (EA) です。高度な市場ロジック ( ストップ狩り & FVG検知 ) と堅牢な スマートグリッドシステム を組み合わせています。 主な機能: スマートエントリー: フェアバリューギャップ (FVG) とストップ狩り検知を利用して、高確率なエントリーポイントを見つけます。 加重バスケット管理: 全ポジションの真の加重平均価格を計算し、平均価格に基づいて動的なTP/SLポイントを設定します。 ドローダウン制御: 新しい取引の利益で損失取引を相殺し、ドローダウンをスマートに削減する「オーバーラップ」システムを統合。 時間フィルター: 取引日と時間を細かく制御し、高リスクな期間を回避します。 プロフェッショナルダッシュボード: リアルタイムの統計情報を表示する「ブラック
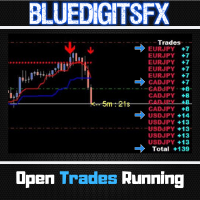
Free Utility Tool by BlueDigitsFx
Designed to improve workflow and trade management
Also available for MetaTrader 4
Optional access to updates & support via the BlueDigitsFx Discord Server BlueDigitsFx Open Trades is a powerful MT5 tool that displays your total pips from all open trades in real time.
Its intuitive color-coded interface quickly indicates winning and losing trades across all currency pairs.
This helps you monitor your trade performance effortlessly, enabling faster decision-
FREE

お客様各位
God Gold Martingaleのオーナー兼開発者であるPratham Barotより、私のEAの偽造版が様々なページに掲載されていることが分かりましたので、お知らせいたします。お客様の大切な資金を守り、安全な取引体験を確保するために、これらの偽造品はご遠慮ください。必ず正規のプラットフォームをご購入・ご利用ください。YoForex.org/MQL.SOFTWARE/YOFOREX.NETなど、当社の名を騙った偽ボットを販売するプラットフォームはご遠慮ください。これらは詐欺であり、お客様の資金を無駄にする恐れがあります。安全のためにも、公式プラットフォームからのみご購入ください。
お客様のご信頼とご支援に感謝申し上げます。
敬具 Pratham Barot HFT Gold Martingale EA の紹介
HFT Gold Scalper EA は、金市場(XAUUSD)における高頻度取引のために設計された、先進的な自動売買システムです。短期的な価格変動を活用するために、精密なアルゴリズムを使用して迅速な取引を実行します。MetaTrader 5 に対応し

Smart Detector EA – シンプルに実現するインテリジェントトレード Smart Detector EA は、高度な取引システムであり、複雑なテクノロジーをシンプルで使いやすいソリューションに変換します。すべてのレベルのトレーダー向けに設計されており、わずかな基本的な外部設定だけで手動設定を最小限に抑え、残りは強力なリアルタイム最適化と適応型機械学習に任せます。 主な特徴: 完全自動化: 高度な自動化により、ユーザーの操作はほとんど不要。 適応型インテリジェンス: 戦略は自己最適化し、市場環境にリアルタイムで適応。 堅牢な戦略: 取引環境に対する感度が低く、一貫したパフォーマンスを実現。 リスク重視の設計: マーチンゲール、グリッド、ナンピン手法は一切不使用。 効率的な取引: 常に1つのポジションのみを保有し、管理を簡素化。 柔軟な保有期間: 典型的な取引は数時間から数日間継続。 スマートな決済: 反対シグナルが発生すると自動的にポジションを決済。 カスタマイズ可能なリスク管理: 固定ストップ/ターゲット水準やポジション損失制限をオプションで設定可能。 Smart Det

Necessary for traders: tools and indicators Waves automatically calculate indicators, channel trend trading Perfect trend-wave automatic calculation channel calculation , MT4 Perfect trend-wave automatic calculation channel calculation , MT5 Local Trading copying Easy And Fast Copy , MT4 Easy And Fast Copy , MT5 Local Trading copying For DEMO Easy And Fast Copy , MT4 DEMO Easy And Fast Copy , MT5 DEMO 高度なボリンジャーバンド:
1.ボリンジャーレールは方向によって色が変わります」
2.ボリンジャーアウターレールの伸縮はアウターレールの色の変化でマークされます。」 3.ボリンジャーミ
FREE
Advanced Market Analysis Tool. Full Documentation: Download Free Professional Education Course: After purchasing, contact me to receive access to the complete CDV Professional Training Video Course. — It will help you master CDV , Aggressive Buyer & Seller dynamics , and Volume Microstructure concepts through a clear, step-by-step learning process. Overview The Professional CDV with Aggressive Score is a comprehensive volume analysis tool that combines visual Cumulative Delta Volume (CDV)

Hello everyone! Talented Investors I'm not very good at English, so I used Google Translate. Please bear with me :) There's no need to say much about the capabilities of the BOT. Try it out to make the most informed decision. Some information you need to pay attention to: 1. The BOT will automatically trade based on your adjustments. Avoid trading during periods of high volatility such as: New York market open, CPI, NFP, FOMC news. 2. Recommended for use on M5 - M15 timeframes. 3. Minimum trade
FREE

A lot of professional traders use high quality divergence signals as a part of their strategy to enter a position. Spotting correct divergences quickly can often be hard, especially if your eye isn’t trained for it yet. For this reason we’ve created a series of easy to use professional oscillator divergence indicators that are very customisable so you get only the signals you want to trade. We have this divergence indicator for RSI, MACD, Stochastics, CCI and OBV. RSI: https://www.mql5.com/en/

This indicator is designed to automate the process of identifying and visualizing market structure, a cornerstone of price action and Smart Money Concepts (SMC) trading. It intelligently maps the flow of the market by plotting Higher Highs (HH), Higher Lows (HL), Lower Highs (LH), and Lower Lows (LL) directly on your chart. How It Works The indicator's logic is based on detecting pivot swing points using a configurable number of bars to the left and right of a candle. It then uses these pivots t
FREE

はじめに
Wabi Sabi は、低時間枠と高時間枠の両方で機能するエキスパート アドバイザーです。分析時間枠が短い場合は HFT ボットのように動作し、分析時間枠が長い場合はトレード頻度が大幅に減少します。
インジケーター
トレードを開始するために 2 つのインジケーターを使用します。これらは相対力指数 (RSI) とボリンジャー バンドです。ボリンジャー バンドの上限と下限の両方で価格の引き戻しをターゲットにします。また、大きな価格変動の後と最中の価格の引き戻しもターゲットにします。
資金管理
このエキスパートの資金管理は、マーチンゲールとヘッジに基づいています。ヘッジは、特定の期間のドローダウンを減らすために使用され、マーチンゲールはトレードを開始するために使用されます。
推奨設定 推奨時間枠は設定によって異なりますが、適切な設定で M5、M15、その他のすべての時間枠を使用できます。 エキスパートは EURUSD、GBPUSD、AUDUSD、USDCAD で取引できますが、適切な設定をすれば他の通貨でも取引できます。 ECN ブローカーは常に推奨されます 低レイテ
FREE

フェニックス・キャンドル・タイマー・パネル (MT5)
MetaTrader 5 向けリアルタイムキャンドルカウントダウンタイマー。現在のローソク足における正確な残り時間を表示し、執行タイミングとトレード規律の向上を支援します。
目的
正確なローソク足タイミングは、裁定取引者やアルゴリズム戦略にとって極めて重要です。ローソク足内で早すぎたり遅すぎたりしたエントリーは、リスク、スプレッドエクスポージャー、シグナルの有効性に影響を与える可能性があります。
フェニックス キャンドルタイマーパネルは、ブローカーサーバー時間に同期した明確なカウントダウン表示を提供します。タイマーはチャートの時間枠変更に自動的に適応し、リアルタイムで更新されるため、推測作業を排除し、全時間枠にわたる執行精度を向上させます。
インストール
MQL5マーケットからダウンロードし、任意のチャートにアタッチしてください。タイマーパネルは即時表示され、設定は不要です。
動作環境
MetaTrader 5 ビルド3280以降。チャート上で実行する必要があるエキスパートアドバイザーです。ブローカーサーバー時間を
FREE

If you have the opportunity to read the book " Trend Trading - A Seven-Step Approach to success " by Daryl Guppy, you will have a great deal of information about how to "read" the market. In his book Daryl show, among other things, how can we use a visual tool to measure the volatility and trend between Long and Short-term periods: The GMMA - Guppy Multiple Moving Averages .
Instead of using his original idea of having 12 Exponential Moving Averages in your chart - which could be very CPU-deman
FREE
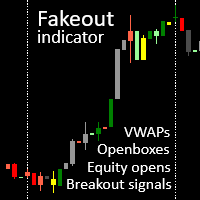
akeout candle indicator with session VWAPs, openboxes and openbox breakout signals. Check out our other products for fxer.net:
https://www.mql5.com/en/market/product/114888
https://www.mql5.com/en/market/product/114890 Main features 1. VWAPS for Tokyo, London and NY sessions 2. Openboxes for Tokyo, London and NY sessions 3. Colored candles for breakouts, fakeouts and inside candles 4. Equity open line 5. Openbox expansions 6. Unmitigated equity open prices for Tokyo, London and NY sessions 7
FREE
MetaTraderマーケットは自動売買ロボットとテクニカル指標を販売するための最もいい場所です。
魅力的なデザインと説明を備えたMetaTraderプラットフォーム用アプリを開発するだけでいいのです。マーケットでプロダクトをパブリッシュして何百万ものMetaTraderユーザーに提供する方法をご覧ください。
取引の機会を逃しています。
- 無料取引アプリ
- 8千を超えるシグナルをコピー
- 金融ニュースで金融マーケットを探索
新規登録
ログイン