Previous day week high low Mt5
- インディケータ
- バージョン: 1.0
- アクティベーション: 5

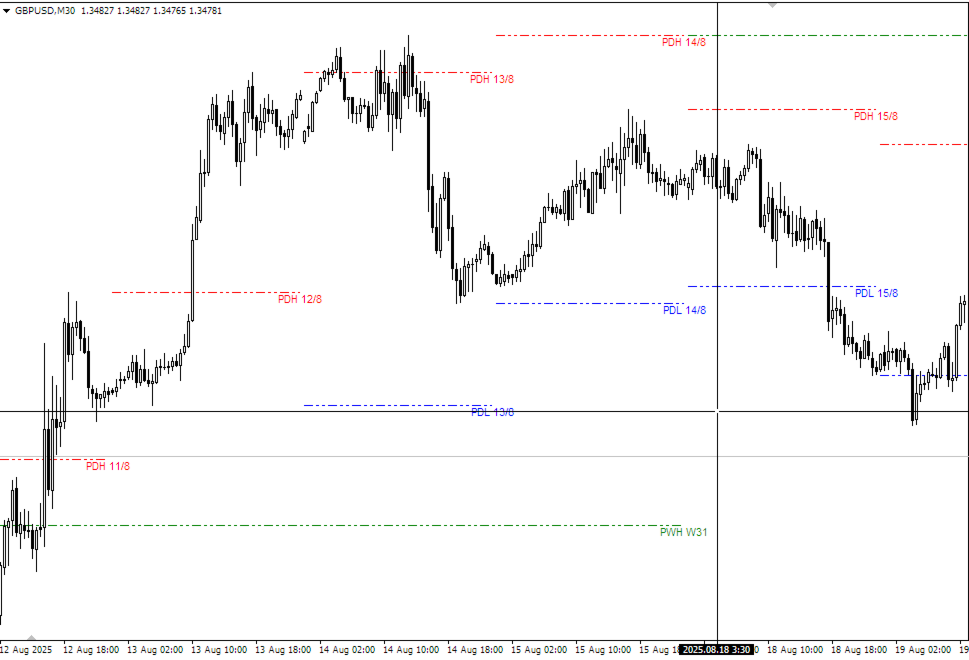
Its an indicator that will show you
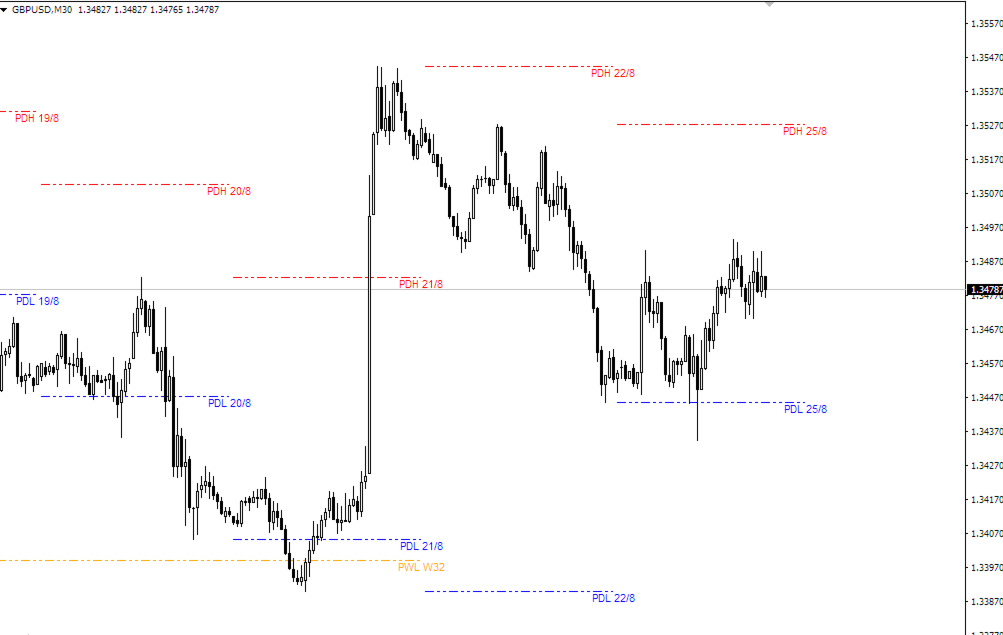
- Previous day high
- Previous day low
- Previous week high
- Previous week low
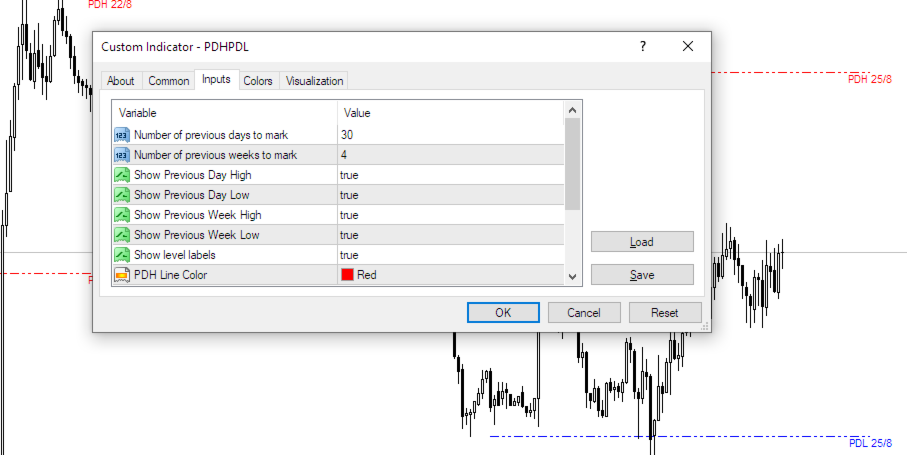
You can set how many days of history you would like to see for previous day high low and previous week high low
- Currently 30 days of PDH/L will be marked
- 4 weeks of PWH/L will be marked
- You can change it from indicator settings.
- Dates are shown at marking lines to identify which date does that marking belongs to.
Thank you :) Always open to feedback and criticism if it helps me provide you more value.
- Rahul
My other indicators you may like
[I have been trading forex for last 6 years and i publish every indicator that i build for my personal use so everyone can benefit]