适用于MetaTrader 5的EA交易和指标 - 31
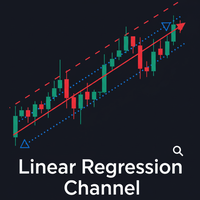
The Linear Regression Channel is a powerful technical analysis tool that helps visually identify the prevailing trend and potential price zones. Essentially, the indicator performs two main functions: It draws a trendline through the center of price action over a specified period. This line is calculated using the linear regression method, which results in the best possible "line of best fit" for the price data. From this center line, the indicator plots two parallel lines above and below, creat
FREE

Another request from my brotherhood was putting the name of the Symbol being seen - a little bigger - on the Chart, just to get sure that they are seeing the correct one... Mistakes pay a high price on the market... It is a very effective, and almost resource-null-consuming indicator that displays the current Symbol Name and Timeframe in almost any position of your Chart, with any color, and any Font Size... And also you can change the divisor character that is presented between the Symbol Name
FREE
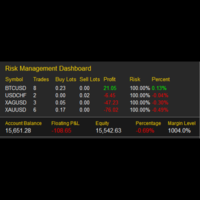
My Risk Management The Risk Management Dashboard is a visual tool designed to help traders monitor risk exposure in real time. With a clear and compact layout, it provides an instant overview of trading activity, enabling more disciplined and informed decision-making. Key Features Active Symbol Summary
Displays all traded symbols with the number of trades, total buy/sell lots, and current profit/loss. Per-Symbol Risk Analysis
Calculates and shows the risk percentage of each symbol relative to
FREE

Closing Price Reversal is a very well known and traded candlestick pattern. This little indicator paints with specific (user-selected) colors the Closing Price Reveral Up and Down patterns, as well as the Inside Bars (as a bonus). Higher timeframes are more effective as with all other candlesticks patterns. Do NOT trade solely on this indicator. Search the web for "Closing Price Reversal" to learn about the several approaches that can be used with this pattern. One of them is combining short/me
FREE

每天提取您的利润! 核心理念
Gold Deposit Accelerator 是一款高精度剥头皮EA,旨在捕捉每一次 $1(100点)波动。
如果错过,它会耐心等待价格回到同一水平。
完全基于纯技术分析,不依赖新闻或基本面,仅分析价格行为。 技术分析足以捕捉 $1 的波动,而此EA执行速度比人类更快、更精准。 为什么是现在
在2024–2025年期间,XAUUSD 的波动性达到了历史高点,创造了巨大的交易机会。
此EA专为这种高波动市场结构而设计,能够以外科手术般的精度快速响应。 性能
两年历史回测:稳定增长且回撤可控。
目前正在运行的实盘信号: 点击查看
每天开仓并快速平仓,
让您可以 每日提取利润 独特之处 它不是传统EA,而是一个 资金加速系统 。 可完全自定义的网格策略:
— 固定手数或
— 马丁倍数。
手数与篮子深度由您决定。
兼容任何经纪商 — 只需调整 TP 与 Step。 立即尝试
趁价格仍低立即购买,
在模拟或 USC 实盘账户上测试,
亲眼见证结果。
每售出一份价格将上涨 $25。
租赁仅限于 11 月底之前! 作者说明
我是 Turan

用于 MetaTrader 5 的 Ilan 由于使用虚拟交易,同时并发双向交易 (买与卖) 成为可能。 这样,允许用户在 MetaTrader 5 的单向持仓规则下,采用流行策略。
EA 设置 该 EA 的设置很简单。不过,策略的所有重要设置均可调整。可用工具: 单一 MagicNumber 用于识别交易; 交易方向选项 ( Trade direction ): 仅买入, 仅卖出或者并发双向; 开仓步长 ( Step ) 和盈利距离 ( TakeProfit ) 可自动适应 4 或 5-位的报价; 起始手数 ( Start lot ) 和增量系数 ( Lot coefficient ) 用来指定本金使用大小; 最后, 交易数量限制 ( Max trades in one direction ) 和最终一系列交易的止损 ( Max loss of last trade ) 用于风险管理。
您可以根据需要在单一账户里使用多个 Ilan EA (即便是单一金融品种)。它们之中的每一个都仅处理自己的虚拟交易,不会与其它实例交互。手工交易加上 EA - 这不会影响交易策略。即使有

This MQL5 indicator draws four Exponential Moving Averages (EMAs) — 21, 50, 100, and 200 — directly on the chart window.
The EMA 21 is displayed as a color-changing line , while EMA 50, 100, and 200 are standard single-color lines.
The color of EMA 21 changes dynamically based on price position.
When the closing price is above EMA 21 , the line turns blue , indicating bullish pressure.
When the closing price is below EMA 21 , the line turns yellow , indicating bearish pressure.
If the price equa
FREE
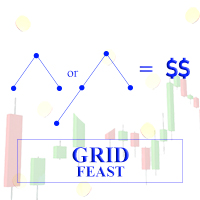
交易者們,你們好!很久以前,當我在 YouTube 上進行流覽時,我看到了 Expert4x 的一個強大的網格策略。作為一個熱衷於外匯交易和 MQL4/5 的程序員,我根據這個策略開發了一個專家顧問,從那時起我就一直在使用這個 EA。作為我對交易社區的貢獻之一,我在此向大家提供此 EA。請觀賞下面的視頻,其中對策略進行了解釋。
MT4 version: https://www.mql5.com/en/market/product/145867
推薦 該策略/EA 僅適用於有波動的交易對。我個人在 EURCHF 和 AUDNZD 上使用該 EA。我希望您也能找到有用的 EA
交易風險警告! 1. 金融市場交易涉及重大風險,可能不適合所有人。請務必瞭解您可能會損失部分或全部投資資本。
2. 請從模擬帳戶開始使用本專案。只有在您完全瞭解使用 EA 和一般交易的策略和風險後,才能轉移到真實帳戶。
交易愉快
FREE
Optimized Trend Tracker (OTT) Indicator The Optimized Trend Tracker (OTT) is a custom indicator designed to visualize trend direction and potential changes based on a configurable moving average and dynamic support/resistance levels. It provides multiple visualization and signal options, making it suitable for discretionary analysis or integration into automated systems. Key Features Configurable Moving Average Types
Supports SMA, EMA, WMA, TMA, VAR, WWMA, ZLEMA, and TSF for flexible calculatio
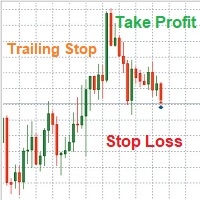
Note: All inputs of this EA are designed in Arabic for easier configuration and management
Auto Smart Trade Manager EA Ar automatically manages trades on MetaTrader 5. Sets Stop Loss (SL) and Take Profit (TP) , supports Trailing Stop to secure profits, and includes Equity Protection . Smart management for all trades or by Magic Number and symbol, with full control over slippage and risk. Trading involves high risk and you may lose part or all of your capital. Use this EA cau
FREE
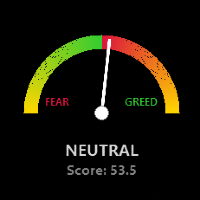
Global Market Risk Sentiment Meter 1. Abstraction The Global Market Risk Sentiment Meter is a sophisticated analytical tool designed for the MetaTrader 5 (MQL5) platform. Unlike traditional indicators that analyze a single asset in isolation, this utility employs an Inter-Market Analysis approach to reconstruct the psychological state of the global financial markets. By aggregating real-time data from US Indices, Global Equities, Cryptocurrencies, and Safe Haven assets (Gold and the US
FREE

This is just a MACD with multi symbols, multi timeframes, and multi colors. features. different symbols and timeframes from the main chart. draw main line, signal line, and histogram. each line can be erased. the ascent and descent can be distinguished. Due to the above features, this MACD is suitable for multiple lineups in a single chart. This can be used in the same way as MiniCandles.
FREE
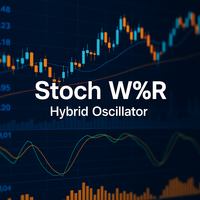
StochW%R 动量震荡指标 – 您的智能混合动量指标 精准。降噪。更可靠。 厌倦了在波动市场中产生虚假信号的传统震荡指标? StochW%R 动量震荡指标 是分析动量领域的演进,它将**随机指标 (Stochastic) 和 威廉指标 (%R)**的优点集于一身,成为一个强大且可自定义的指标。 核心优势: 凭借其智能融合算法,它能 减少市场噪音 并提供 更清晰的信号 ,同时提前预警趋势变化。 为什么这个指标更优越? 两种震荡指标的智能融合 随机指标(平滑化): 在识别超买/超卖条件时,对噪音的敏感度较低。 威廉指标(反向和调整): 对价格的剧烈波动反应更灵敏。 结果: 一条 更精确的动量线 ,能够过滤虚假信号并提高可靠性。 用于完美时机的信号线 与 信号线 (StochW%R 的移动平均线)的交叉有助于: 在价格到达极端区域之前 预测反转 。 确认动量变化 ,且滞后性小于传统震荡指标。 完全自定义 通过**“Stoch Weight” 参数,您可以调整 灵敏度和平滑度之间的平衡**: > 0.5: 受随机指标影响更大(适用于横盘市场)。 < 0.5: 受威廉指标影响更大(非常适合强
FREE

RUHM GOLD (TF M1)
## Test on XAU/GOLD | RAW Account (not suitable for microcent accounts), Adjust spread and level, minimum equity limit $100 ## Adjust the parameters according to your Trading Style, to get the estimated value of the strategy calculation. ## You must provide feedback in the comments column, regarding the trials you have conducted.
This Expert Advisor (EA) is provided FREE OF CHARGE for testing and educational purposes only .
It is NOT recommended for use on live (real) t
FREE

Highly configurable Stochastic indicator.
Features: Highly customizable alert functions (at levels, crosses, direction changes via email, push, sound, popup) Multi timeframe ability Color customization (at levels, crosses, direction changes) Linear interpolation and histogram mode options Works on strategy tester in multi timeframe mode (at weekend without ticks also) Adjustable Levels Parameters:
Stochastic Timeframe: You can set the lower/higher timeframes for Stochastic. Stochastic Bar S
FREE

Introducing the "Automated Stop Loss Placement" Script for MetaTrader 5 The "Automated Stop Loss Placement" script is a powerful tool designed to streamline your trading experience within the MetaTrader 5 platform. By automating the placement of stop loss orders, this script offers efficiency and convenience for traders of all levels. Key Features: Seamless Automation: Stop loss orders are placed automatically, moments after trade execution, saving you time and effort while ensuring consistent r
FREE

This indicator was created as an MT5 version inspired by a TMA RSI Divergence indicator found on TradingView.
This indicator detects both Regular and Hidden divergences using RSI pivot points, similar to TradingView's pivot-based divergence logic.
-------------------------------------------------- Features -------------------------------------------------- • Regular Bullish / Bearish divergence • Hidden Bullish / Bearish divergence • Pivot-based detection (Left / Right bars) • Optional RSI SM
FREE
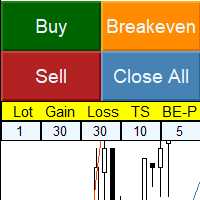
Simple panel with Stop loss (Loss), Stop gain (Gain) , Trailing stop (TS) and Breakeven (BE-P).
Lot is the number of contracts to be traded.
Gain is the number, in points, that the stop gain will be positioned. If you don't want to put stop gain, just put 0 (zero) in place and when you open the order it won't have this stop.
Loss is the number, in points, that the stop loss will be placed. If you don't want to put stop loss, just put 0 (zero) in place and when you open the order it won't ha
FREE
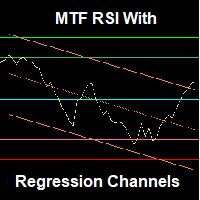
An advanced RSI indicator that displays dynamic linear regression channels in both the indicator window and the price chart, with predefined horizontal levels to detect overbought and oversold zones. Main Features (Summary): Synchronized linear regression channels on both price and RSI Multi–timeframe support Smart and ready-to-use horizontal levels Professional design with optimized performance Feedback & Support We value your experience! If you have any questions, suggestions, or encounter any
FREE

海肯阿什MT5指标 提升您的交易分析能力,使用海肯阿什MT5指标。 这款强大的工具将标准价格数据转化为更平滑、 趋势化的烛形图, 让您更轻松地识别市场趋势和潜在的逆转点。 主要特点: 清晰的趋势识别: 通过不同的烛身颜色, 直观区分上升和下降趋势。 降低噪音: 过滤价格波动, 更清晰地呈现市场主要走势。 提前发现趋势: 在标准图表上显示趋势变化之前, 提前预测潜在趋势变化。 多功能应用: 可独立使用或与其他技术指标结合进行综合分析。 自定义设置: 根据您的具体交易偏好和策略调整指标。 优势: 提高您识别趋势和潜在进出场点的能力。 减少市场噪音的影响, 专注于重要的价格变动。 基于对市场动态的更清晰理解, 做出更明智的交易决策。 利用经过验证的技术分析工具, 获得竞争优势。 适合人群: 希望提升技术分析能力的各级交易者。 偏好更平滑、 趋势导向的市场视图的交易者。 寻求工具来补充现有交易策略的交易者。 解锁海肯阿什MT5指标的潜力,将您的交易提升到新的水平! 注意: 为了更有效地推广产品, 建议添加有关可使用该指标的具体策略的信息, 并提供带有使用示例的图表截图。 您是否希望添加更多关
FREE

If you love this indicator, please leave a positive rating and comment, it will be a source of motivation to help me create more products <3 Key Takeaways The Zig Zag Advanced indicator plot points on a chart whenever prices reverse by the percentage the trader sets in the input section. The Zig Zag Advanced indicator lowers the impact of random price fluctuations and is used to identify trends and changes in trends. The indicator lowers noise levels, highlighting trends higher and lower. Th
FREE

凤凰蜡烛计时面板(MT5)
专为MetaTrader 5设计的实时蜡烛倒计时工具。精准显示当前蜡烛剩余时间,助您优化交易时机把握与纪律执行。
功能定位
精准的K线计时对人工交易者和算法策略至关重要。在K线内过早或过晚入场将影响风险控制、点差暴露及信号有效性。
凤凰K线计时面板提供与经纪商服务器时间同步的清晰倒计时视图。计时器可自动适应图表周期变更并实时更新,消除主观臆测,提升所有周期内的执行精度。
安装
从MQL5市场下载后附加至任意图表,计时面板即刻显示且无需配置。
系统要求
MetaTrader 5 3280版或更高版本。本工具为专家顾问,需运行于图表上。采用经纪商服务器时间,支持所有交易品种及时间周期。
反馈与评价
若您认为本工具实用,敬请在MQL5平台给予五星好评。您的反馈将直接影响凤凰团队的后续更新、优化及新工具开发——我们致力于打造交易者真正重视的功能。
技术支持
通过MQL5私信提供终身支持,24小时内响应。
开发方:凤凰环球投资有限公司 2025 凤凰环球投资有限公司。保留所有权利。
FREE

BeST_Hull MAs Directional Strategy is a Metatrader Indicator based on the corresponding Hull Moving Average.It timely locates the most likely points for Entering the Market as well as the most suitable Exit points and can be used either as a standalone Trading System or as an add-on to any Trading System for finding/confirming the most appropriate Entry or Exit points. This indicator does use only the directional slope and its turning points of Hull MAs to locate the Entry/Exit points while it

Fimathe Indicator The Fimathe Indicator is a tool for MetaTrader 5 designed to help traders identify support, resistance, neutral zones, and price channels. It features an interactive interface for drawing and managing support and resistance levels, generating take-profit channels and neutral zones, and providing visual and sound alerts for breakouts. Key Features Support and Resistance Lines: Dynamic and draggable lines to identify key levels. Reference Channel: Creates a channel between su
FREE

Recommended Broker >>> https://tickmill.link/3Y1QeAK 
Check comments or my Bio for the roper & recommended settings
ADVANCED ORB Retest EA v4.3 - Advanced Recovery System LAUNCH PRICE: $299 | Increases 50% Every 5 Sales - Get Yours Now! Smart Trading System with Intelligent Protection Professional M30/H1 Opening Range Breakout strategy equipped with #SmartRecovery and #AutoRecoverySystem that doubles lot size on SL hits until profit is achieved - designed to rec

该指标使用多个时间框架来分析繁荣 1000 中的最佳买入入场点。它专为帮助仅在繁荣高峰时进行交易而量身定制。该指示器有两个箭头;红色和蓝色的。红色箭头的形成表明您应该准备好迎接蓝色箭头,这是买入入场信号。该指标不提供退出点。始终收集 3 点,即如果您以 10230.200 进入交易,您可以在 10260.200 退出,止损为 1 点,即 10220.200。如果您遵守该规则并保持纪律,该指标可能会对您的交易有所帮助。
为什么需要该指标?
- 它分析市场并以通知的形式向您的手机、平板电脑或计算机发送实时信号。
-您在等待下一个通知时收到信号通知、进行交易并做其他事情。
有什么要求?
-您需要一个 vps 来托管实时信号通知指示器
-您需要将信号通知从您的 vps 上的交易终端推送到您的手机或平板电脑
如何在 VPS 上安装
在您的 vps 上安装 meta trader 5 并将指标附加到您的终端上。输入您的 mql5 ID,将信号通知推送到您选择的设备。
FREE

"Tired of watching the charts 24/7? Missing profits because of poor risk management? Losing trades when you could’ve secured a win?" This is the ultimate automated assistant that protects your gains and limits your risks, and gives you time to focus on other important things. Key Features Break-Even Plus – Locks in your gains and moves your stop-loss automatically. Automatic Stop-Loss & TP – No more emotional trading, just smart execution. Trailing Stop – Ride the trend

Indicator to create and manage your own watchlists. It allows you to load one symbol to multiple charts with just one click.
There is an addon to save objects from drawings (lines, fibos etc.) and load when the symbol is changed.
Functions
Supports Multi-Timeframe-Usage
Load one symbols to multiple charts with just one click
Automatically created list with all tradeable symbols
Custom watchlists can be created
Symbols can be added and deleted from the created watchlists
Sortfunction to sort a

Crystal Copycat ULTIMATE v4.00 – 专业 MT5 交易复制工具 概述
Crystal Copycat ULTIMATE v4.00 是一款高性能 MetaTrader 5 交易复制器,可 实现不同账户与经纪商之间的超高速、可靠复制。系统通过 MT5 本地公共文件 夹运行,无需 DLL 或 API ,适合 VPS 与多 账户环境。 核心功能 双模式 : MASTER: 广播 订单、修改与关闭。 SLAVE: 即 时执行并带风险控制。 智能 仓位缩放 :固定手数、 资金比例、基于风险百分比。 风险管理 :最大回撤保 护、资金监控、单笔风险控制、基于 SL 的 计算。 订单覆盖 :市价、挂 单、修改、删除、 CLOSE_ALL 。 符号映射 :自 动 / 手 动支持(如 XAUUSD=XAUUSD.r )。 文件通信 :基于本地文件 夹,无需 DLL 和 API 。 可 视化面板 : 实时显示交易状态、风险、错误。 应用场景 多 终端复制交易。 Prop Firm 账户管理。 信号提供。 多 经纪商环境。 亮点 支持跨 经纪商复制。 支持市价与挂 单。 兼容
FREE

该指标仅显示布林格风格波动通道的上轨和下轨,不绘制中央移动平均线。其主要目标是提供一个干净且灵活的波动包络,使交易者能够专注于价格相对于通道边界的行为,同时完全掌控图表的视觉风格和结构。 与传统布林带不同,传统布林带始终显示中间的移动平均线,而本指标仅在内部计算中使用移动平均线。中央线被刻意隐藏,以减少视觉干扰,并允许用户在需要时单独管理中线。 上下轨可以分别设置独立的颜色,从而实现更清晰的视觉区分,并更好地适应不同的图表主题或个人偏好。希望使用传统布林带外观的交易者,可以添加一个具有相同参数的独立移动平均指标。通过匹配周期和价格来源,用户可以有效地重建标准布林带结构,同时完全控制中线的颜色和样式。 在当前阶段,该指标有意限制为基于收盘价计算的简单移动平均线(SMA)。这一设计选择确保了计算的透明性、一致性和性能稳定性。如果用户需求足够,未来版本可能会考虑支持其他类型的移动平均线(如 EMA、WMA 等)。 主要特性: 仅显示上下波动带
不绘制中线(仅用于计算)
上下轨支持独立颜色设置
使用基于收盘价的简单移动平均线(SMA)
干净、简约的图表外观
周期和偏差参数完全可配置
兼容所有交
FREE

凤凰ATR波动率计(MT5)
专为MetaTrader 5设计的实时波动率监测工具。运用平均真实波动范围(ATR)技术,在图表上直观呈现当前市场波动强度。
功能定位
市场波动率直接影响止损设置、仓位管理、滑点控制及策略执行效果。忽视波动率的交易往往导致:在快速市场中承担过度风险,或在平静行情中错失良机。
凤凰ATR波动率计基于当前图表数据计算ATR值,并在图表上清晰显示数值。该指标实时更新,可自动适配交易品种与时间周期变化,帮助交易者判断市场处于平静、活跃或高波动状态。
安装说明
从MQL5市场下载后附加至任意图表,指标将立即显示且无需配置。
系统要求
MetaTrader 5 3280版或更高版本。本指标为自定义指标,采用ATR衡量波动性,兼容所有经纪商及交易品种。ATR数值随所选时间周期变化。
反馈与评价
若您认为本工具实用,敬请在MQL5平台给予五星好评。您的反馈将直接影响凤凰团队的后续更新、优化及新工具开发——我们致力于打造交易者真正重视的功能。
技术支持
通过MQL5私信提供终身支持,24小时内响应。
开发方:凤凰环球投资有限公司 2025 凤凰
FREE

This is a conventional volume indicator, which displays the ticks or real volume (if available from your broker). But it has others features like: 5 color schemes: single, when crossing with moving average, when crossing a specific level, when having different volume between bars and when candle change color. Being hable to have a customizable moving average. Being hable to have a value indicator line. Many thanks to Diego Silvestrin for the ideas to version 1.1 and Konstantin Demidov for
FREE

The Inside Bar pattern is a very well known candlestick formation used widely by traders all over the world and in any marketplace. This approach is very simple and adds a little confirmation candle, so it adds a third past candlestick to the count to confirm the direction of the move (upward or downward). Obviously, there is no power on this candlestick formation if the trader has no context on what it is happening on the market he/she is operating, so this is not magic, this "radar" is only a
FREE

MetaTrader 5 上可定制化的期间分隔线 内置的期间分隔线功能不允许用户指定时间间隔,所以你可以使用这个指标来创建可定制的期间分隔线。
在日内图表上,你可以在特定的时间放置期间分隔线,你也可以选择在周一的特定时间放置额外的分隔线,以标记一周的开始。
在其他时间周期图表上,该指标的功能与内置的期间分隔线相同。
在日线图上,期间分隔线被放置在每个月的开始日。
在周线图和月线图上,期间分隔线被放置在每年的起始日。
输入 Period Separator Settings hour of the separator minute of the separator Weekly Separator Settings hour of the separator minute of the separator MT4 版本: https://www.mql5.com/en/market/product/91676
FREE

This EA is a flexible and powerful metatrader expert advisor that trades using the MACD indicator and implements many useful features. It can trade using the MACD indicator alone, or donchian breakouts confirmed by the MACD indicator from any timeframe. Additionally, it offers a martingale feature and forex session filters. [ Installation Guide | Update Guide | Troubleshooting | FAQ | All Products ] Easy to use and supervise Fully configurable settings Customizable break-even, SL, TP and traili
FREE

MSync EA Pro is a fully automated trading system engineered to synchronize multiple trading signals, market trends, and timeframes — delivering precise, intelligent, and consistent trade execution. Designed for traders who value flexibility, stability, and smart automation, this EA adapts dynamically to changing market conditions across forex, metals, indices, and crypto pairs. Core Concept The name “MSync” stands for Market Synchronization , symbolizing the EA’s ability to align technical confi
FREE
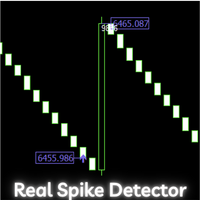
Boom and Crash Range Detector: Your Secret Weapon for Trading Spikes! Introducing the Boom and Crash Range Detector , a powerful tool designed to revolutionize your trading experience. Developed using a strategy composed and optimized with the help of a machine learning model, the system is built on vast amounts of historical data that have been analyzed to perfection. The result? A highly accurate system that identifies where those lucrative spikes are likely to occur. Here’s why this needs to

Trend Magic Indicator for MT5
To download All Of Our Products , you can click this link: LINK Are you interested in the Wei Wave Indicator Volume : LINK
Are you interested in the Chandelier Indicator : LINK Are you interested in the Wave Trend Oscillator : LINK Are you interested in the Support & Resistance Indicator : LINK Are you interested in the Alpha Trend Indicator : LINK Are you interested in the NRTR Indicator : LINK
Introduction The Trend Magic Indicator is a smart tool that blends

EMA Crossover EA ATR Final
Automated Expert Advisor for MetaTrader 5 – EMA Crossover • RSI Filter • ATR-Based SL/TP • Trailing Stop • LINE Notify Product Overview EMA Crossover EA ATR Final is a turnkey Expert Advisor engineered to trade Forex pairs and Gold (XAUUSD) on MT5. It generates entry signals when a fast EMA crosses a slow EMA, confirms them with RSI, and automatically sets Stop Loss and Take Profit levels based on ATR. A built-in trailing stop locks in profits, and all trade execution
FREE

Unlock the power of automated trading with the Fully Automated Fibonacci Retracement EA for MetaTrader 5. This Expert Advisor dynamically identifies Fibonacci retracement levels and places trades based on candle formations—completely hands-free. Designed to simplify your trading process, it ensures accurate and timely execution without the need for constant monitoring. Key Features: Automated Trade Execution : The EA automatically analyzes Fibonacci retracement levels and enters trades based on

Cybertrade Agile and Flexible - MT5 (Your strategy in any market)
https://emanuelandriato.github.io/cybertrade/ Flexible EA regarding parameterization, where the trader can configure his own setup, risk management and trading plan. Our EA is an advanced, high quality solution, always developed with attention focused on performance and flexibility of use and also always attentive to the need of traders to work in different ways. With the diversity of indicators and parameters available, it is p

This indicator calculates the volume profile and places labels that correspond to the VAH, VAL and POC levels, for each candle individually.
Indicator operation features The indicator works on the timeframes from M3 to MN, but it uses the history data of smaller periods: M1 - for periods from M3 to H1, M5 - for periods from H2 to H12, M30 - for the D1 period, H4 - for the W1 period, D1 - for the MN period. The color and location of the VAL, VAH and POC labels on the current candle are considere
FREE

考拉价格行为扫描仪 - 发掘价格行为的力量 **介绍:**发现全新的考拉价格行为扫描仪 - 一款多功能、多货币、多时间框架的工具,旨在检测基本价格行为模式,并在直观的扫描表中呈现。 **摘要:**该指标超越寻常,为用户提供在多个货币和时间框架上识别关键价格行为模式的能力。 特点: 吞没模式(Engulf Pattern) 锤子模式(PinBar Pattern) 十字模式(Doji Pattern) 可定制设置: 吞没模式: 第2根蜡烛的最小实体大小:定义第2根已关闭蜡烛的最小实体大小(即第2根已关闭蜡烛)。 第1根蜡烛的最小实体大小:设定最近已关闭蜡烛的最小实体大小。 锤子模式: 最大实体百分比:通过此参数,您可以调整锤子实体的最大百分比,相对于影线的大小。 十字模式: 最大较小实体大小:用户可以通过此参数调整最大实体大小。在纯粹的十字模式中,实体大小必须为0,但用户可能想以最大10点的大小查看模式。 符号设置: 输入最多10个符号名称,符号名称必须与市场观察符号字符相匹配。用户可以使用“最大符号”参数控制这些符号中的出现数量。 时间框架设置: 切换M1至MN时间框架,启用或禁用每个
FREE

TrendSeeker FX —— 会话型趋势交易专家(MT5) TrendSeeker FX 是一款专业的 MetaTrader 5 外汇交易专家(EA),专为在 高流动性时段 捕捉 高质量趋势行情 而设计。 该 EA 采用 风险优先的系统架构 ,仅在市场结构、波动性与风险条件同时满足时才会运行。 本系统 不适合 24/5 全天候运行 。 重要使用说明 TrendSeeker FX 是一款 基于交易时段(Session)的 EA 。 在低流动性或非推荐时段运行可能会: 降低交易表现 增加回撤 降低信号质量 最佳效果来自于 仅在主要市场开盘阶段 运行,此时流动性扩张最明显。 交易次数说明(正常行为) 用户可能会发现每天或每个交易时段的交易次数较少。 这是 系统设计行为 ,并非错误。 TrendSeeker FX 内置 交易次数上限 ,用于: 防止过度交易 控制高波动环境下的风险 保持资金稳定性 达到上限后,EA 将停止开仓,直到下一个合规交易时段。 策略概述 TrendSeeker FX 是一款 趋势跟随型外汇 EA ,仅在 高质量市场环境 下运行。 设计目标包
FREE

交易实用必备工具指标 波浪自动计算指标,通道趋势交易 完美的趋势-波浪自动计算通道计算 , MT4版本 完美的趋势-波浪自动计算通道计算 , MT5版本 本地跟单复制交易 Easy And Fast Copy , MT4版本 Easy And Fast Copy , MT5版本 本地跟单复制交易 模拟试用 Easy And Fast Copy , MT4 模拟账号运行 Easy And Fast Copy , MT5 模拟账号运行 MACD称为异同移动平均线,是从双指数移动平均线发展而来的 ,由快的指数移动平均线(EMA12)减去慢的指数移动平均线(EMA26)得到快线DIF,再用2×(快线DIF-DIF的9日加权移动均线DEA)得到MACD柱。MACD的意义和双移动平均线基本相同,即由快、慢均线的离散、聚合表征当前的多空状态和股价可能的发展变化趋势,但阅读起来更方便。MACD的变化代表着市场趋势的变化,不同K线级别的MACD代表当前级别周期中的 买卖趋势。
1.本指标增加MACD的双线显示, 2.并且对能量柱进行4色不同的渐变! 强烈推荐趋势指标, 波浪的标准自动计算 和
FREE

Aussi Kiwi MT5 trades the classic trio of AUDCAD, AUDNZD, and NZDCAD on one chart, like other Expert Advisors on the MQL5 market. The basic strategy differs little from these and is based on a combination of indicators such as Moving Average, Standard Deviation, RSI, and ATR. However, the key difference with AussiKiwi MT5 is its sophisticated correlation technology, which determines which pair to place next and with what volume, depending on the currently open pair(s). No AI algorithms are used,
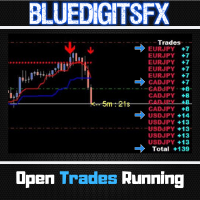
Free Utility Tool by BlueDigitsFx
Designed to improve workflow and trade management
Also available for MetaTrader 4
Optional access to updates & support via the BlueDigitsFx Telegram Assistant Bot BlueDigitsFx Open Trades is a powerful MT5 tool that displays your total pips from all open trades in real time.
Its intuitive color-coded interface quickly indicates winning and losing trades across all currency pairs.
This helps you monitor your trade performance effortlessly, enabling faster d
FREE

HedgeGrid Pro is an automated trading system designed for traders who want to use hedging techniques combined with structured pending order placement. The EA focuses on flexible market entry, controlled exposure, and adaptive order positioning without the need for constant manual monitoring. The system supports both directional trading and balanced hedging approaches, making it suitable for a wide range of market conditions. Core Features Hedging Support
The EA allows opening trades in both dir
FREE

介绍 Golden Rabbit Pro :您的终极黄金交易智能交易系统 (EA)
您是否正在寻找一个可靠的黄金交易智能交易系统 (EA)?Golden Rabbit Pro 正是您需要的!这个独特的 EA 采用了7种真实的交易策略,与众不同。
仅剩10个名额,售价 270$ -> 下一价格: 499$ -> 最终价格: 1299$
实时结果: 链接在个人简介中 我们的策略 :
Golden Rabbit Pro 基于简单但非常有效的方法。它使用日线支撑位和阻力位,并在日线图、四小时图和小时图上分析这些水平,通过其8种专业策略执行交易。我们对黄金的波动有深入的理解,精心设计了策略以驾驭市场的起伏。
风险管理和利润最大化 :
Golden Rabbit Pro 执行的每笔交易都从一开始就设置了明确的止盈 (TP) 和止损 (SL) 水平。不仅如此,我们的 EA 还采用了动态追踪止损 (Trailing SL) 来最大程度地降低风险,同时在市场有利时最大化利润。
信任与透明: Golden Rabbit Pro 集成了八种策略,以实现可持续的增长曲线。尽

Descrição do produto
Este Expert Advisor (EA) foi desenvolvido para a plataforma MetaTrader 5, especificamente para operar no par de moedas XAU/USD (Ouro) no timeframe M15. Ele utiliza uma combinação de 15 indicadores técnicos para tomar decisões automáticas de entrada e saída de negociações, fornecendo uma solução robusta e configurável.
Características Principais:
• Lotes de Entrada: 0,01 • Número Mágico Base: 100 • Máximo de Posições Abertas: 100 • Spread Permitido: 0 pontos (máximo) • Pat
FREE

Williams Wizard 是专为市场设计的自动交易系统,建立在健全的交易原则基础之上。与许多其他系统不同,它不依赖于网格系统或 mar 策略,这通常会导致高风险和不可预测的交易。相反,该交易系统使用高度可靠和有效的技术指标来衡量市场动能并帮助识别潜在的买卖机会。我建议在 USDJPY 4 小时内使用此专家顾问,但当然它也可以用于其他高动量交易工具。显示的回测是在 2019 年至 2023 年的 4 小时内对 USDJPY 进行的。与默认设置不同的唯一输入参数是每笔交易承担账户余额固定百分比 (1%) 的风险,而不是使用固定手数。专家顾问的一些优势包括:一次只持有一个头寸,这是因为它不使用任何鞅、网格系统或任何其他形式的危险资金管理。一旦进行交易,就会设置止损,以防止出现巨大损失。有止盈。这意味着您不必担心市场波动会导致您失去潜在收益。还有其他机制可以在交易亏损时或在反转之前提前退出交易以确保利润。
FREE

与 Pure Veil 相识 This is a limited pricing phase. Get it at 80 while under 5 sales. Once that cap is reached, new price will be 105. Currently sold: 7 copies.
MQl5频道: https://www.mql5.com/en/channels/robotsofluaiy 说明: https://www.mql5.com/en/blogs/post/763451 Reach out for the correct backtest settings — I’ll send you everything needed.
为重视简单、稳定和严格控制的交易者设计, Pure Veil 是您的一图交易助手,专为处理机构交易规则和私人账户管理而打造。 Send a message to receive a demo-account trial build. EA的工作原理 EA使用多时间框架趋势对齐来识别方向性偏差。它在允许较低时间框

Automated trading system it's a professional instrument that allows you to achieve results without the negative influence of a human factor. Effectiveness is confirmed by trading on a real account since 2017. Perform all the tests with the modelling type RealTicks or EveryTick. LINKS Full description of the algorithm; Signal monitoring ( WeTrade + BOA System ); TRADING STRATEGY DESCRIPTION The trading strategy is based on a breakout of accumulation. Such trading techniques as martingale o
FREE

King of Gold 是一款专为 XAUUSD(黄金)在 1 小时(H1)周期 交易而开发的高端智能交易系统(Expert Advisor)。该系统基于严格、自律且规则化的交易方法,核心目标是精准执行、稳定表现以及长期资本增长,而非激进或赌博式交易。EA 根据结构化的市场条件生成清晰的 BUY 和 SELL 信号,确保每一笔交易都建立在逻辑与规则之上,避免随机性和情绪化决策。 King of Gold 的核心优势之一在于其动态止损(Stop Loss)和止盈(Take Profit)管理机制。系统不会使用固定数值,而是根据当前市场行为自动调整 SL 和 TP,使交易能够智能适应市场波动和价格结构变化。这种方式有助于减少不必要的止损,提高趋势行情和震荡行情下的交易效率,并在不同市场阶段始终保持受控的风险水平。 King of Gold 专为重视稳定性、透明度和风险控制的交易者而设计。系统避免过度交易,专注于高质量的交易机会,非常适合追求长期、可持续表现的自律型交易者。EA 针对黄金市场的独特特性进行了深度优化,包括其高波动性和强趋势特征,充分尊重 XAUUSD 的市场属性,并以精确

风险交易面板是为手动交易而设计的. 这是发送订单的另一种方式。
面板的第一个特点是使用控制线方便地下订单。 第二个特征是在存在止损线的情况下计算给定风险的交易量。
使用热键设置控制行:
获利-默认情况下T键;
价格-默认情况下p键;
止损-默认情况下,S键;
您可以在交易面板的设置中自行配置密钥。
运算算法:
1)-我们把水平在所需的地方(这是没有必要把所有的水平);
2)-指定风险(可选);
3)-点击绿色发送订单按钮;
4)-我们正在等待下订单,或者会出现带有错误消息的警报;
5)-如果我们想关闭当前符号的所有订单,通过魔术链接到专家顾问,然后点击关闭订单按钮。
您不应该多次按下发送订单按钮。 一次就够了。 下单后,按钮将呈现"未按下"状态。
要发送带有风险计算的订单,需要设置止损线并在交易面板的"风险"字段中设置风险。 否则,订单将以当前交易工具的最低手数放置。
风险是从账户余额计算出来的. 由于经纪商对保证金交易细节的限制,不可能承担100%的风险。
在"风险"字段中允许小数(例如,您可以以余额的0.5%的风险进行交易)。
如果指定的风险低于允许
FREE

Get it FREE while you can! Will be increased to $100 very shortly after a few downloads!!
Join my Discord and Telegram Channel - Max's Strategy For any assistance and help please send me a message here. https://t.me/Maxs_Strategy https://discord.gg/yysxRUJT  ;
The Max Hercules Strategy is a part of a cross asset market making strategy (Max Cronus) built by myself over years of analysis and strategy building. It takes multiple theories and calculations to trade the market in order to cov
FREE

推出 Infinity Gold EA - M5 图表上 XAUUSD 的终极倒卖解决方案
入门型号: Infinity Gold EA 在 XAUUSD 的 M5 图表上扫描市场,识别特定交易时间和交易时段的高质量交易设置。 Infinity Gold 采用协作方法,结合烛台模式和指标。 当这些特定条件在我们指定的交易时间内符合时,算法就会建仓。
贸易管理: 经过广泛的测试和长达 6 年的杜高斯贝数据优化,Infinity Gold EA 拥有令人印象深刻的命中率。 即使在交易对我们不利的情况下,我们高度智能的平均管理系统也旨在通过以更好的价格增加头寸来减轻潜在损失。 在我们先进的利润因子系统的指导下,该算法的目标是在一段时间的较大回撤后获得更高的利润。
可定制的过滤器: Infinity Gold EA 为您提供多种可定制的滤波器参数。 通过实施止损以实现盈亏平衡、利用追踪止损、防止周末滑点、设置最大净值止损以及从各种风险模型中进行选择,完全控制您的交易。 我们的 EA 经过精心设计,可满足您的独特要求和风险偏好。
推荐设置: 用于测试的标准设置 杠杆 - 1:500

交易助手 : 交易助手-MT4(点击下载) 交易助手-MT5(点击下载)
操作说明文档,请仔细阅读
基本使用设置 基本: 快捷开平仓,一键开平仓 , 一键挂单 划线交易 自动止盈止损 多品种平仓 账户保盈 保护止损 移动止损 账户风控 影子订单 万向加仓策略 自动平仓 定海神针 商品信息汇总 图标批量打开 数据统计(详单统计,盈亏全览,持仓分布,货币点图,余额净值曲线,每单盈亏,多品种曲线,专业分析报告等) 支持语言的选择切换(目前支持中文和英文) 自动识别语言 支持 热键开平仓 绑定, 使用快捷键进行快速开平仓...... 快捷键平仓.支持最大30多种热键 解锁支持大部分功能 复盘 操作,可以在 测试环境下使用 开仓平仓区域: 一键开仓( 包含止盈止损的便捷设置,手数自动计算等便捷功能) 一键平仓 (锁仓),极简的风格设计,可以自由选择平仓品种,平仓类型(多单,空单,或者挂单),是否平仓盈利大于0的订单,是否平仓亏损订单,平仓比例的设置(0~100%),且是否平仓反向,以及锁仓功能,均在选项中可以直接实现操作. 多键平仓 划线开单控件 计算出多单或者空单的 平均持

Multi Currency Strength Dashboard Mini(免费版)— MetaTrader 5 货币强弱指标 Multi Currency Strength Dashboard Mini 是一款面向 MetaTrader 5 的免费指标,可在同一面板中实时显示 8 大主要货币 (USD、EUR、GBP、JPY、CHF、CAD、AUD、NZD)的相对强弱(0–100 归一化)。 目标:让你用几秒钟快速识别 强势货币 与 弱势货币 ,更高效地建立观察列表,并按“强对弱”的逻辑筛选交易货币对。 核心功能(Mini 免费版) 一次性分析 8 大主要货币 的强弱。 可视化 Dashboard: 强弱柱状条 + 百分比读数。 自动实时更新(轻量刷新)。 支持 所有图表周期 (计算基于你选择的周期)。 兼容大多数经纪商(支持常见交易品种后缀)。 工作原理 指标会从 Market Watch 中可用的主要外汇货币对提取价格变化,计算每种货币在指定周期与指定回溯长度下的强弱值,并将结果归一化到 0–100 区间后展示为排名式面板。 快速使用步骤 在 Market Watch 中显示主
FREE

A personal implementation of the famous Bollinger bands indicator as a trend following mechanism, which uses a moving average and the standard deviation to define what a trend is and when it changes. Bollinger bands are usually used as an oversold/overbought indicator only, but in my opinion, the trading approach is more complete using the trend variant as an exit strategy. [ Installation Guide | Update Guide | Troubleshooting | FAQ | All Products ] Easy to trade Customizable colors and sizes I
FREE
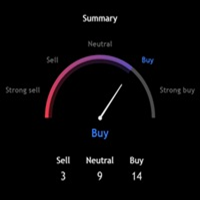
Technical Ratings for MT5 A multi-indicator analysis dashboard that displays aggregated technical signals directly on your MetaTrader 5 charts. This indicator calculates buy, sell, and neutral signals from 11 oscillators, 15 moving averages, and classic pivot points, presenting them in a single organized panel. What It Does Technical Ratings analyzes multiple technical indicators simultaneously and presents their consensus as clear trading signals. Instead of opening dozens of indicator windows

Triangular arbitrage with full automatic! In the parameters, it is enough to specify only the lot and profit!
Trades on all triangles at once, which can be made up of instruments open in the market overview. The adviser himself determines all the triangles that can be made from the broker's available tools. It analyzes the price shift in each triangle relative to the calculated one and opens the whole three at the right moment. Thus, all three instruments constantly insure each other by 100%

The "Support Resistance Dynamic" indicator is a powerful technical analysis tool for the MetaTrader 5 platform, designed to automatically identify and plot dynamic Support and Resistance zones on price charts. This indicator helps traders easily recognize important price levels, potential reversal points, or breakout areas, thereby enabling more informed trading decisions. 2. Key Features Dynamic S/R Identification : Automatically identifies support and resistance zones based on an advanced Pivo
FREE
Are you tired of those old, boring TP and SL lines cluttering your charts? Free now, celebrating release of Live Chart Viewer utility https://www.mql5.com/en/market/product/158488
Struggling to showcase your trades in a way that actually grabs attention ?
Worry no more! Introducing the ultimate solution you’ve been waiting for... The TPSL Bounding Box PRO Indicator! PRO Version (With Risk to Rewards Ratio and more Modern Look Stats)
With just a simple setup, you can transform you
FREE
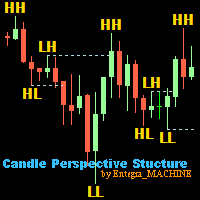
Candle Perspective Structure Indicator MT5 is a simple indicator that defines and displays the candlestick structure of the market. This indicator will suit both experienced traders and beginners who find it difficult to follow the structure visually.
If you want to see more high-quality products or order the development/conversion of your own products, visit my partners' website: 4xDev
Get 10% OFF on manual strategies automation services or indicator development/conversion services at 4xDev
FREE

Currency Strength Meter is the easiest way to identify strong and weak currencies. This indicator shows the relative strength of 8 major currencies + Gold: AUD, CAD, CHF, EUR, GBP, JPY, NZD, USD, XAU. Gold symbol can be changed to other symbols like XAG, XAU etc. By default the strength value is normalised to the range from 0 to 100 for RSI algorithm: The value above 60 means strong currency; The value below 40 means weak currency;
This indicator needs the history data of all 28 major currency

Multi Timeframe Chart in Seconds 是一款指标,允许交易者在单个图表上直接可视化从自定义时间周期计算的价格数据。该指标支持 基于秒、分钟和小时的计算 ,并将计算结果以 彩色蜡烛线 显示在当前图表上。 该指标汇总来自 非标准或高/低时间周期 的价格数据,并在当前图表环境中准确呈现,无需打开多个图表进行时间周期比较。
适用人群 此指标适用于需要在单个图表中观察不同时间周期价格行为的用户。它适合分析 秒、分钟或小时 市场结构的交易者,并需要紧凑的多时间周期视图,而无需切换图表周期。
附加资源 如果您想在 非标准图表 上添加指标,请考虑相关产品: Multi Timeframe Indicators in Seconds
https://www.mql5.com/en/market/product/158101 该产品是大多数默认自定义指标的合集,位于 MQL5/Indicators/Examples/ 文件夹中,经过调整以支持 多时间周期计算 ,包括 基于秒和自定义时间周期 。 内置的 loader 指标 可让您选择所需的指标和计算时间周期。指标可应用于 标
FREE

Smart Finder Order Block The Ritz Smart Finder Order Block is a next-generation market structure recognition tool, designed to intelligently detect and highlight institutional footprints within price action. Built on a dynamic blend of order block theory, consolidation tracking, and adaptive volatility modeling, it provides traders with a sophisticated lens to anticipate high-probability market reactions. Core Capabilities Smart Order Block Detection Identifies both Bullish and Bearish Order Blo
FREE

凤凰K线形态监测器(MT5)
专为MetaTrader 5设计的实时K线形态检测与监控工具。可跨多个交易品种自动识别经典K线形态,并通过可视化仪表盘展示全面的形态统计数据。
概述
凤凰K线形态监测器可识别并追踪十字星、锤子线、流星线、看涨吞没、看跌吞没、晨星、暮星、三白兵及三乌鸦等形态。系统支持同时扫描最多18个可配置交易品种,并为每个监控品种维护形态计数统计。
仪表盘以简洁网格格式展示形态出现情况,显示交易品种名称、总形态计数及最新检测形态。每种检测到的形态均可在图表上触发可自定义颜色的视觉箭头,区分看涨与看跌信号。形态检测基于K线收盘价运行,确保信号确认且不会重绘。
警报功能包括弹出通知、声音提醒及移动端推送通知,当监控品种出现形态时触发。系统支持按形态筛选警报,交易者可专注特定形态并忽略其他形态。所有形态定义均采用标准K线分析规则,支持自定义灵敏度阈值(如十字星检测及实体与影线比例)。
指标支持从仪表盘一键切换交易品种,实现监控工具间的快速导航。可配置热键可独立控制面板可见性、图表箭头或两者同时切换。形态统计数据在图表重启后持续保留,并在整个交易时段内累积。
安装指
FREE

SUPERTREND; It is a trend following indicator based on the SuperTrend ATR created by Olivier Seban. It can be used to detect changes in trend direction and locate stops. When the price falls below the indicator curve, it turns red and indicates a downtrend. Conversely, when the price moves above the curve, the indicator turns green, indicating an uptrend. Like other indicators, it works well on SuperTrend when used in conjunction with other indicators such as MACD, parabolik SAR, Bollinger Band
FREE
您知道为什么MetaTrader市场是出售交易策略和技术指标的最佳场所吗?不需要广告或软件保护,没有支付的麻烦。一切都在MetaTrader市场提供。
您错过了交易机会:
- 免费交易应用程序
- 8,000+信号可供复制
- 探索金融市场的经济新闻
注册
登录