Swing High Low
- インディケータ
- バージョン: 2.0
- アップデート済み: 3 1月 2022
- アクティベーション: 10

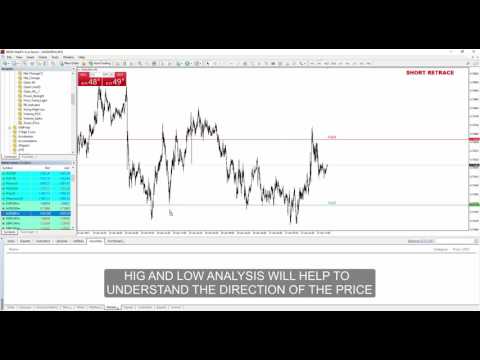
Swing High Low Pattern Recognition is a great indicator able to fix price levels and analyze the market swings.
Swing High Low uses a dynamic approach of analysis that allows you to identify easily the best entry levels.
The indicator using the minimum and maximum periods of the previous candles to analyze the impulsive movement and finally it sets the entry levels.
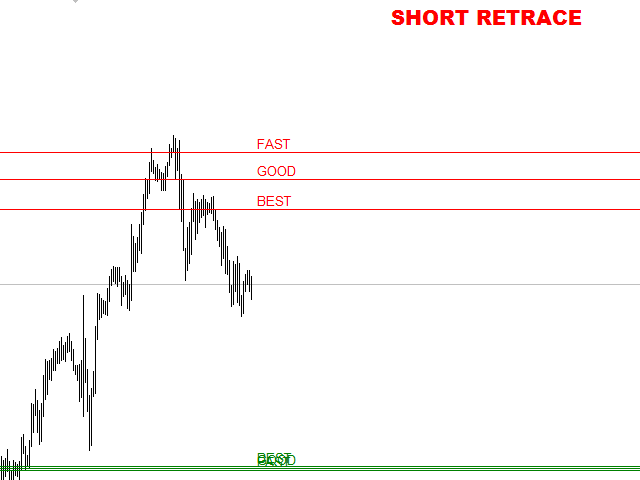
The entry levels are: fast, good and best. The best is the last confirm of the swing.
For a correct use we advise to wait the complete formation of the levels and then evaluate the pull back of these levels.
The indicator automatically update the minimum and maximum providing you a good control on the market swing.
In our opinion Swing High Low is a great help that it will allow you to find great ideas to manage market.
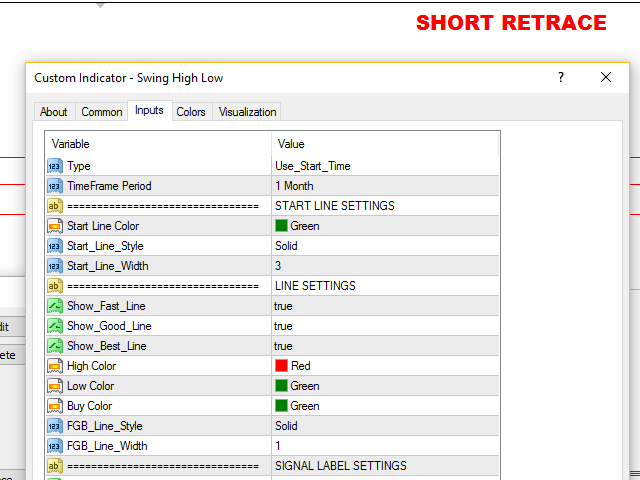
Input Values
- Type:
- Use_TimeFrame (the indicator calculates the swing starting from TimeFrame begin)
- Use_Start_Time (the indicator calculates the swing starting from the date identify with the Vertical line on chart)
- TimeFrame Period
- START LINE SETTINGS
- Start Line Color
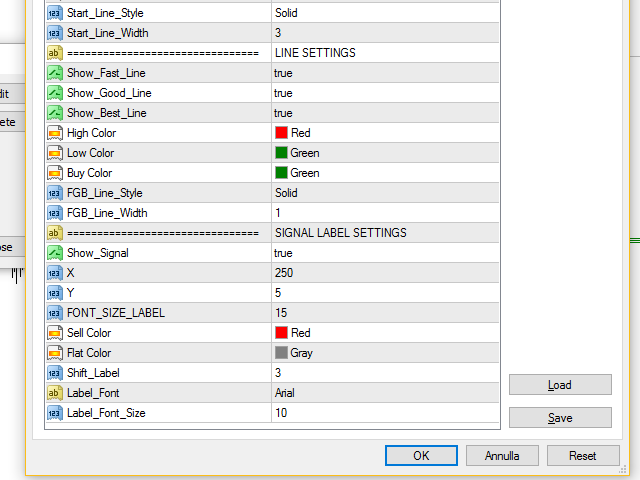
- Start_Line_Style
- Start_Line_Width
- LINE SETTINGS
- Show_Fast_Line (true/false) to show the level on chart
- Show_Good_Line (true/false) to show the level on chart
- Show_Best_Line (true/false) to show the level on chart
- High Color-Low Color to change level color of lines on chart
- FGB_Line_Style - FGB_Line_Width to change style of lines on chart
- SIGNAL LABEL SETTINGS
- Show_Signal (true/false) to show signal label on chart
- X-Y to decide the position of signal label
- FONT_SIZE_LABEL
- Sell Color-Buy Color-Flat color to change color of signal label
- Shift_Label - Label_Font - Label_Font_Size to change position, font and size of labels
Very Good