Smart Trendlines
- インディケータ
- バージョン: 1.0
- アクティベーション: 10

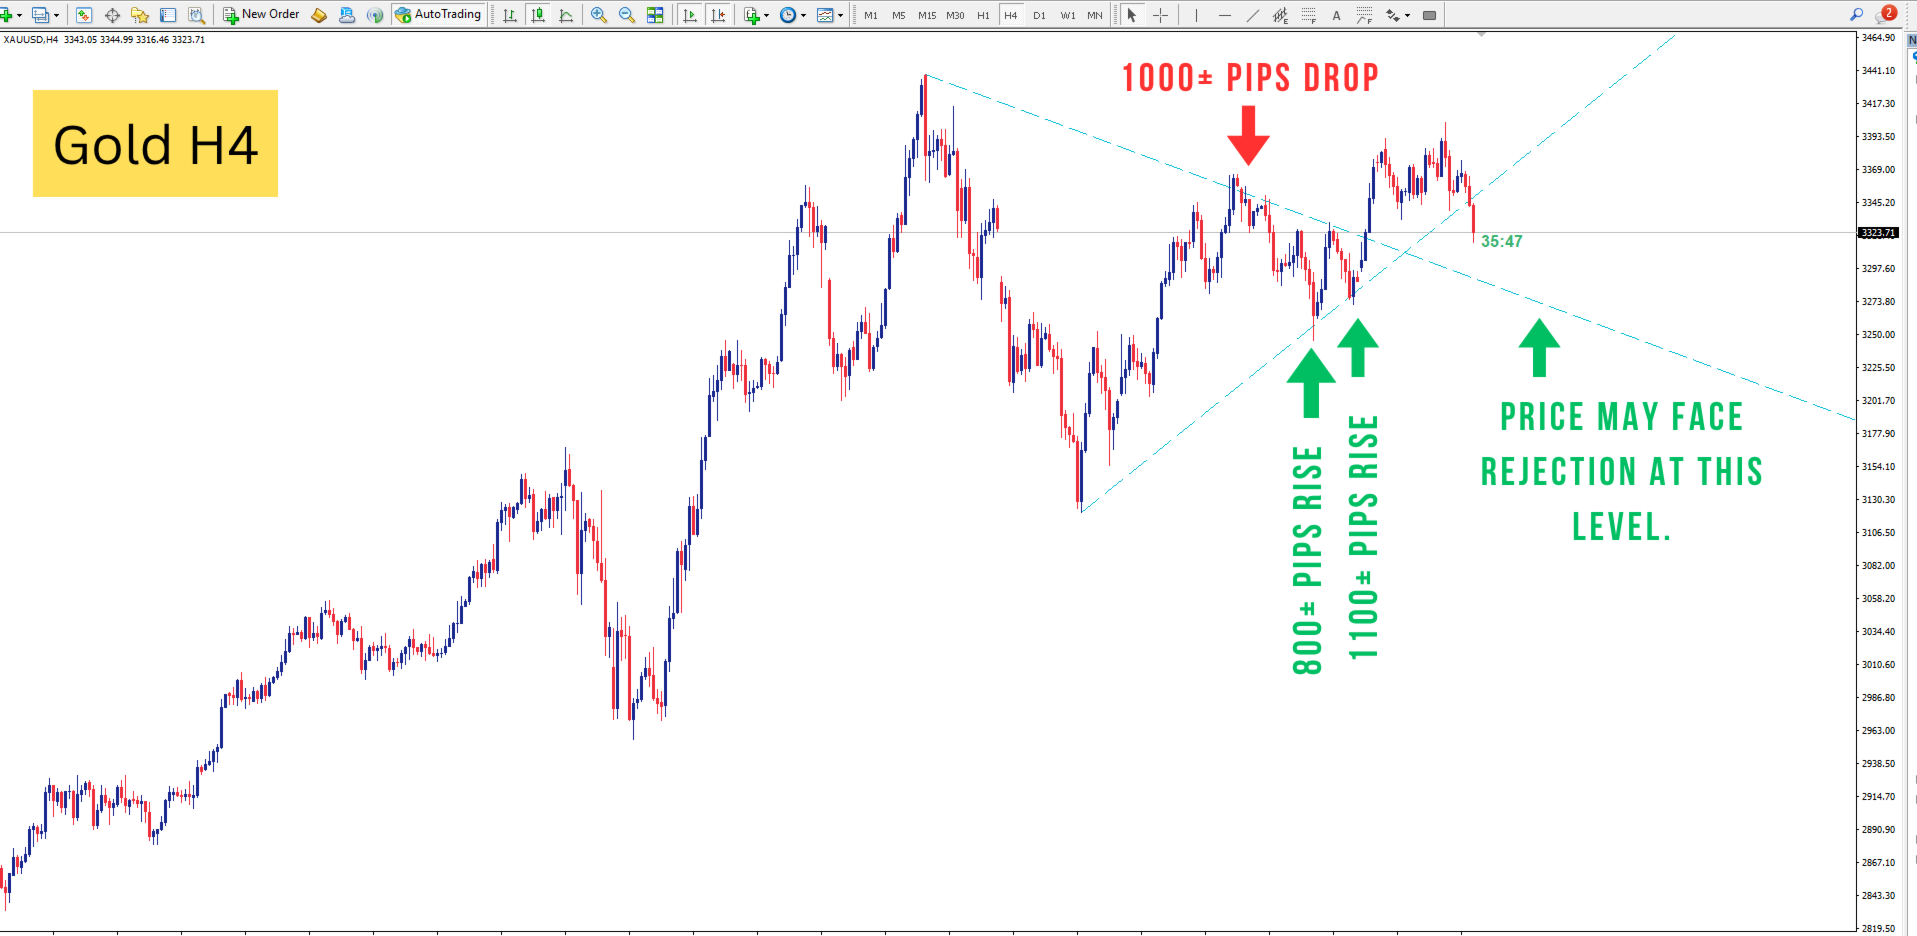
Smart Trendlines – No.1 Trendlines Indicator
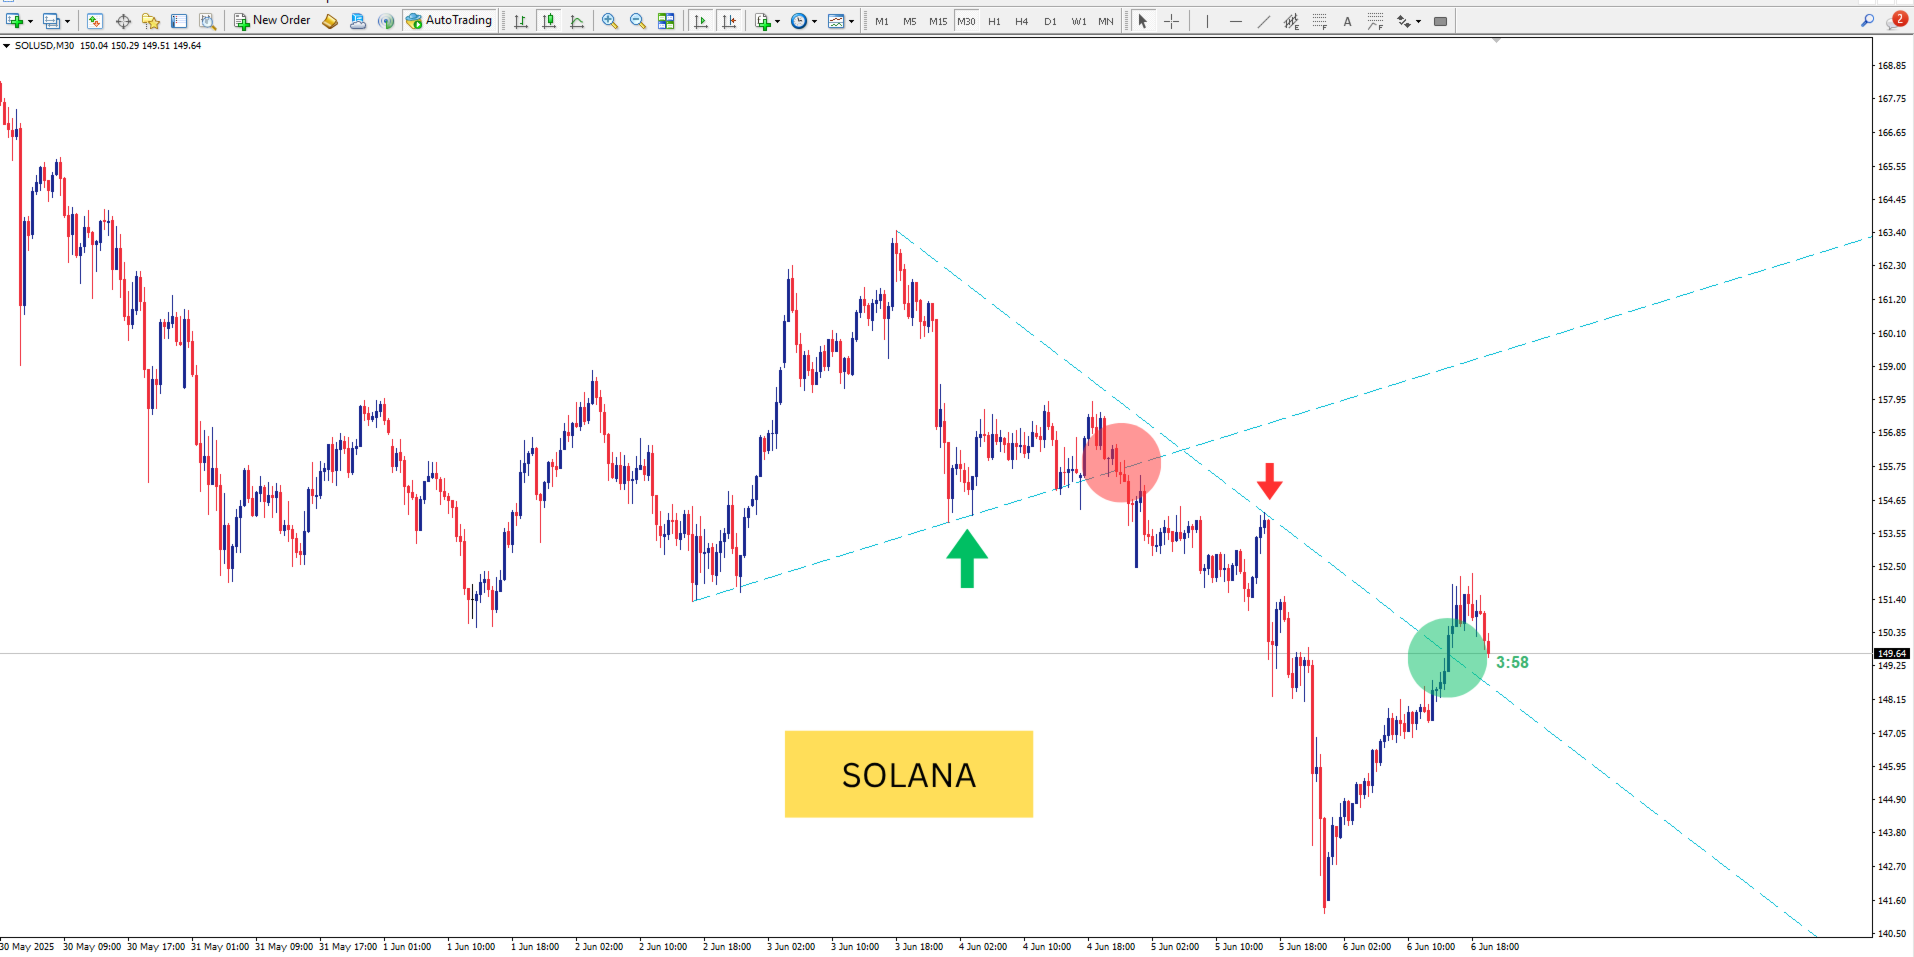
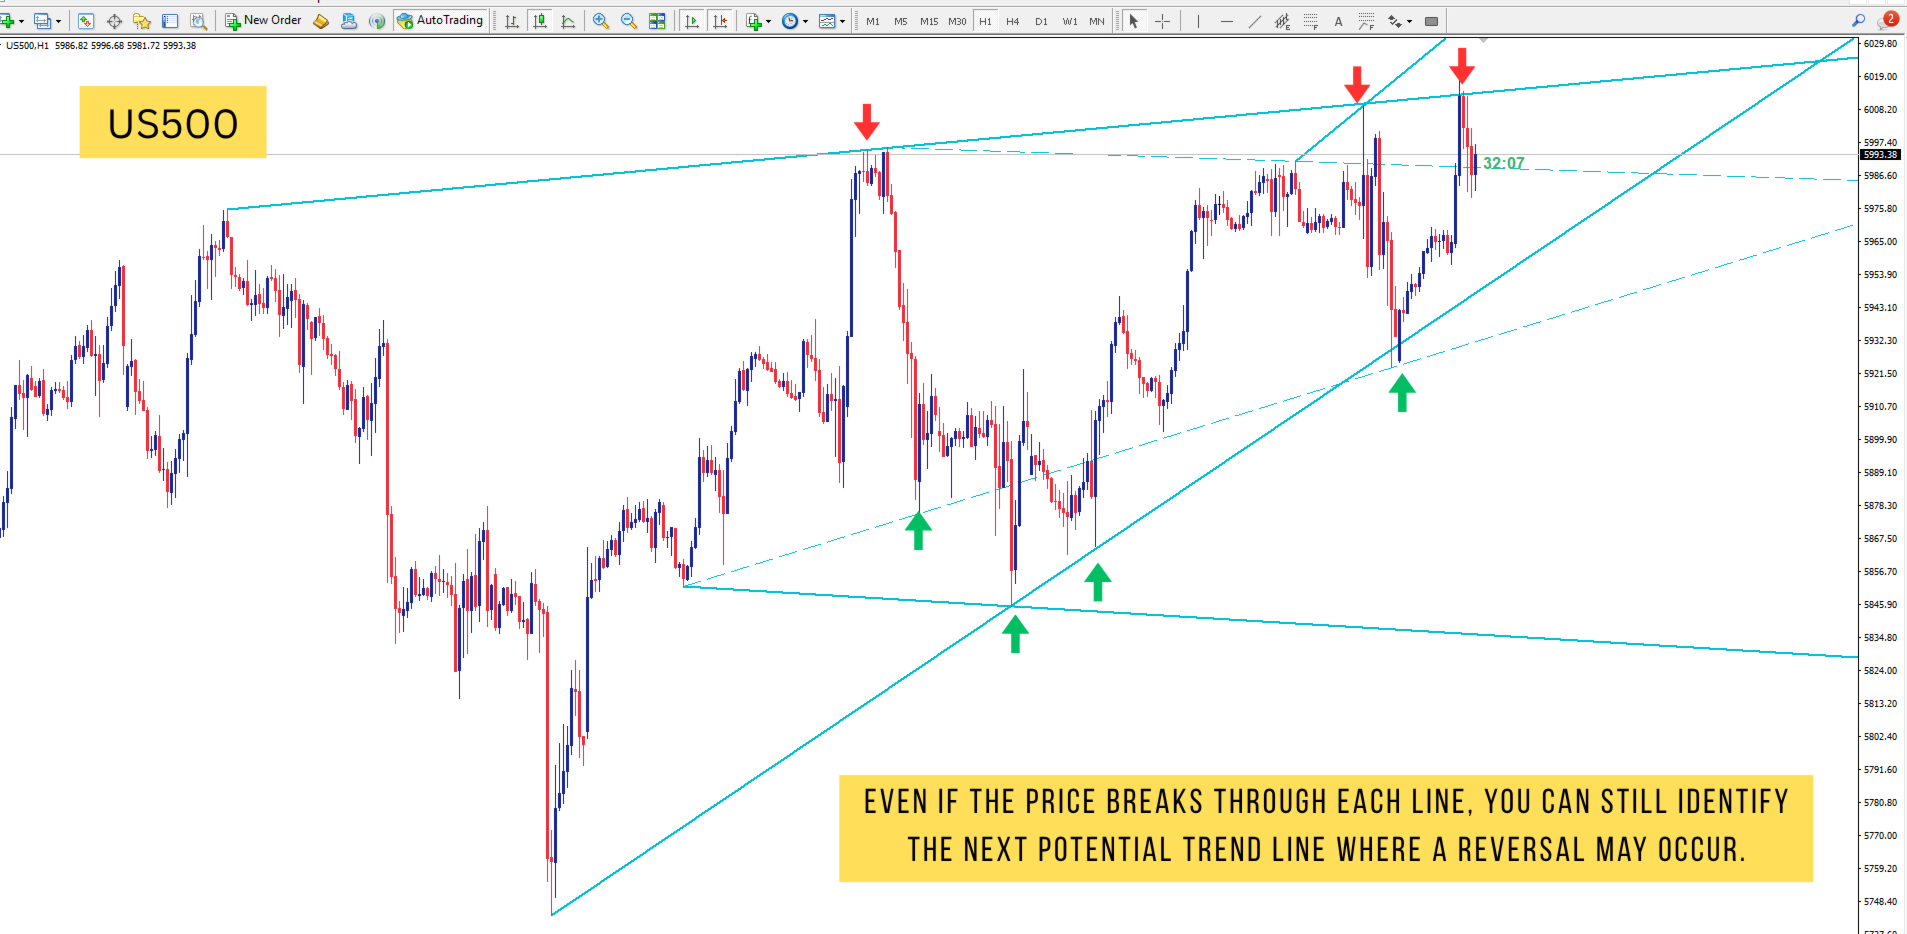
Smart Trendlines is a precision tool that automatically draws trendlines based on every valid pivot point, helping traders identify key support and resistance zones. It continuously adjusts as new market pivots form, providing a live and accurate reflection of price structure. Whether you’re tracking trends, preparing for reversals, or anticipating breakouts — this indicator keeps you one step ahead. It works seamlessly across all assets including Forex, Crypto, Indices, Commodities, and Stocks — and supports all timeframes.
MT5 Version - https://www.mql5.com/en/market/product/140689/
Join To Learn Market Depth - https://www.mql5.com/en/channels/suvashishfx
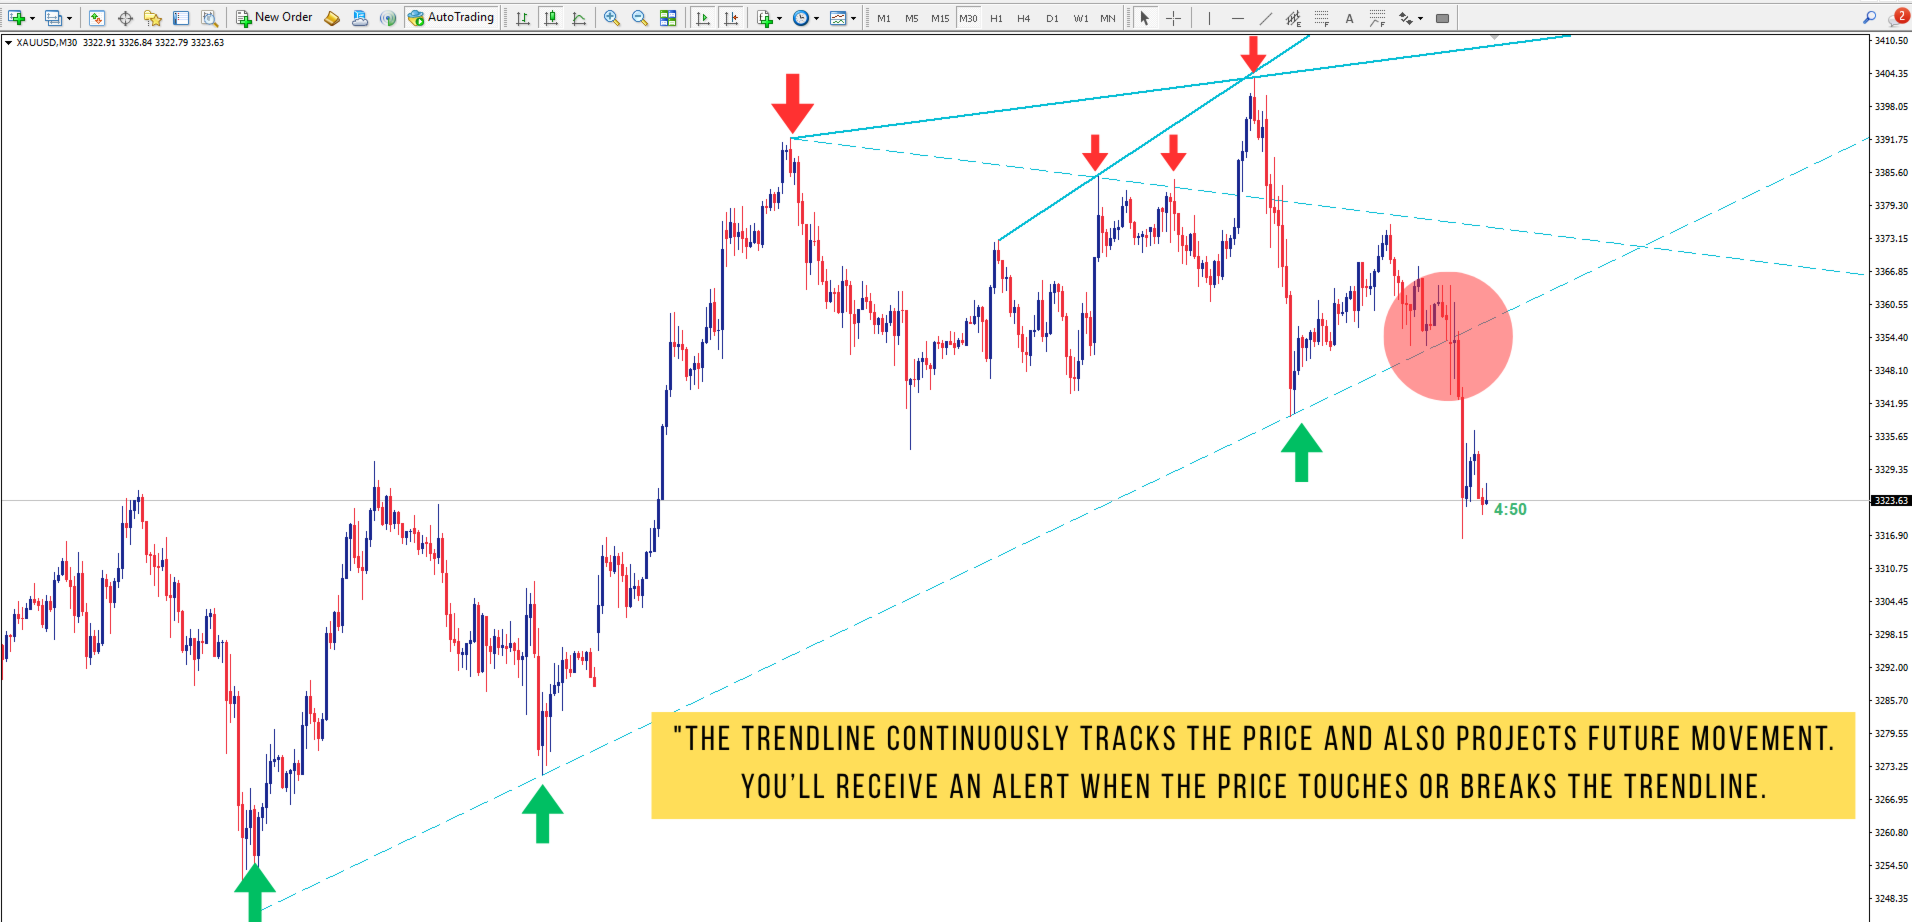
🔔 Smart Alerts – 3 Powerful Signals
Smart Trendlines comes equipped with three types of real-time alerts, giving you full market context:
-
Bullish Reversal Alert – Triggered when price touches the lower trendline, indicating a possible bounce or reversal upward.
-
Bearish Reversal Alert – Triggered when price touches the upper trendline, signaling a potential pullback or reversal downward.
-
Breakout Alert – Triggered only when price closes at least 1/2 candle outside a trendline, confirming a true breakout beyond support or resistance.
🔍 Core Features
-
Auto-Drawn Trendlines
Detects pivot highs and lows over a user-defined lookback period and automatically draws trendlines that evolve with price action. -
Dynamic Validation
Invalid trendlines are removed if they’re no longer respected by price or fall outside proximity thresholds, keeping your chart clean and accurate. -
Trend Filtering
Choose to display only rising lows (bullish trends) or falling highs (bearish trends) to focus on relevant trade setups. -
Custom Styling
Fully control the color, style (solid, dashed, dotted), and width of your trendlines. You can extend them forward, backward, or both based on your strategy. -
Chart Clarity
Outdated trendlines are automatically cleared when they fall outside the lookback window, so your workspace remains uncluttered and focused. - Multi-Timeframe Support
View and draw trendlines based on higher or lower timeframes, allowing you to analyze broader market structure or intraday trends without switching charts.
Smart Trendlines is the ultimate trendline companion — combining auto-detection, breakout intelligence, and multi-alert logic in one powerful tool. Whether you're trading reversals, breakouts, or just watching price respect trendlines, this indicator gives you a clear, accurate edge in any market condition.
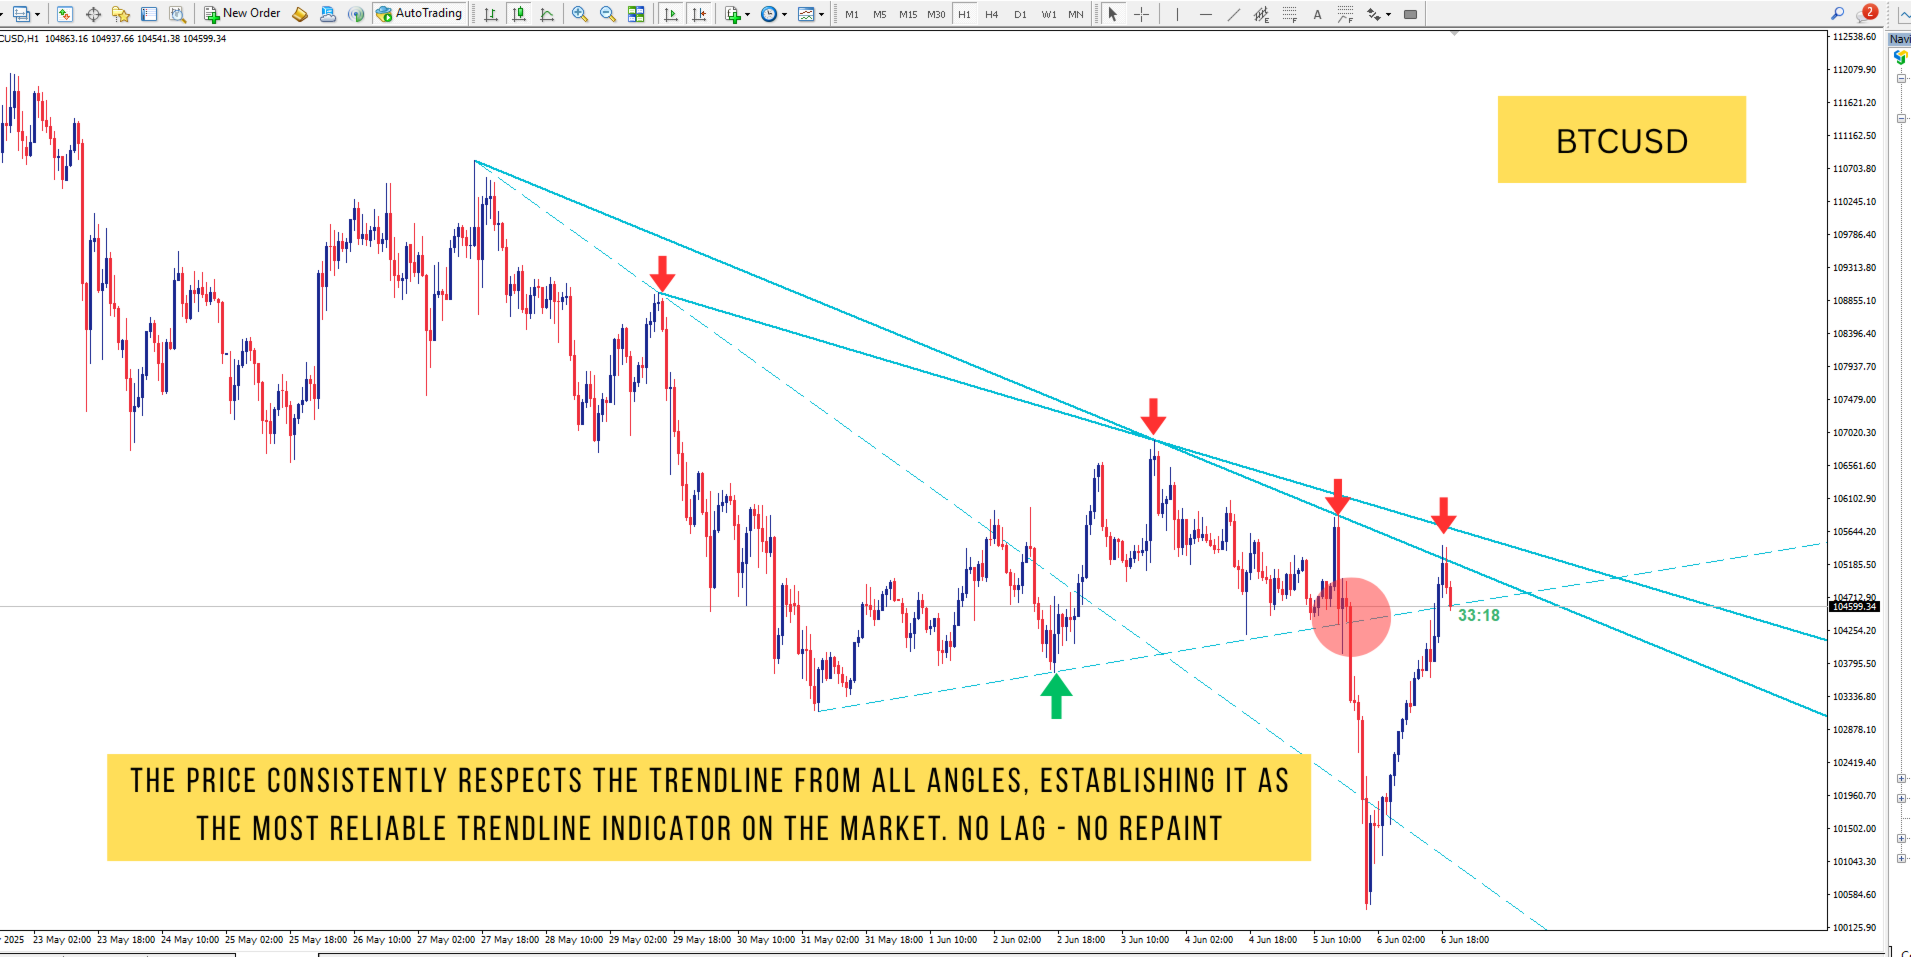

Excellent tool! It stands out among market tools with zero lag and outstanding performance. The No.1 trendline indicator—truly impressive. Thank you to the author for sharing such a valuable resource for market analysis.