私たちのファンページに参加してください

Multitimeframe indicators - MetaTrader 4のためのインディケータ

- ビュー:
- 28597
- 評価:
- パブリッシュ済み:
- アップデート済み:
-
 取引の機会を逃しています。
- 無料取引アプリ
- 8千を超えるシグナルをコピー
- 金融ニュースで金融マーケットを探索
-
 このコードに基づいたロボットまたはインジケーターが必要なら、フリーランスでご注文ください
フリーランスに移動
このコードに基づいたロボットまたはインジケーターが必要なら、フリーランスでご注文ください
フリーランスに移動
Description:
It's very often there isn't enough time to check all chart timeframes and look for the best entry point, these indicators can be set in one window and not switching screens to see the whole picture together.
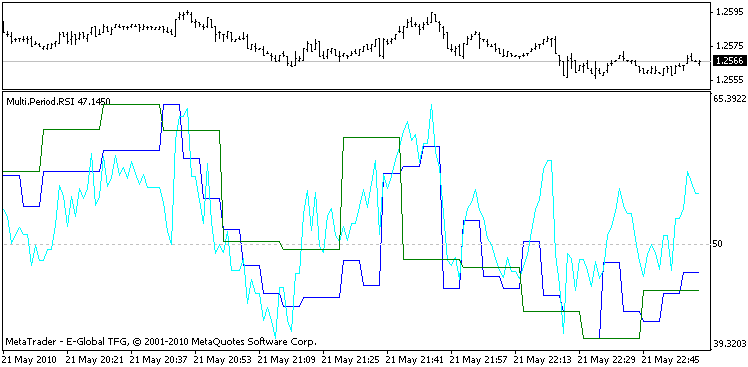
RSI:
Stoxastic:
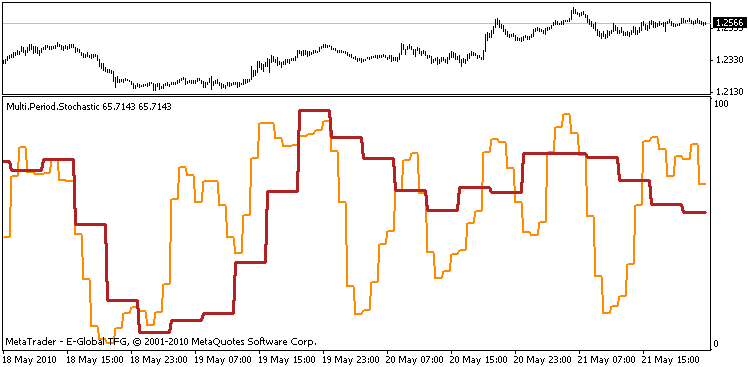
The Stoxastic and RSI indicators are extremely simple, they show the values of relevant indicators with a candle a higher period. The details can be examined further using indicators MA.
Variables:
Total variable for all three indicators timeframe. The valyes are:
- timeframe = January 1 minute
- timeframe = May 5 minutes
- timeframe = 15 15 minutes
- timeframe = 30 30 minutes
- timeframe = 60 1:00
- timeframe = 240 4:00
- timeframe = 1440 1 day
- timeframe = 10080 1 week
- timeframe = 43200 1 month
For the case if there is a mistake in minutes, the indicator itself correct, and set the desired period. For all other variables as well as in the original versions of the indicators.
Now back to MA.
Partly applied_price it can serve for many functions.
- applied_price = 0 PRICE_CLOSE
- applied_price = 1 PRICE_OPEN
- applied_price = 2 PRICE_HIGH
- applied_price = 3 PRICE_LOW
- applied_price = 4 (high + low) / 2
- applied_price = 5 (high + low + close) / 3
- applied_price = 6 (high + low + close + close) / 4
For example, if you put in the window with a period of less than H1 immediately 3 indicators with the following parameters:
- PeriodMA = 1; applied_price = 2; timeframe = 60;
- PeriodMA = a; applied_price = 3; timeframe = 1960;
- PeriodMA = 1; applied_price = 0; timeframe = 15;
So we get an indicator showing the minimum and maximum hourly candles (green lines 1,2) and (Orange 3) shows the opening price of each 15-minute candles.
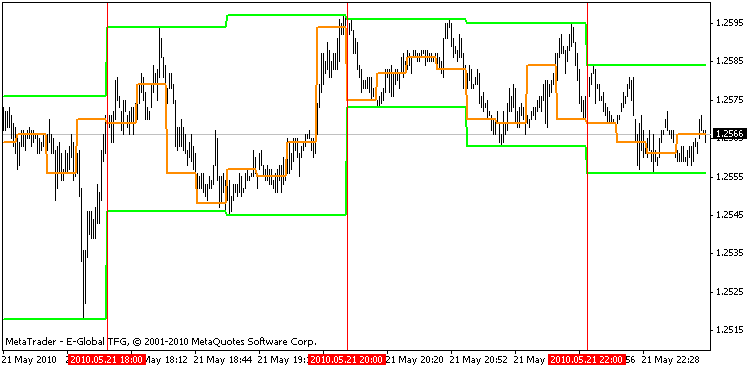
By varying the parameters, you can create right combination of indicators that can you.
Each indicator has two buffers. One is the main, which shows the value steps and support, a smoothing step.
The possible applications of these indicators isn't restricted the ones described.
MetaQuotes Ltdによってロシア語から翻訳されました。
元のコード: https://www.mql5.com/ru/code/9680
 10 Point3 enhanced v003
Base on 10 point , V003 But have been enhanced
 Avg_02b
Calculating the difference between the High and Low price to see the price range for every hour.
10 Point 3 v004 enhanced
10 Point 3 v004 enhanced Expert Advisor
Drag and Drop Support and Resistance lines with color differentiation
Draws several resistance and support lines differentiating the color of both types of line by Drag and Drop a simple script.