私たちのファンページに参加してください

Market Way - MetaTrader 4のためのインディケータ

- ビュー:
- 54026
- 評価:
- パブリッシュ済み:
- アップデート済み:
-
 取引の機会を逃しています。
- 無料取引アプリ
- 8千を超えるシグナルをコピー
- 金融ニュースで金融マーケットを探索
-
 このコードに基づいたロボットまたはインジケーターが必要なら、フリーランスでご注文ください
フリーランスに移動
このコードに基づいたロボットまたはインジケーターが必要なら、フリーランスでご注文ください
フリーランスに移動

Idea:
The idea of this indicator is old, but not so much that we can say that is as old as forex:) The reason that the differences in the costs of opening and closing appeared only with ...
This indicator summarizes the difference of opening and closing for a certain period of time, the main line, +
- Sums only bear bars;
- Sums up the only bull bars,
Advantages:
- - Combines (important!) The possibility of an oscillator and the trend indicator;
- - Easy to understanding and interpretation;
- - Good points to upward or downward movement;
- - Points to the bull and / or bearish pressure, the estimated amount of motion (important!) In points, which can play a significant role in the installation stops and profits.
- - Indicates the presence of lateral movement, and its strength (high or low volatile).
- - Indicates the point of overbought / oversold levels.
- - Clearly indicates the wave function of the price movement and the possibility of rendering the levels of divergence / convergence.
- - Allows you to decide on the future behavior of prices and (important!) To enter the market, using the (important!) Only this indicator;
- - Works well with the data of any timeframe, as well as with the data other than forex, markets;
- - Without additional smoothing filters out false signals the breakdown cost SMA with the same period
- - Must always be a settlement period, which naturally decreases the accuracy of the analyzed data sample size (the main problem of all, including and this indicator);
- - Poorly studied all the possibilities of this indicator
extern int IdBull = 12; / / line of bull, it is better if its value is equal to the bear and the main line
extern int IdBear = 12; / / a bear line, it is better if its value is equal to the bovine line and the main
extern int IdArray = 12; / / all sma line - the value of smoothing of all the lines on the graph, or so-called The SIGNAL lines.
Presented on the display is a histogram displaying the difference bullish line (white bars) and the SMA and the bear line (black bars) and the SMA. More information is written inside the code indicator. Recommended settings are multiples of 12, as well as options to those numbers which are divided at the same time on 3 and 4, the maximum 108, minimum 12, possibly 9 and 7. These assumptions relate to studies of other work, so it is only a number.
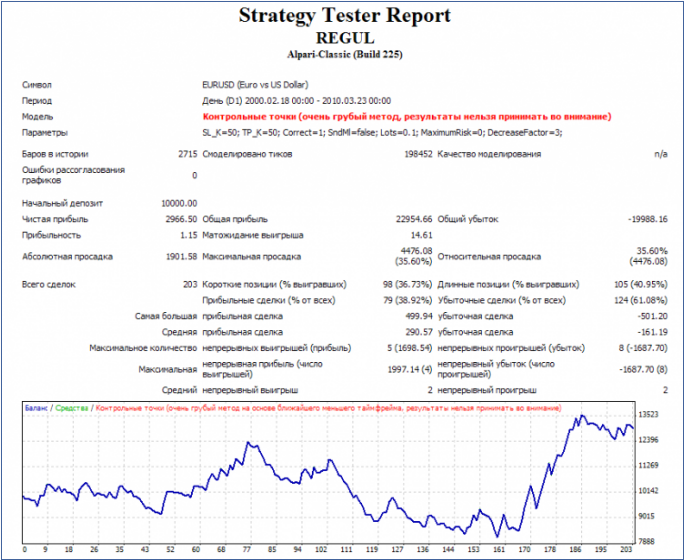
This indicator in the tester strategies:
These are not optimized, deals are made on opening a bar, so there is no need to test "every tick", the open mode of transactions 1 at the bar. t/f Daily, tool: EURUSD, period: all available 1999 and 2010.Stop Loss and Profit at the level of 500 points. Withdrawal shall be effected by the condition of the entrance opposite transaction. Indicators options: all 12., Lot: 0,1 continuous
Conditions of entry Long:
MainAccumulation1-MainSMA1>0 // if the main line above a smoothed value
&& BullPressue1-Point>0 // if the bullish pressure above 0
&& BearPressue1-Point>0 // if the bearish pressure above 0
&& MainAccumulation1-Point>0 // if the main line above 0
Условия входа шорт: Conditions of entry shortlisted:
MainAccumulation1-MainSMA1<0 // if the main line below its smoothed values
&& BullPressue1-Point<0 //if the bullish pressure below 0
&& BearPressue1-Point<0//if the bearish pressure is below 0
&& MainAccumulation1-Point<0 //if the main line is below 0
Terms of the output is strictly opposed.
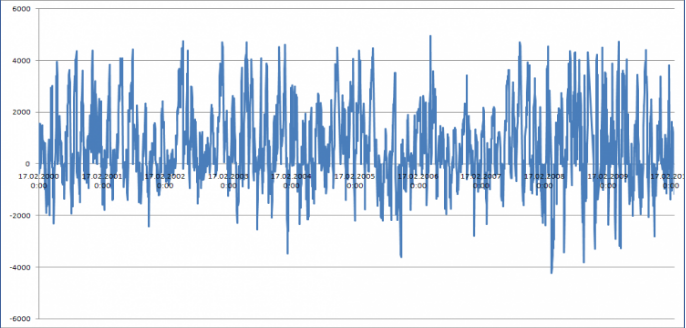
Below is a schedule change of assets
(Equity), the accuracy of 5 digits, as you see, after the discovery of
any of the transactions, the equity is rarely fell below -200 points.
MetaQuotes Ltdによってロシア語から翻訳されました。
元のコード: https://www.mql5.com/ru/code/9574
three indicators to use with the Raghee Horner method
three indicators to use with the Raghee Horner method
Higher TimeFrame Trend Indicator
This indicator displays on the current (lower) timeframe the overall trend on a higher timeframe. It also displays & alerts RSI overbought oversold conditions.
Another VSA indi.
VSA is about reading the market and mapping it out to give you a better understanding of what it might do next.
 BPNN dll temp fix
Hi All, This is temporary fix to the original BPNN.dll posted by gpwr. Now you can play with the NN he created. Please keep in mind this is a makeshift - it will leave unreleased memory so be sure you restart your system after use. ALX