私たちのファンページに参加してください

Friday_line Indicator - MetaTrader 4のためのインディケータ

My articles:
The Use of ORDER_MAGIC for Trading with Different Expert Advisors on a Single Instrument
Evaluation of Trade Systems - the Effectiveness of Entering, Exiting and Trades in General
How to Copy Trading from MetaTrader 5 to MetaTrader 4
- ビュー:
- 27432
- 評価:
- パブリッシュ済み:
- アップデート済み:
-
 取引の機会を逃しています。
- 無料取引アプリ
- 8千を超えるシグナルをコピー
- 金融ニュースで金融マーケットを探索
-
 このコードに基づいたロボットまたはインジケーターが必要なら、フリーランスでご注文ください
フリーランスに移動
このコードに基づいたロボットまたはインジケーターが必要なら、フリーランスでご注文ください
フリーランスに移動
Author:
Urain
Indicator shows vertical lines at last week bar.
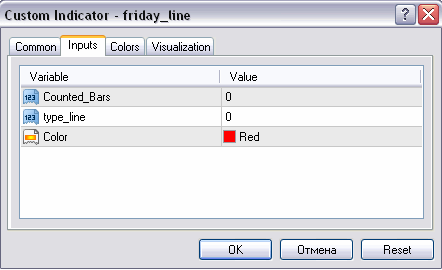
Parameters:
Counted_Bars - number of bars in the calculation, 0 means all bars.
type_line - line type.
Color - line color.
Indicator runs once, to run again make reinitialization.
It deletes only its own lines, the lines are names using the bar dates.
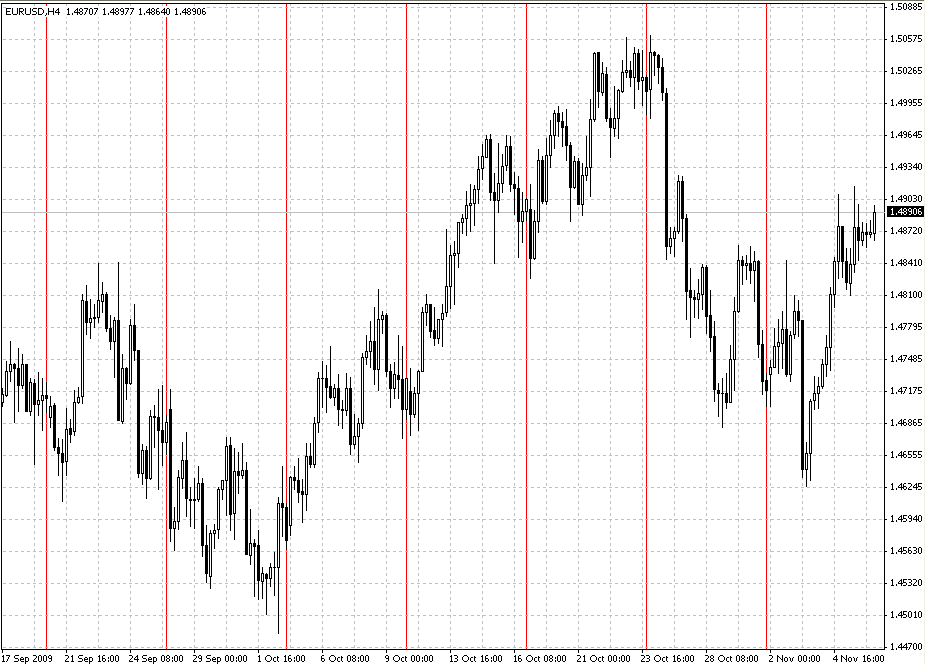
Fig 1. Friday_Line Indicator shows weeks separated by vertical lines, EURUSD, H4
MetaQuotes Ltdによってロシア語から翻訳されました。
元のコード: https://www.mql5.com/ru/code/9303
Indicator for Stop Loss levels calculation using Bill Williams technique
It calculates and shows Stop Loss levels (for Buy and Sell positions) using the method described by Bill Williams in his book "Trading Chaos". A new feature has added: now all it can be analysed in history.
Trend Indicator for several timeframes
It shows a trend table for a several timeframes in the bottom left corner of the chart.
Time, Forex sessions and Trade Hours monitor
Indicator shows a different Forex sessions and the market hours of the exchanges.
Informer
Indicator shows entry and exit points for all deals and account statistics on the chart. It is very useful for trade analysis.