私たちのファンページに参加してください
- 発行者:
- ビュー:
- 58310
- 評価:
- パブリッシュ済み:
- アップデート済み:
-
 取引の機会を逃しています。
- 無料取引アプリ
- 8千を超えるシグナルをコピー
- 金融ニュースで金融マーケットを探索
-
 このコードに基づいたロボットまたはインジケーターが必要なら、フリーランスでご注文ください
フリーランスに移動
このコードに基づいたロボットまたはインジケーターが必要なら、フリーランスでご注文ください
フリーランスに移動
This program uses overbought (OB) and oversold (OS) regions in RSI space to generate short and long trading signals. OB and OS zones are established for the M15, H1 and H4 time frames. The EURUSD M15 chart is used for the program execution. The program contains two triggers to show a comparison of alternative OB/OS methods. Trigger 1 is a conventional method which utilizes fixed numbers for setting the overbought and oversold RSI regions. OB and OS regions are typically RSI values of 70 and 30.
Trigger 2 establishes RSI Bollinger Bands around an average RSI for a specific time duration. OB and OS regions are represented as the value of the standard deviations from the average RSI. For example, an overbought signal would be an RSI value above RSI_Upper where RSI_Upper = RSI_Sigma*StdDev + RSI_Avg. RSI_Sigma is an external value and StdDev is computed from the RSI distribution for past bars.
As seen from the two Strategy Tester reports, the RSI Bollinger Band method, Trigger 2, performs well over an eleven year period and also outperforms Trigger 1. In addition, Trigger 2 has fewer externals than Trigger 1 and has a more uniform performance over eleven years of 15 minute data.
Tester Reports
Date Test Range: 2/2005 - 1/2016 for Triggers 1 and 2.

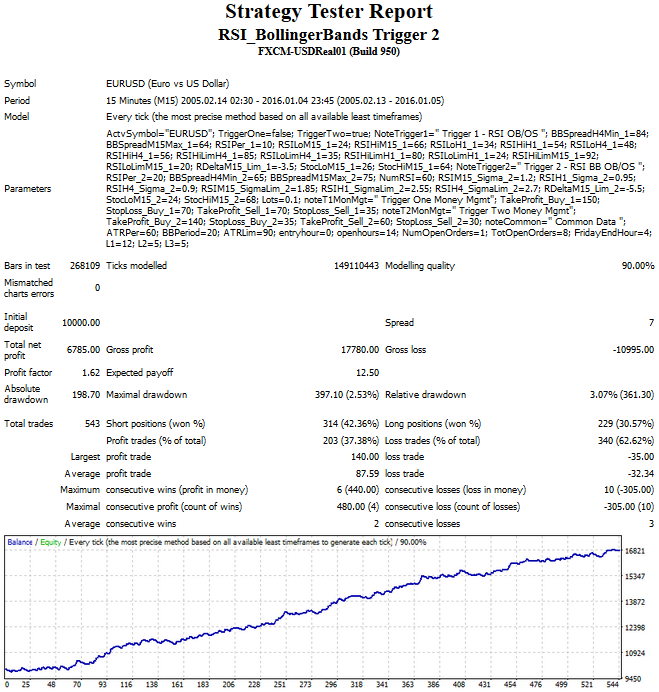
Conclusions:
Applying the Bollinger Band method to oscillator type indicators may improve performance of Expert Advisors over long periods of test, giving more confidence to future performance.
 ScalpWiz 9001
Trades on price spikes around important financial announcements.
 PricePercentRange
Price(%)Range is the indicator for the MetaTrader 4, which calculates the price movement based on percentage High (Highest) and Low (Lowest) price on 100 bars.
Expert Advisor based on the rollback from the MA channel boundary
The Moving Average indicator data is used for trading. If the price goes away from the Moving Average by a certain number of points, then an order is placed in the direction of the Moving Average line.
Tick Chart
Tick chart of the price/spread/volume. Saves tick data in a file.