私たちのファンページに参加してください

- ビュー:
- 27683
- 評価:
- パブリッシュ済み:
-
 取引の機会を逃しています。
- 無料取引アプリ
- 8千を超えるシグナルをコピー
- 金融ニュースで金融マーケットを探索
-
 このコードに基づいたロボットまたはインジケーターが必要なら、フリーランスでご注文ください
フリーランスに移動
このコードに基づいたロボットまたはインジケーターが必要なら、フリーランスでご注文ください
フリーランスに移動
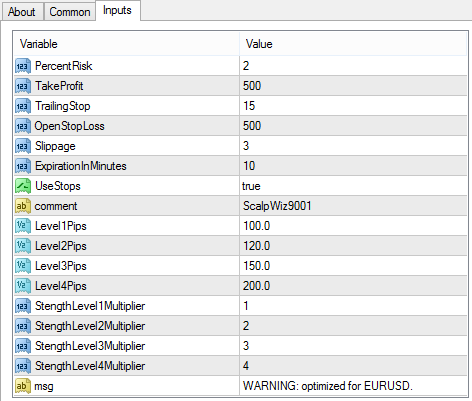
Use on EURUSD M1. Values can be optimized for other pairs and I have had good success with NZDUSD and AUDUSD. I would not use this on a live account (yet), but it is a good example of how to trade on large spikes in price on the M1 charts.
The EA looks at the size of the current bar and issues Buy/Buy Stop and Sell/Sell Stop if the bar exceeds the predetermined limits, of which, there are 4. Each limit has a multiplier associated with it. If the bar exceeds the Level1Pips value, it will apply the StengthLevel1Multiplier value and multiply the PercentRisk value supplied to the PercentPerchase function. You can set your PercentRisk is n% of your account balance, which is divided by the current Ask/Bid to get the lot size. You can keep your risk percentage low and the lot size will increase or decrease with your account balance.
You may or may not use buy stops and sell stops. Buy stops and sell stops will expire after 10 minutes, by default. This value can be modified.
At the moment, the EA issues far too many buy and sell commands. It's an easy fix, but I haven't gotten around to it.
 PricePercentRange
Price(%)Range is the indicator for the MetaTrader 4, which calculates the price movement based on percentage High (Highest) and Low (Lowest) price on 100 bars.
Pivot Only
This is a simple indicator showing pivot only for H1, H4, daily, weekly and monthly.
 RSI Bollinger Bands EA
RSI Bollinger Bands are used to establish overbought and oversold RSI regions for generation of short and long trading signals.
Expert Advisor based on the rollback from the MA channel boundary
The Moving Average indicator data is used for trading. If the price goes away from the Moving Average by a certain number of points, then an order is placed in the direction of the Moving Average line.