Tillson TMA T3

5

TILLSON MOVING AVERAGE

Conosciuto anche come indicatore TMA o T3. È una media mobile che utilizza EMA e DEMA nella sua formula ed è calcolata con un'espansione binomiale di 3° grado.

   
   ...
   int     handle1;     //Handle of the Tillson TMA T3.EX5 custom indicator
   double  euBuff1[];
   int TMAperiod=12;
   int TMSshift=0;
   double VolumeFactor=0.618;
   
int OnInit()
   {
   ...
   handle1=iCustom(NULL,PERIOD_CURRENT,"Market\\Tillson TMA T3.EX5",0,TMAperiod,0,0,TMSshift,0,0,VolumeFactor);
   ArrayResize(euBuff1,5); //Set a new array size specifying the reserve of 5 elements!
   ArraySetAsSeries(euBuff1,true);
   ...
   }

//Code to use in indicators
int OnCalculate(..........)
   {   
   ...
   CopyBuffer(handle1, 0, 0, 4, euBuff1); //Copy the values of the indicator Tillson TMA T3 to our indicator buffer
   printf (euBuff1[3]);
   ...
   }

//Code to use in Expert Advisors
void OnTick()
   {   
   ...
   CopyBuffer(handle1, 0, 0, 4, euBuff1); //Copy the values of the indicator Tillson TMA T3 to our indicator buffer
   printf (euBuff1[3]);
   ...
   }


void OnDeinit(const int reason)
  {
   ...
  IndicatorRelease(handle1);  //free the handle of the indicator
  }

Professionisti;

1-      segnali errati riscontrati in altre medie mobili ( zig continuo zag ) è stato ridotto il più possibile.

2-      impedito i ritardi osservati nelle medie mobili classiche .

3-      Molto successo nelle tendenze

Contro

1-      Non è efficace nei mercati orizzontali.

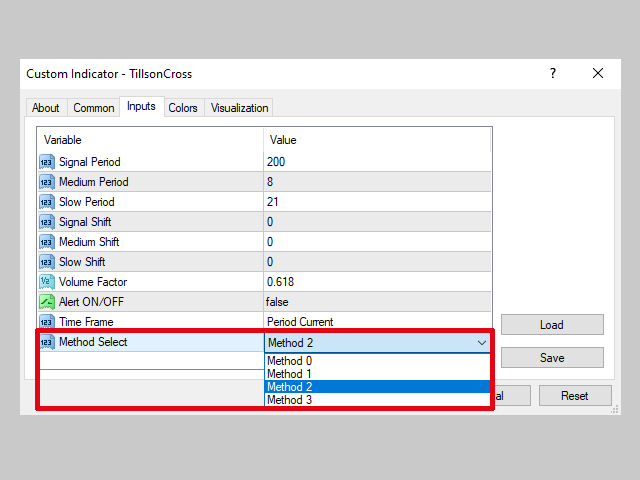
Parametri di impostazione;

period; Sebbene il valore consigliato sia 5, è possibile utilizzare anche valori di 7 o 8.

Volume Factor; L'intervallo da 0 a 1 è l'intervallo di valori consigliato, ma può arrivare fino a un massimo di 2. Il valore consigliato è 0,7 . Per spiegare più semplicemente l'effetto di Volume Factor su T3, se assume valori vicini a 0, mostrerà un comportamento simile a EMA, e se assume valori vicini a 1, mostrerà un comportamento simile a DEMA .

Segnali BUY/SELL;

Metodo 1; Una strategia che utilizza 1 x T3,

Quando Volume Factor=0.7, Periodo=8 e oltre

-          Se le barre incrociano T3 verso l'alto, BUY segnala

-          Segnalazione SELL se le sbarre si abbattono su T3

Metodo 2; Una strategia che utilizza 2 x T3,

-          periodo piccolo T3 interrompe il segnale del periodo grande T3 dal basso verso l'alto BUY

-          periodo piccolo T3 interrompe il segnale del periodo grande T3 dall'alto verso il basso SELL

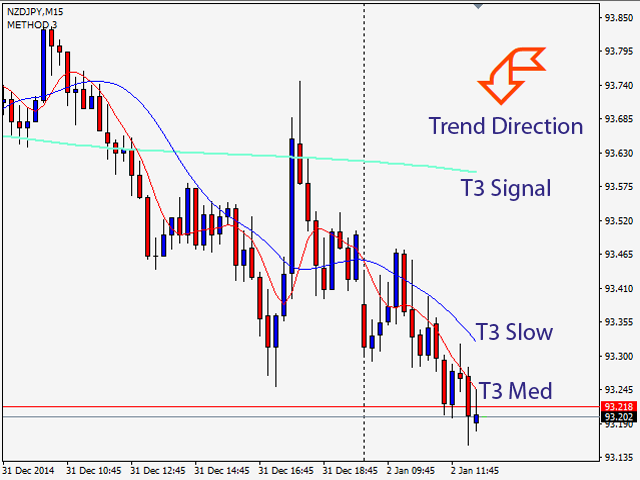
Metodo 3; Una strategia che utilizza 3 x T3,

Consiste nell'aggiungere un terzo T3 di tendenza al metodo 2. Valori standard; Periodo1=200, Periodo2=8, Periodo3=21 e Volume Factor=0.7

            T3 con periodo1=200 sarà il determinante della direzione del trend. In altre parole, quando i T3 di piccolo periodo sono superiori a T3 di 200, la tendenza sarà considerata in rialzo e solo i segnali BUY saranno considerati secondo il Metodo 2. Allo stesso modo, quando i T3 di piccolo periodo sono inferiori a T3 di 200, la tendenza sarà considerata in rialzo e solo i segnali SELL saranno considerati secondo il Metodo 2.

Recensioni 9
singroove
579
singroove 2025.08.02 10:27 
 

It is a very good indicator if used correctly as described. Thank you.

Eliana Alves
44
Eliana Alves 2025.07.09 21:52 
 

Estou aprendendo a usar ainda e estou gostando muito

Murat Ergun
20
Murat Ergun 2024.11.18 08:28 
 

Merhaba. Gerçekten çok güzel bir uygulama olmuş. 2 tane ricam olabilirmi? 1.Sadece Alert açıldığında gerçekleşen fiyatı da gösterirseniz daha iyi olacağı kanısındayım. 2.Birde örnek olması adına orjinal kodları da paylaşabilirmisiniz. Tekrar teşekkürler.

Prodotti consigliati
The Multi-Frame MACD Indicator is a robust MetaTrader 5 (MT5) indicator that utilizes the Moving Average Convergence Divergence (MACD) to analyze trends across multiple timeframes. This indicator synchronizes MACD-based trend signals from up to nine timeframes (M1, M5, M15, M30, H1, H4, D1, W1, MN1) and presents them with clear visual cues, including a colored MACD line, signal arrows, and a customizable dashboard. Perfect for traders seeking momentum and trend reversal insights. Features Multi-
FREE
Institutional Tick Engine Lite: Strumento di Velocità Tick e Inversione Institutional Tick Engine Lite è un indicatore tecnico progettato per analizzare la velocità del mercato e la logica della microstruttura utilizzando i dati tick grezzi. Fornisce metriche in tempo reale per lo scalping e il day trading. Caratteristiche Incluse Monitor Velocità Tick: Istogramma in tempo reale che mostra "Tick Per Secondo" (TPS). Segnali di Inversione (Lite): Identifica punti di inversione basati sull'esaurime
FREE
This indicator idea comes from Tushar Chande called Qstick. Technical indicators quantify trend direction and strength in different ways. One way is to use the difference between close and open for each bar and to sum it up over a period of time. The formual is: Qstick (period ) = Average ((close-open ), period ) In this indicator, we can choose how to calculate body by two famous chart types. The first and default indicator settings are based on Heiken Ashi chart, and the second is based
FREE
SDivergence
Mobin Zarekar
3 (2)
SDivergence Indicator calculates and shows regular divergences and hidden divergences for MACD and Stochastic(for now). The benefit of this indicator is multiple input variables. Using these inputs you can modify to get more adaptive RD and HD's to your strategy. Guide : 1- First put your desired oscillator (MACD or Stochastic or Both) on the chart. 2- Run SDivergence indicator and set corresponding sub-window index of previously put oscillator in SDivergence input window. -Note: the chart sub-w
FREE
Versione migliorata del MACD Histogram (per monitorare i cambiamenti del momentum) L’indicatore MACD standard di MT5 utilizza il valore della linea MACD stessa per costruire l’istogramma. In condizioni di movimenti rapidi o mercati laterali, questi istogrammi cambiano lentamente e spesso non riflettono chiaramente l’accelerazione o il rallentamento della forza rialzista o ribassista. Ciò è particolarmente evidente quando il prezzo non mostra ancora un’inversione chiara, causando segnali in ritar
FREE
Detailed Description: The EMA Trend Histogram Indicator is a powerful tool for traders seeking clear trend identification based on the widely-used Exponential Moving Averages (EMAs).This indicator  provides an easy-to-interpret histogram  and helps you simplify trend identification by using the 50 EMA and 200 EMA on two crucial timeframes: H1 and H4. By observing the relationship between short-term and long-term EMAs on multiple timeframes, this indicator provides a quick and clear view of mark
FREE
Strong Move
Triet Lam Minh
This indicator combines RSI(14) and ADX(14) to find out the signal that price moves strongly. When it appears signal (represent by the yellow dot), and price is going down, let consider to open a SELL order. Otherwise, let consider to open a BUY order. In this case, the strength of moving is strong (normally after sideway period), so  we can set TP by 3 times of SL  . 
FREE
The "Market Direction Analyzer" is a technical indicator designed to provide traders with a comprehensive analysis of market trends, momentum, and potential reversals. By integrating multiple analytical tools, it offers a multi-dimensional perspective on market conditions, aiding in more informed trading decisions. Using the Market Direction Analyzer in Trading: Trend Confirmation: By analyzing the aggregated sentiment score derived from its components, traders can confirm the prevailing market
FREE
This is a custom MACD (Moving Average Convergence Divergence) indicator designed for MetaTrader 5 (MT5) . It replicates the TradingView MACD version , ensuring consistency for traders familiar with that platform. The default MACD in MT5 has differences in its calculation and visualization compared to TradingView. This indicator provides an identical structure, allowing for accurate technical analysis across different platforms. Features TradingView-Style MACD – Matches the histogram, signal lin
FREE
This is HTF (or MTF) of original Kolier SuperTrend indicator. On this version, you can use 4 Lines of supertrend to define the trend, it will be more powerful. Remade signals on smalls timeframes, the indicator will not repaint if used on small timeframes.
SSACD - Singular Spectrum Average Convergence/Divergence This is an analogue of the MACD indicator based on the Caterpillar-SSA ( Singular Spectrum Analysis ) method. Limited version of the SSACD Forecast indicator. Limitations include the set of parameters and their range. Specificity of the method The Caterpillar-SSA is an effective method to handle non-stationary time series with unknown internal structure. The method allows to find the previously unknown periodicities of the series and make
FREE
Trend BB MACD
Andres Felipe Carvajal Rodriguez
5 (3)
Indicatore Trend BB MACD con Filtro ADX L' indicatore Trend BB MACD con Filtro ADX è uno strumento tecnico avanzato che combina le Bande di Bollinger (BB) , il MACD e l' Indice di Movimento Direzionale (ADX) . Ora incorpora un sistema completo di analisi direzionale con +DI e -DI , oltre a opzioni di conferma incrociata con il MACD. È progettato per offrire segnali di trading precisi e filtrati, ottimizzati per lo scalping , l' intraday e lo swing trading , aiutando a identificare non solo la d
FREE
OmniSignal Pivot Session combines two powerful trading concepts— Daily Pivots and  (NY, London and COMEX) Session Opening Levels —into one clean, intelligent signal indicator. It's designed to identify key market levels and provide clear, non-repainting entry signals based on a robust 3-candle confirmation pattern , helping you filter out market noise and trade with more confidence. Suggested Symbols: XAUUSD, US30, DE40 (might have some bugs if you are using it with any Forex Pair!) Core Fea
FREE
KVO Indicator
Saullo De Oliveira Pacheco
Klinger Volume Oscillator (KVO) - A Powerful Trend & Momentum Indicator This is an enhanced version of the Klinger Volume Oscillator (KVO) , a widely used indicator designed to help traders identify momentum shifts, trend direction, and overbought/oversold conditions in the market. How the KVO Indicator Works: Volume-Based Trend Identification – Unlike traditional oscillators that rely solely on price movements, the KVO uses both price and volume to detect market trends and momentum shifts .
FREE
An improved version of the standard Standard Deviation indicator. It is now a responsive and smoothed line. The setup is not straightforward - but I hope you can do it. It is very easy to understand the readings of this indicator, the meaning is the same as that of the usual Standard Deviation. //////////////////////////////////////////////// /////////////////////////////////// I hope this indicator will be very useful to you in successful trading. Good luck.
FREE
MACD divergence indicator finds divergences between price chart and MACD indicator and informs you with alerts (popup, mobile notification or email) . Its main use is to find trend reversals in the chart. Always use the divergence indicators with other technical assets like support resistance zones, candlestick patterns and price action to have a higher possibility to find trend reversals. Three confirmation type for MACD divergences: MACD line cross zero level Price returns to previous H/L Crea
FREE
Description (English): Trend Test by Subho – Advanced Trend & Step Channel System Trend Test by Subho   is a powerful all-in-one trend trading system designed to filter noise and provide clear market direction. This indicator combines two sophisticated algorithms: the   Trend Test ()   and the   Subho Step Channel   into a single chart overlay. It also features a stylish   Live Dashboard   that alerts you to the current trend status in real-time. Key Features: Trend Test () Logic: An advanced tr
FREE
Chaikin's volatility indicator calculates the spread between the maximum and minimum prices. It judges the value of volatility basing on the amplitude between the maximum and the minimum. Unlike Average True Range , Chaikin's indicator doesn't take gaps into account. According to Chaikin's interpretation, a growth of volume indicator in a relatively short space of time means that the prices approach their minimum (like when the securities are sold in panic), while a decrease of volatility in a l
FREE
Moving Average Sentiment "Transform Raw Market Data into Clear Sentiment Vision" Moving Average Sentiment is a next-generation adaptive trend sentiment indicator that visualizes the true bias of the market — bullish, bearish, or neutral — in real time. It combines Moving Average dynamics with ATR-based volatility zones , creating a fluid, self-adjusting sentiment curve that reacts instantly to price structure and volatility shifts. This tool goes beyond a simple MA — it reads the behavior of th
FREE
Easytrend Gold MT5
Glaudes Laurislei Moreira
Tired of confusing indicators, especially when trading the volatile Gold market? EasyTrend   Gold MT5 is designed to tame Gold's volatility on   any timeframe . It harnesses the power of ATR to translate Gold's sharp movements into a single, clear, and dynamic trend line that cuts through the noise. Whether you are scalping on M1 or swing trading on H4, you can visualize the trend's direction and strength, easily identify consolidation periods, and gain an intuitive insight into when it's time t
FREE
MWC Ratio 5
Joerg Hamann
2 (2)
The Commitments of Traders Ratio Indicator is one of these things you never thought about it before you really see the magic behind it. The indicator shows the Ratio of long/short positions released by the CFTC once a week. If you have a look on the Sreenshot you can see two (three) zones of interest. Important note: MAs are not available in version 1.0. Zone 1: The Switches (Red -> Green, Green -> Red) Zone 2: MA cross Zone 3: If you combine this with the COX indicator an additional zone will
FREE
Original MACD
Kirill Paskhin
5 (6)
Moving Average Convergence/Divergence — схождение/расхождение скользящих средних — технический индикатор, разработанный Джеральдом Аппелем (Gerald Appel), используемый в техническом анализе для проверки силы и направления тренда, а также определения разворотных точек. Встроенный в MetaTrader 5 индикатор MACD не соответствует задумке автора (Gerald Appel): -линия MACD графически изображена в виде гистограммы, однако гистограммой отражается разница между линией MACD и сигнальной линией;  -сигнальн
FREE
ZamanCyclesPOC
Mahmoud Sabry Mohamed Youssef
Everyone knows how to analyze the market , which level to buy / sell  this is an easy job , which leads to unusual horrible loses , very little few people knows WHEN then enter the market , time is Money , this is the key!!! This version is a Proof of concept limited version of ZamanCYcles founded here: https://www.mql5.com/en/market/product/81883?source=Site +Market+Product+Page This works Only on 3 Minutes Time frame for 45 Candles Get rest of planets and more than 10 other algorithms to pred
FREE
Digital RSI and ADX
Aiman Saeed Salem Dahbag
5 (1)
A lightweight digital indicator that combines the most important momentum tools directly on the chart. It displays real-time values of RSI, ADX, +DI, −DI, and DI Spread in a clean and compact format, without drawing any lines or graphical objects on the chart. Designed to provide fast insight into trend strength and the balance between buyers and sellers, without the need to open additional indicator windows. Fully customizable—font, size, and screen position can be adjusted easily.
FREE
La maggior parte dei segnali di “divergenza RSI istantanea” è sbagliata Se hai mai utilizzato indicatori di divergenza RSI, probabilmente ti è capitato: una divergenza appare in tempo reale e sembra convincente all’inizio, per poi scomparire dopo alcune candele. Quando guardi il grafico in un secondo momento, i segnali storici non corrispondono più a ciò che avevi visto inizialmente. Non è un errore dell’utente. È un problema logico. Le divergenze basate su massimi o minimi non confermati sono,
FREE
This MQL5 indicator draws four Exponential Moving Averages (EMAs) — 21, 50, 100, and 200 — directly on the chart window. The EMA 21 is displayed as a color-changing line , while EMA 50, 100, and 200 are standard single-color lines. The color of EMA 21 changes dynamically based on price position. When the closing price is above EMA 21 , the line turns blue , indicating bullish pressure. When the closing price is below EMA 21 , the line turns yellow , indicating bearish pressure. If the price equa
FREE
LT Force
Thiago Duarte
5 (5)
For those who like trend the Force will be a very useful indicator. This is because it is based on the famouse ADX, which measure the strenght of a trend, but without its 3 confusing lines. Force has its very simple interpretation: if the histogram is above zero level the trend is up, otherwise it is down. You can use it to find divergences too, which is very profitable. Thanks to Andre Sens for the version 1.1 idea. If you have any doubt or suggestion, please, contact me. Enjoy! MT4 version: 
FREE
Long Term Double MACD Strategy with EMA Trend Confirmation This strategy uses a leading and lagging MACD indicator. The leading indicator gives the entry signals, and the lagging indicator gives the exit signals. This Expert does not use any account management and as such you should make sure to set good stop losses. Works best on longer timeframes on low volatility pairs.
FREE
Custom Candle – Multi-Timeframe Visualization Analyzing multiple timeframes is essential for accurate trading decisions, but switching between charts can be inconvenient and inefficient. The Custom Candle indicator solves this problem by overlaying higher-timeframe (HTF) candles directly onto your lower-timeframe (LTF) chart. This allows you to see the bigger picture at a glance, align with the higher trend, and improve trade accuracy—without leaving your current chart. Key Features Multi-Timefr
FREE
Magic Trend
Arnold Kurapa
3.67 (3)
Magic Trend  This MT5 indicator is a Moving Average with 3 signal colors. The 3 input parameters on this Indicator give you a chance to set any Moving Average of choice. A combination of 2 different exponential moving averages, relative strength index, commodity channel index, and William's percent range provide the signals. White color = Null/No/Exit Signal Green color = Buy Signal Red color = Sell Signal Point To Note: Confirm the color change only after the current candle closes to avoid
FREE
Gli utenti di questo prodotto hanno anche acquistato
Se acquisti questo indicatore, riceverai il mio Trade Manager Professionale + EA  GRATUITAMENTE. Innanzitutto è importante sottolineare che questo sistema di trading è un indicatore Non-Repainting, Non-Redrawing e Non-Lagging, il che lo rende ideale sia per il trading manuale che per quello automatico. Corso online, manuale e download di preset. Il "Sistema di Trading Smart Trend MT5" è una soluzione completa pensata sia per i trader principianti che per quelli esperti. Combina oltre 10 indicat
ARIPoint
Temirlan Kdyrkhan
1 (1)
ARIPoint is a powerful trading companion designed to generate high-probability entry signals with dynamic TP/SL/DP levels based on volatility. Built-in performance tracking shows win/loss stats, PP1/PP2 hits, and success rates all updated live. Key Features: Buy/Sell signals with adaptive volatility bands Real-time TP/SL/DP levels based on ATR Built-in MA Filter with optional ATR/StdDev volatility Performance stats panel (Success, Profit/Loss, PP1/PP2) Alerts via popup, sound, push, or email Cu
Divergence Bomber
Ihor Otkydach
4.89 (82)
Ogni acquirente dell’indicatore riceverà inoltre gratuitamente: L’utilità esclusiva “Bomber Utility”, che gestisce automaticamente ogni operazione, imposta i livelli di Stop Loss e Take Profit e chiude le posizioni secondo le regole della strategia I file di configurazione (set file) per adattare l’indicatore a diversi asset I set file per configurare il Bomber Utility in tre modalità: “Rischio Minimo”, “Rischio Bilanciato” e “Strategia di Attesa” Una guida video passo-passo per installare, conf
SuperScalp Pro
Van Minh Nguyen
5 (2)
SuperScalp Pro – Sistema avanzato di indicatore per scalping con filtri multipli SuperScalp Pro è un sistema avanzato di indicatore per scalping che combina il classico Supertrend con molteplici filtri di conferma intelligenti. L’indicatore funziona in modo efficiente su tutti i timeframe da M1 a H4 ed è particolarmente adatto per XAUUSD, BTCUSD e le principali coppie Forex. Può essere utilizzato come sistema stand-alone o integrato in modo flessibile nelle strategie di trading esistenti. L’indi
Entry In The Zone and SMC Multi Timeframe is a real-time market analysis tool developed based on Smart Money Concepts (SMC). It is designed to help traders analyze market structure systematically and gain a clearer view of overall market direction. The system analyzes Reversal Points, Key Zones, and Market Structure across multiple timeframes, while displaying Point Of Interest (POI), No Repaint Signals, and Auto Fibonacci Levels to help detect pullbacks and reversal points with precision. Real-
Game Changer è un indicatore di tendenza rivoluzionario, progettato per essere utilizzato su qualsiasi strumento finanziario, per trasformare il tuo Metatrader in un potente analizzatore di trend. L'indicatore non ridisegna e non subisce ritardi. Funziona su qualsiasi intervallo temporale e aiuta a identificare i trend, segnala potenziali inversioni, funge da meccanismo di trailing stop e fornisce avvisi in tempo reale per risposte tempestive del mercato. Che tu sia un trader esperto, un profess
Power Candles MT5
Daniel Stein
5 (5)
Power Candles – Segnali di ingresso basati sulla forza per tutti i mercati Power Candles porta l’analisi di forza collaudata di Stein Investments direttamente sul grafico dei prezzi. Invece di reagire solo al prezzo, ogni candela viene colorata in base alla reale forza di mercato, consentendo di identificare immediatamente accumuli di momentum, accelerazioni della forza e transizioni di trend pulite. Un’unica logica per tutti i mercati Power Candles funziona automaticamente su tutti i simboli di
Azimuth Pro
Ottaviano De Cicco
5 (3)
LAUNCH PROMO Azimuth Pro price is initially set at 299$ for the first 100 buyers. Final price will be 499$ . THE DIFFERENCE BETWEEN RETAIL AND INSTITUTIONAL ENTRIES ISN'T THE INDICATOR — IT'S THE LOCATION. Most traders enter at arbitrary price levels, chasing momentum or reacting to lagging signals. Institutions wait for price to reach structured levels where supply and demand actually shift. Azimuth Pro maps these levels automatically: swing-anchored VWAP, multi-timeframe structure lines, an
TrendMaestro5
Stefano Frisetti
Attenzione alle truffe, questo indicatore e' distribuito esclusivamente su MQL5.com nota: questo indicatore e' per METATRADER5, se vuoi la versione per  METATRADER4 questo e' il link:   https://www.mql5.com/it/market/product/108106 TRENDMAESTRO ver 2.5 TRENDMAESTRO   riconosce un nuovo TREND sul nascere, non sbaglia mai. La sicurezza di identificare un nuovo TREND non ha prezzo. DESCRIZIONE TRENDMAESTRO identifica un nuovo TREND sul nascere, questo indicatore prende in esame la volatilita' i
FX Power MT5 NG
Daniel Stein
5 (31)
FX Power: Analizza la Forza delle Valute per Decisioni di Trading Più Intelligenti Panoramica FX Power è lo strumento essenziale per comprendere la reale forza delle principali valute e dell'oro in qualsiasi condizione di mercato. Identificando le valute forti da comprare e quelle deboli da vendere, FX Power semplifica le decisioni di trading e rivela opportunità ad alta probabilità. Che tu segua le tendenze o anticipi inversioni utilizzando valori estremi di Delta, questo strumento si adatta
Atomic Analyst MT5
Issam Kassas
4.07 (28)
Innanzitutto, vale la pena sottolineare che questo indicatore di trading non è repaint, non è ridisegno e non presenta ritardi, il che lo rende ideale sia per il trading manuale che per quello automatico. Manuale utente: impostazioni, input e strategia. L'Analista Atomico è un indicatore di azione del prezzo PA che utilizza la forza e il momentum del prezzo per trovare un miglior vantaggio sul mercato. Dotato di filtri avanzati che aiutano a rimuovere rumori e segnali falsi, e aumentare il pote
Super Signal – Skyblade Edition Sistema professionale di segnali di tendenza senza repaint / senza ritardo con tasso di vincita eccezionale | Per MT4 / MT5 Funziona meglio su timeframe più bassi, come 1 minuto, 5 minuti e 15 minuti. Caratteristiche principali: Super Signal – Skyblade Edition è un sistema intelligente di segnali progettato specificamente per il trading di tendenza. Utilizza una logica di filtraggio multilivello per identificare esclusivamente i movimenti direzionali forti, supp
Grabber System MT5
Ihor Otkydach
4.82 (22)
Ti presento un eccellente indicatore tecnico: Grabber, che funziona come una strategia di trading "tutto incluso", pronta all’uso. In un solo codice sono integrati strumenti potenti per l’analisi tecnica del mercato, segnali di trading (frecce), funzioni di allerta e notifiche push. Ogni acquirente di questo indicatore riceve anche gratuitamente: L’utility Grabber: per la gestione automatica degli ordini aperti Video tutorial passo dopo passo: per imparare a installare, configurare e utilizzare
Trend Screener Pro MT5
STE S.S.COMPANY
4.84 (100)
Indicatore di tendenza, soluzione unica rivoluzionaria per il trading di tendenze e il filtraggio con tutte le importanti funzionalità di tendenza integrate in un unico strumento! È un indicatore multi-timeframe e multi-valuta al 100% non ridipingibile che può essere utilizzato su tutti i simboli/strumenti: forex, materie prime, criptovalute, indici e azioni. Trend Screener è un indicatore di tendenza che segue un indicatore efficiente che fornisce segnali di tendenza a freccia con punti nel gra
Smart Stop Indicator – Precisione intelligente dello stop-loss direttamente sul grafico Panoramica Smart Stop Indicator è la soluzione ideale per i trader che desiderano posizionare il loro stop-loss in modo chiaro e metodico, senza dover indovinare o affidarsi all’intuizione. Questo strumento combina la logica classica del price action (massimi e minimi strutturali) con un moderno riconoscimento dei breakout per identificare il prossimo livello di stop realmente logico. In trend, in range o i
RelicusRoad Pro: Sistema Operativo Quantitativo di Mercato 70% DI SCONTO ACCESSO A VITA (TEMPO LIMITATO) - UNISCITI A 2.000+ TRADER Perché la maggior parte dei trader fallisce anche con indicatori "perfetti"? Perché operano su Singoli Concetti isolati. Un segnale senza contesto è una scommessa. Per vincere serve CONFLUENZA . RelicusRoad Pro non è un semplice indicatore. È un Ecosistema Quantitativo completo . Mappa la "Fair Value Road", distinguendo tra rumore e rotture strutturali. Smetti di in
Ottieni l’indicatore AUX GRATUITO e il supporto EA Download diretto — Clicca qui [ D.I.C.E ] The DICE Indicator  Divergence in Chaos Environment è uno strumento MT5 specializzato per trader che applicano la Teoria delle Onde di Elliott nel contesto delle tecniche di Trading Chaos. Identifica divergenze nascoste e regolari nell’azione dei prezzi, sincronizzate con l’ambiente di mercato caotico descritto da Bill Williams. Caratteristiche principali Divergenza allineata alle Onde di Elliott: rilev
Trend indicator AI mt5
Ramil Minniakhmetov
5 (13)
Trend Ai indicator è un ottimo strumento che migliorerà l'analisi di mercato di un trader combinando l'identificazione della tendenza con punti di ingresso utilizzabili e avvisi di inversione. Questo indicatore consente agli utenti di navigare nelle complessità del mercato forex con fiducia e precisione Oltre ai segnali primari, l'indicatore Ai di tendenza identifica i punti di ingresso secondari che si presentano durante i pullback o i ritracciamenti, consentendo ai trader di capitalizzare le
Quantum TrendPulse
Bogdan Ion Puscasu
5 (20)
Ecco   Quantum TrendPulse   , lo strumento di trading definitivo che combina la potenza di   SuperTrend   ,   RSI   e   Stocastico   in un unico indicatore completo per massimizzare il tuo potenziale di trading. Progettato per i trader che cercano precisione ed efficienza, questo indicatore ti aiuta a identificare con sicurezza le tendenze di mercato, i cambiamenti di momentum e i punti di entrata e uscita ottimali. Caratteristiche principali: Integrazione SuperTrend:   segui facilmente l'andame
IX Power MT5
Daniel Stein
4.92 (12)
IX Power: Scopri approfondimenti di mercato per indici, materie prime, criptovalute e forex Panoramica IX Power è uno strumento versatile progettato per analizzare la forza di indici, materie prime, criptovalute e simboli forex. Mentre FX Power offre la massima precisione per le coppie di valute utilizzando i dati di tutte le coppie disponibili, IX Power si concentra esclusivamente sui dati di mercato del simbolo sottostante. Questo rende IX Power una scelta eccellente per mercati non correlat
TPSproTREND PrO MT5
Roman Podpora
4.74 (19)
TPSproTrend PRO identifica il momento in cui il mercato cambia effettivamente direzione e forma un punto di ingresso all'inizio del movimento. Si entra nel mercato quando il prezzo sta appena iniziando a muoversi, e non dopo che il movimento si è già verificato.   Indicatore       Non ridisegna i segnali e visualizza automaticamente i punti di ingresso, lo Stop Loss e il Take Profit, rendendo il trading chiaro, visivo e strutturato. ISTRUZIONI RUS   -   VERSIONE MT4 Vantaggi principali Segnali
The AX Forex Indicator MT5 is a sophisticated trading tool designed to provide traders with a comprehensive analysis of multiple currency pairs. This   powerful indicator   simplifies the complex nature of the forex market, making it accessible for both novice and experienced traders. AX Forex Indicator uses   advanced algorithms   to detect trends, patterns and is an essential tool for traders aiming to enhance their forex trading performance. With its robust features, ease of use, and reliabl
FX Levels MT5
Daniel Stein
5 (12)
FX Levels: Supporti e Resistenze di Precisione Eccezionale per Tutti i Mercati Panoramica Rapida Cercate un modo affidabile per individuare livelli di supporto e resistenza in ogni mercato—coppie di valute, indici, azioni o materie prime? FX Levels fonde il metodo tradizionale “Lighthouse” con un approccio dinamico all’avanguardia, offrendo una precisione quasi universale. Basato sulla nostra esperienza reale con i broker e su aggiornamenti automatici giornalieri più quelli in tempo reale, FX
Weis Wave with Alert MT5
Trade The Volume Waves Single Member P.C.
4.94 (17)
Rental/Lifetime Package Options and Privileges  Rent Monthly Six Months   Yearly/Lifetime Weis Wave with Speed with Alert+Speed Index x x x Manual  x x x Quick Set up Video x x x Blog x x x Lifetime Updates x x x Setup and Training Material x x Discord Access Channel "The SI traders"          x Rectangle Break Alert Tool      x How to trade with it:    http://www.tradethevolumewaves.com   ** If you purchase please contact me to setup your  : Training Room and  complete manual access.  Wei
Simboli: USDCHF, USDJPY, XAUUSD, GBPUSD, EURUSD, AUDUSD, GBPJPY (A mo USDCHF_H1 ) Timeframe: M15, H1, H4, D1 Caratteristiche principali: Nessun repaint, nessun ritardo, segnale direzionale, conferme multiple Sicurezza: I segnali includono stop loss, take profit e rispettano la regola rischio/rendimento Include: Scanner multi-timeframe gratuito (Dopo aver acquistato questo prodotto, inviami semplicemente uno screenshot tramite messaggio privato e ti invierò personalmente il file dello scanner
Dark Support Resistance  is an Indicator for intraday trading. This Indicator is programmed to identify  Support and Resistance Lines , providing a high level of accuracy and reliability. Key benefits Easily visible lines Only the most important levels will be displayed Automated adjustment for each timeframe and instrument Easy to use even for beginners Never repaints, never backpaints, Not Lag 100% compatible with Expert Advisor development All types of alerts available: Pop-up, Email, Push
Advanced Supply Demand MT5
Bernhard Schweigert
4.5 (14)
La migliore soluzione per qualsiasi principiante o trader esperto! Questo indicatore è uno strumento di trading unico, di alta qualità e conveniente perché abbiamo incorporato una serie di funzionalità proprietarie e una nuova formula. Con questo aggiornamento, sarai in grado di mostrare fusi orari doppi. Non solo potrai mostrare una TF più alta, ma anche entrambe, la TF del grafico, PIÙ la TF più alta: SHOWING NESTED ZONES. Tutti i trader di domanda di offerta lo adoreranno. :) Informazioni imp
Gold Entry Sniper
Tahir Mehmood
5 (3)
Gold Entry Sniper – Dashboard ATR Multi-Timeframe per Scalping e Swing Trading sull’Oro Gold Entry Sniper è un indicatore avanzato per MetaTrader 5 che offre segnali di acquisto/vendita precisi per XAUUSD e altri strumenti, basato sulla logica ATR Trailing Stop e l' analisi multi-timeframe . Caratteristiche e Vantaggi Analisi Multi-Timeframe – Visualizza trend su M1, M5, M15 in un'unica dashboard. Trailing Stop Basato su ATR – Stop dinamici che si adattano alla volatilità. Dashboard Professional
ARIScalping
Temirlan Kdyrkhan
ARIScalp is a powerful trading companion designed to generate high-probability entry signals with dynamic TP/SL/DP levels based on volatility. Built-in performance tracking shows win/loss stats, PP1/PP2 hits, and success rates all updated live. Key Features: Buy/Sell signals with adaptive volatility bands Real-time TP/SL/DP levels based on ATR Built-in MA Filter with optional ATR/StdDev volatility Performance stats panel (Success, Profit/Loss, PP1/PP2) Alerts via popup, sound, push, or email Cus
Algo Pumping
Ihor Otkydach
4.75 (20)
PUMPING STATION – La tua strategia personale "all inclusive" Ti presentiamo PUMPING STATION — un indicatore Forex rivoluzionario che trasformerà il tuo modo di fare trading in un’esperienza efficace ed entusiasmante. Non si tratta solo di un assistente, ma di un vero e proprio sistema di trading completo con potenti algoritmi che ti aiuteranno a operare in modo più stabile. Acquistando questo prodotto, riceverai GRATUITAMENTE: File di configurazione esclusivi: per un'impostazione automatica e pr
Altri dall’autore
Super Trend eu
Emin Ulucanli
4.83 (6)
SUPERTREND; È un indicatore di trend following basato sull'ATR SuperTrend creato da Olivier Seban. Può essere utilizzato per rilevare i cambiamenti nella direzione del trend e individuare gli arresti. Quando il prezzo scende al di sotto della curva dell'indicatore, diventa rosso e indica una tendenza al ribasso. Al contrario, quando il prezzo si sposta al di sopra della curva, l'indicatore diventa verde, indicando un trend rialzista. Come altri indicatori, funziona bene su SuperTrend se utilizza
FREE
Pivot Classic, Woodie, Camarilla, Fibonacci and Demark Floor/Classic I punti pivot, o semplicemente pivot, sono utili per identificare potenziali livelli di supporto/resistenza, range di trading, inversioni di tendenza e sentiment di mercato esaminando i valori massimi, minimi e di chiusura di un asset. I Pivot Point Floor/Classic possono essere calcolati come segue. Pivot Point (P) = (High + Low + Close)/3 S1 = P * 2 - High S2 = P - (High - Low) S3 = Low – 2*(High - P) R1 = P * 2 - Low R2 = P +
FREE
DONCHIAN CHANNEL DC È un indicatore di tendenza sviluppato da “Richard Donchian”, composto da 3 strati, il canale superiore, il canale inferiore e il canale centrale. Viene creato sul canale Donchian tracciando sul grafico dei prezzi i prezzi più alti e più bassi raggiunti nel periodo passato. Viene utilizzato anche per misurare la volatilità del mercato, in quanto è un canale in espansione/contrazione in base all'aumento/diminuzione della volatilità dei prezzi. Method 0; Disegno dell'indicatore
FREE
TILLSON MOVING AVERAGE Conosciuto anche come indicatore TMA o T3. È una media mobile che utilizza EMA e DEMA nella sua formula ed è calcolata con un'espansione binomiale di 3 grado. Professionisti; 1-       segnali errati riscontrati in altre medie mobili ( zig continuo zag ) è stato ridotto il più possibile. 2-       impedito i ritardi osservati nelle medie mobili classiche . 3-       Molto successo nelle tendenze Contro 1-       Non è efficace nei mercati orizzontali. Parametri di impostazion
FREE
DONCHIAN CHANNEL DC È un indicatore di tendenza sviluppato da “Richard Donchian”, composto da 3 strati, il canale superiore, il canale inferiore e il canale centrale. Viene creato sul canale Donchian tracciando sul grafico dei prezzi i prezzi più alti e più bassi raggiunti nel periodo passato. Viene utilizzato anche per misurare la volatilità del mercato, in quanto è un canale in espansione/contrazione in base all'aumento/diminuzione della volatilità dei prezzi. Method 0; Disegno dell'indicatore
FREE
Pivot Classic, Woodie, Camarilla, Fibonacci and Demark Floor/Classic I punti pivot, o semplicemente pivot, sono utili per identificare potenziali livelli di supporto/resistenza, range di trading, inversioni di tendenza e sentiment di mercato esaminando i valori massimi, minimi e di chiusura di un asset. I Pivot Point Floor/Classic possono essere calcolati come segue. Pivot Point (P) = (High + Low + Close)/3 S1 = P * 2 - High S2 = P - (High - Low) S3 = Low – 2*(High - P) R1 = P * 2 - Low R2 = P
FREE
Filtro:
singroove
579
singroove 2025.08.02 10:27 
 

It is a very good indicator if used correctly as described. Thank you.

Eliana Alves
44
Eliana Alves 2025.07.09 21:52 
 

Estou aprendendo a usar ainda e estou gostando muito

Murat Ergun
20
Murat Ergun 2024.11.18 08:28 
 

Merhaba. Gerçekten çok güzel bir uygulama olmuş. 2 tane ricam olabilirmi? 1.Sadece Alert açıldığında gerçekleşen fiyatı da gösterirseniz daha iyi olacağı kanısındayım. 2.Birde örnek olması adına orjinal kodları da paylaşabilirmisiniz. Tekrar teşekkürler.

Rafal Krzysztof Manuszewski
2387
Rafal Krzysztof Manuszewski 2024.10.06 17:04 
 

👍

Detleff Böhmer
3073
Detleff Böhmer 2023.12.05 09:32 
 

Danke, sehr gute Ergebnisse.

Julpa
182
Julpa 2023.02.24 15:06 
 

L'utente non ha lasciato alcun commento sulla valutazione.

Baki Çetin
50
Baki Çetin 2023.02.23 08:04 
 

L'utente non ha lasciato alcun commento sulla valutazione.

Kong Huang
430
Kong Huang 2023.02.07 11:49 
 

L'utente non ha lasciato alcun commento sulla valutazione.

Findolin
1940
Findolin 2023.02.06 19:14 
 

L'utente non ha lasciato alcun commento sulla valutazione.

Rispondi alla recensione