Pivot classic woodie camarilla fibonacci demark
- Indicadores
- Versão: 1.10
- Atualizado: 28 janeiro 2023

Pivot Classic, Woodie, Camarilla, Fibonacci and Demark
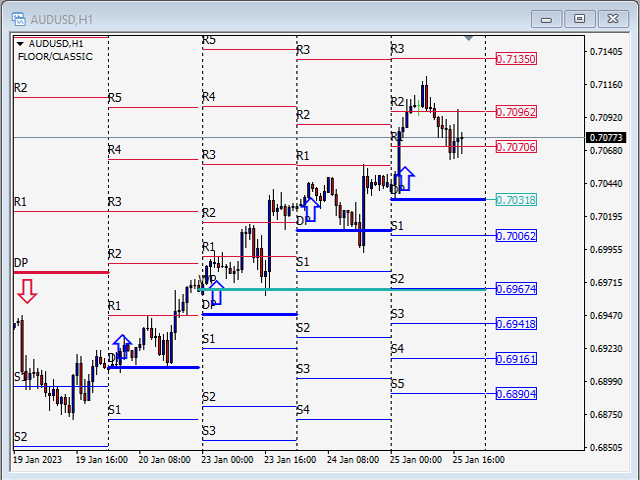
Floor/Classic
Pontos pivô, ou simplesmente pivôs, são úteis para identificar possíveis níveis de suporte/resistência, faixas de negociação, reversões de tendência e sentimento do mercado, examinando os valores alto, baixo e de fechamento de um ativo. Os Pontos Pivot Floor/Classic podem ser calculados da seguinte forma.
Pivot Point (P) = (High + Low + Close)/3
S1 = P * 2 - High
S2 = P - (High - Low)
S3 = Low – 2*(High - P)
R1 = P * 2 - Low
R2 = P + (High - Low)
R3 = High + 2*(P - Low)
Woodie
Ele difere do método padrão de cálculo do ponto de pivô. Ele usa a diferença entre o máximo e o mínimo do dia anterior, também conhecido como intervalo, para calcular os níveis de suporte e resistência. Alguns traders preferem usar as fórmulas Woodie, pois dão mais peso ao preço de fechamento do período anterior. Os Pontos Pivot Woodie podem ser calculados da seguinte forma.
R2 = P + (H - L)
R1 = (2 * P) - LOW
P = (HIGH + LOW + (CLOSE * 2)) / 4
S1 = (2 * P) - HIGH
S2 = P - (H - L)
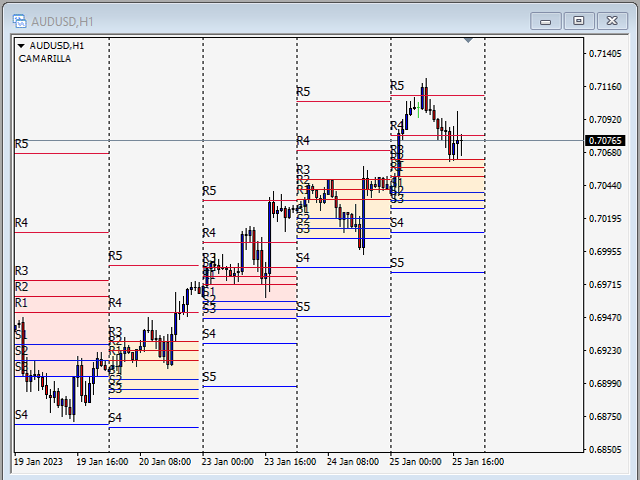
Camarilla
As fórmulas Camarilla são semelhantes à fórmula Woodie. Sua ideia básica é que o preço tende a voltar à sua média. Os níveis Camarilla ajudam a direcionar com precisão as ordens de stop loss e de lucro. Os níveis mais importantes são S3, S4 e R3, R4. Os Pontos Pivot Camarilla podem ser calculados da seguinte forma.
R4 = ((High - Low) * 1.1) / 2 + Close
R3 = ((High - Low) * 1.1) / 4 + Close
R2 = ((High - Low) * 1.1) / 6 + Close
R1 = ((High - Low) * 1.1) / 12 + Close
S1 = Close - ((High - Low) * 1.1) / 12
S2 = Close - ((High - Low) * 1.1) / 6
S3 = Close - ((High - Low) * 1.1) / 4
S4 = Close - ((High - Low) * 1.1) / 2
Fibonacci
Os níveis do ponto de pivô Fibonacci são determinados calculando primeiro o ponto de pivô, como no método padrão. Em seguida, multiplique o intervalo do dia anterior pelo nível Fibonacci correspondente. A maioria dos traders usa correções de 38,2%, 61,8% e 100% em seus cálculos. A lógica por trás disso é que muitos traders usam probabilidades Fibonacci. Os Pontos Pivot Fibonacci podem ser calculados da seguinte forma.
Pivot Point (P) = (High + Low + Close)/3
Support 1 (S1) = P - (0.382 * (High - Low))
Support 2 (S2) = P - (0.6182 * (High - Low))
Support 3 (S3) = P - (1 * (High - Low))
Resistance 1 (R1) = P + (0.382 * (High - Low))
Resistance 2 (R2) = P + (0.6182 * (High - Low))
Resistance 3 (R3) = P + (1 * (High - Low))
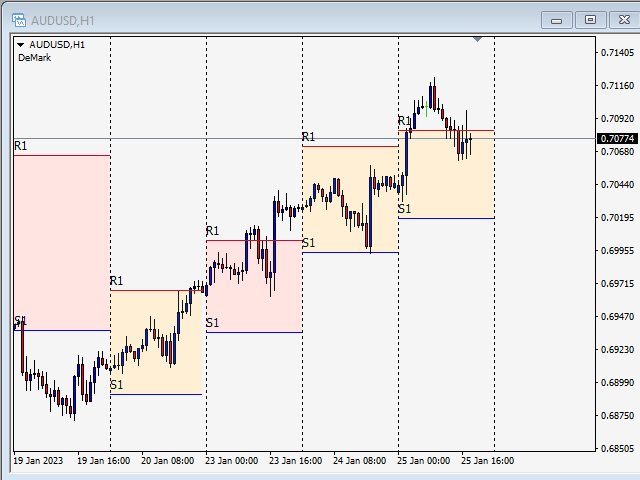
Demark
Esses pontos de pivô têm uma natureza condicional que dá mais ênfase aos movimentos recentes de preços com base na relação entre o preço de abertura e o preço de fechamento. Os Pontos Pivot Demark podem ser calculados da seguinte forma.
If Close < Open, then X = High + (2 * Low) + Close
If Close > Open, then X = (2 * High) + Low + Close
If Close = Open, then X = High + Low + (2 * Close)
Support 1 (S1) = X/2 - High
Resistance 1 (R1) = X/2 - Low
O usuário não deixou nenhum comentário para sua avaliação