Visual Momentum Wave Sync Indicator
- Indicatori
-
AL MOOSAWI ABDULLAH JAFFER BAQER
 To trade successfully we need to go through the proven path that others had gone and reached!
Here are 17 quotes from such successful investors:
1- Limit your size in any position so that fear does not become the prevailing instinct guiding your judgment.
Joe Vidich - Versione: 1.0
- Attivazioni: 5
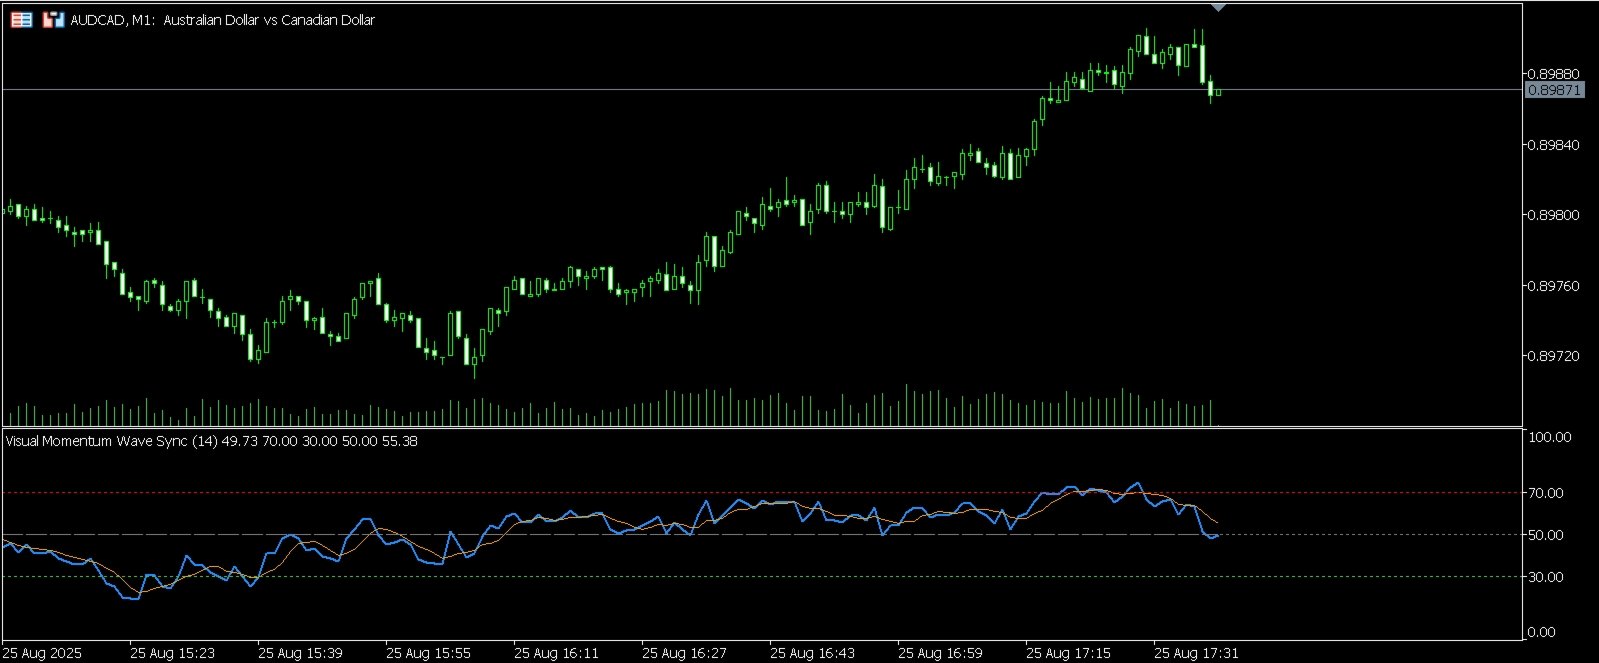
Visual Momentum Wave Sync: Master Market Momentum with Unmatched Clarity
Unlock the market's rhythm and trade with confidence for just $30!
Are you tired of noisy indicators that clutter your charts and provide conflicting signals? Do you struggle to accurately gauge market momentum and identify high-probability entry and exit points? The Visual Momentum Wave Sync indicator is the definitive tool designed to solve these problems, offering a crystal-clear view of market dynamics for traders who demand precision.
This is not just another oscillator. It is a complete, fully customizable trading indicator engineered to synchronize your trades with the true momentum of the market.
The Core Logic: A Refined Approach to Momentum
At its heart, the Visual Momentum Wave Sync indicator utilizes the robust and time-tested principles of the Relative Strength Index (RSI). However, it elevates this classic concept with a sophisticated calculation engine and superior visual design.
The indicator meticulously analyzes price changes over a user-defined period. It calculates the average magnitude of recent gains and losses, then applies Wilder's Smoothing method. Unlike a simple moving average, this advanced smoothing technique gives more weight to recent price action, creating a responsive yet smooth momentum wave that accurately reflects current market sentiment without the distracting noise of minor fluctuations.
This core value is plotted as the "Momentum Wave," a fluid line that oscillates between 0 and 100, providing an intuitive measure of market strength and weakness.
Key Features That Give You an Edge
-
Advanced Momentum Wave Calculation: Go beyond standard RSI with our refined Wilder's Smoothing algorithm for a more accurate and timely representation of market momentum.
-
Fully Customizable Thresholds: Define your own overbought and oversold zones with adjustable upper and lower levels. The default 70/30 levels are a great starting point, but you have complete control to adapt the indicator to any asset or timeframe, from volatile crypto markets to stable forex pairs.
-
Critical Mid-Level Line: The 50-level line acts as a crucial equilibrium point. When the Momentum Wave crosses above 50, it signals that bullish strength is taking control. A cross below indicates bears are gaining the upper hand. Use it as a powerful filter to confirm trends and avoid false signals.
-
Optional Signal Smoothing: Activate the "Smoothed Wave" feature to apply an additional moving average to the main momentum line. This provides a secondary, slower line that can be used for crossover signals, helping you filter out market noise and confirm entries with greater confidence.
-
Intuitive Visual Interface: We believe a powerful indicator should also be easy to read. The indicator window features color-coded zones that instantly show you whether the market is overbought, oversold, or in a neutral phase. Every line is fully customizable in color, style, and width, allowing you to tailor the visual experience to your preference.
-
Comprehensive Customization: Nearly every aspect of the indicator can be fine-tuned. Adjust the wave period, the price source (Close, Open, High, Low, Median, etc.), and smoothing periods to perfectly match your trading strategy.
Actionable Trading Strategies
The Visual Momentum Wave Sync indicator is designed for practical application. Here are a few ways to integrate it into your trading system:
-
Overbought and Oversold Reversals: The classic strategy, perfected. When the Momentum Wave moves above the upper threshold (e.g., 70), the market is considered overbought and may be due for a correction. Look for sell opportunities as the wave peaks and turns down. Conversely, when the wave dips below the lower threshold (e.g., 30), the market is oversold. Look for buy opportunities as it bottoms out and starts to rise.
-
Mid-Level Trend Confirmation: Use the 50-level crossover as a powerful trend filter. A decisive cross above 50 confirms bullish momentum, making it an ideal time to enter or add to long positions. A cross below 50 confirms bearish momentum, signaling a good time to seek short entries.
-
Divergence Trading: Identify powerful, high-probability reversals before they happen.
-
Bullish Divergence: If the price chart makes a lower low, but the Momentum Wave makes a higher low, it signals that bearish momentum is fading. This is a strong indication that the price may soon reverse to the upside.
-
Bearish Divergence: If the price chart makes a higher high, but the Momentum Wave makes a lower high, it signals that bullish momentum is weakening. This is a classic warning sign of a potential reversal to the downside.
-
Why Choose Visual Momentum Wave Sync?
Built by traders for traders, this indicator combines a proven analytical foundation with the flexibility and visual clarity required by modern market conditions. You are not just buying a line on a chart; you are investing in a versatile tool that helps you understand market psychology, identify trends, and time your entries and exits with surgical precision.
Stop guessing and start trading in sync with the market's true momentum.
Add the Visual Momentum Wave Sync to your trading arsenal today for only $30 and elevate your technical analysis to a professional level.