Gunn Crosses

Gunn Crosses: Svela la Geometria del Mercato con le Croci di Gann e i Metodi di Trading di W.D. Gann!

Desideri approfondire la tua analisi tecnica sfruttando la potente geometria dei quadrati di Gann? L'indicatore Gunn Crosses ti offre un modo unico per visualizzare i livelli di supporto e resistenza calcolati in base alle croci diagonali e cardinali del leggendario quadrato di Gann, un elemento chiave nell'arsenale completo delle tecniche di trading impiegate da William Delbert Gann.

Questo indicatore è uno strumento prezioso per i trader che cercano di identificare potenziali punti di inversione e livelli di prezzo chiave, basandosi sui principi sviluppati da uno dei trader più rinomati ed enigmatici di tutti i tempi: William Delbert Gann. Comprendere la sua filosofia e i suoi metodi può espandere significativamente le tue capacità di trading.

William Delbert Gann: Una Leggenda dell'Analisi Tecnica:

W.D. Gann (1878-1955) fu un eminente analista finanziario, trader di borsa e autore di numerosi libri e corsi sull'analisi tecnica. La sua ricerca sui mercati spaziava dalla matematica alla geometria, all'astronomia e persino agli antichi sistemi numerologici. Gann credeva che i mercati operassero secondo specifiche leggi matematiche e cicli ricorrenti che potevano essere previsti utilizzando i suoi metodi unici.

Le sue tecniche di trading erano caratterizzate da complessità e precisione. Gann impiegava una varietà di strumenti, tra cui gli angoli di Gann, i ventagli di Gann, i quadrati di Gann (in particolare il Quadrato del Nove, l'Esagono e il Cerchio di 360), i cicli temporali e le date chiave. Il suo obiettivo non era solo determinare la direzione del movimento dei prezzi, ma anche prevedere con precisione il momento delle inversioni e i livelli target.

Aspetti Chiave dell'Approccio di Trading di Gann:

  • Geometria del Mercato: Gann attribuiva grande importanza alle relazioni geometriche sui grafici dei prezzi. Credeva che certi angoli e figure formassero livelli naturali di supporto e resistenza. I quadrati di Gann sono un'incarnazione di questo principio, dove le relazioni prezzo-tempo sono visualizzate in forme geometriche.
  • Cicli Temporali: Gann studiava meticolosamente i cicli di varia durata, credendo che i movimenti del mercato fossero governati da ritmi specifici. Cercava di identificare questi cicli per prevedere le future inversioni.
  • Angoli di Gann: Le linee tracciate ad angoli specifici (più comunemente 45, 90, 180 gradi) da massimi o minimi significativi erano considerate livelli importanti di supporto e resistenza. L'intersezione di questi angoli spesso indicava potenziali cambiamenti di tendenza.
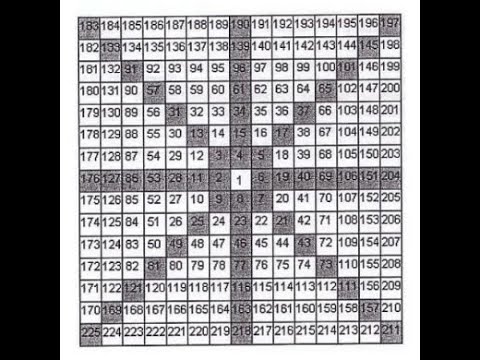
  • Quadrati di Gann: Questi strumenti combinano le relazioni prezzo-tempo in un formato quadrato. Le linee diagonali e cardinali dei quadrati di Gann, che costituiscono la base dell'indicatore Gunn Crosses, sono considerate livelli particolarmente significativi.
  • Numerologia e Astrologia: Sebbene questi aspetti siano più esoterici, Gann esplorava anche l'influenza delle sequenze numeriche e dei fattori astronomici sulla dinamica del mercato.

Principi Fondamentali dell'Indicatore Gunn Crosses:

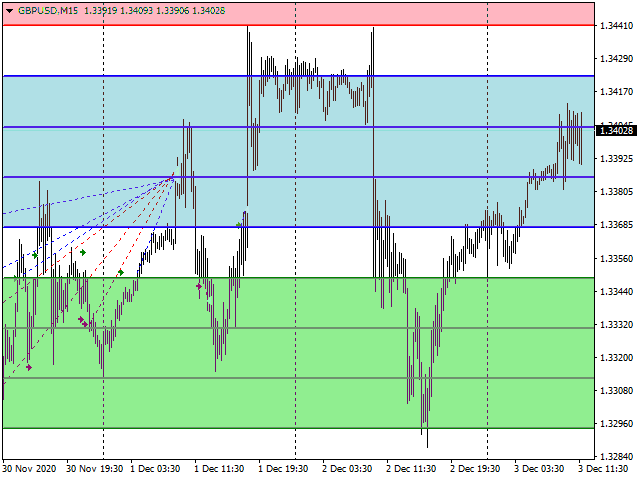
L'indicatore Gunn Crosses calcola e visualizza automaticamente importanti livelli di supporto e resistenza sul tuo grafico, formati dall'intersezione delle croci diagonali e cardinali del quadrato di Gann. Queste croci sono elementi chiave nell'approccio analitico di Gann, aiutando a identificare le aree in cui il prezzo può incontrare una resistenza significativa o trovare supporto.

  • Croce Cardinale: Formata da linee orizzontali e verticali che si intersecano al prezzo base scelto. La linea orizzontale rappresenta il livello di prezzo stesso, e la linea verticale può essere considerata un asse temporale relativo a questo prezzo.
  • Croce Diagonale: Consiste in due linee tracciate ad angoli di 45 gradi rispetto alle linee orizzontali e verticali della croce cardinale. Queste linee riflettono la relazione prezzo-tempo 1:1, che, secondo la teoria di Gann, è un fattore cruciale nella determinazione del movimento futuro dei prezzi.

L'intersezione di queste linee crea potenziali livelli di supporto e resistenza che i trader possono utilizzare per determinare i punti di ingresso e di uscita dal mercato, nonché per impostare ordini stop-loss e take-profit.

Flessibilità nella Definizione del Prezzo Base:

Una delle caratteristiche chiave dell'indicatore è la sua flessibilità nella scelta del prezzo rispetto al quale vengono costruite le croci di Gann. Puoi utilizzare:

  • Prezzo Attuale: Il calcolo dei livelli verrà eseguito dinamicamente, rispetto all'ultimo prezzo sul grafico. Ciò ti consente di tracciare i livelli attuali di supporto e resistenza in tempo reale.
  • Prezzo Definito dall'Utente: Utilizzando il parametro Price, puoi specificare manualmente un valore di prezzo particolare che verrà utilizzato come base per il calcolo dei livelli. Ciò può essere utile per analizzare rispetto a massimi, minimi storici o altri punti di prezzo significativi che ritieni possano influenzare l'azione futura dei prezzi.

Utilizzo di una Porzione della Formazione dei Prezzi:

L'indicatore Gunn Crosses offre anche la possibilità di utilizzare solo una porzione del prezzo per calcolare i livelli. Ciò si ottiene tramite le impostazioni Digit e minus_znak, che ti consentono di isolare cifre specifiche del prezzo per l'analisi.

Esaminiamo in dettaglio come funzionano queste impostazioni utilizzando l'esempio del prezzo attuale 1.23456:

  • Se l'impostazione Digit è impostata su _5____, per il calcolo verrà utilizzato il numero 23456. Ciò significa che l'indicatore prenderà le ultime cinque cifre del prezzo. Questo approccio può essere utile per analizzare movimenti di prezzo più piccoli o per identificare livelli correlati a cifre significative specifiche.
  • Per il valore _6____, verrà utilizzato il numero 123456 (tutte e sei le cifre). Questo è l'approccio standard, che utilizza tutte le informazioni sui prezzi disponibili.
  • Per il valore __4____, verrà utilizzato il numero 3456 (le cifre dalla terza alla sesta). Questo potrebbe essere utile se ritieni che determinate cifre del prezzo abbiano una maggiore influenza sulla formazione dei livelli.
  • Per il valore ___3___, verrà utilizzato il numero 456 (le ultime tre cifre). Simile al precedente, ciò ti consente di concentrarti sulle fluttuazioni di prezzo a più breve termine.
  • Per il valore ____2__, verrà utilizzato il numero 56 (le ultime due cifre). Questa opzione potrebbe essere interessante per un'analisi a brevissimo termine o per strumenti ad alta volatilità.

L'impostazione minus_znak ti consente di rimuovere un certo numero di cifre a destra della porzione di prezzo selezionata. Considera un esempio in cui Digit è impostato su _5____ (che risulta nel numero 23456) :

  • Se minus_znak è impostato su _0, il numero che forma il prezzo sarà 23456. Ciò significa che la porzione di prezzo selezionata viene utilizzata senza modifiche.
  • Con un valore di _1, verrà utilizzato il numero 2345 (l'ultima cifra rimossa). Ciò può aiutare a identificare livelli di supporto e resistenza più grossolani.
  • Con un valore di _2, verrà utilizzato il numero 234 (le ultime due cifre rimosse). Un'ulteriore semplificazione della base di prezzo può rivelare livelli a lungo termine ancora più significativi.

Queste impostazioni consentono ai trader di concentrarsi su aspetti specifici del prezzo che considerano più significativi per la loro analisi, il che può essere particolarmente utile quando si lavora con strumenti che hanno un gran numero di decimali o quando si applicano approcci numerologici specifici di Gann.

Visualizzazione delle Croci:

L'indicatore Gunn Crosses fornisce all'utente un controllo completo sulla visualizzazione delle croci di Gann sul grafico. Utilizzando le impostazioni corrispondenti, puoi:

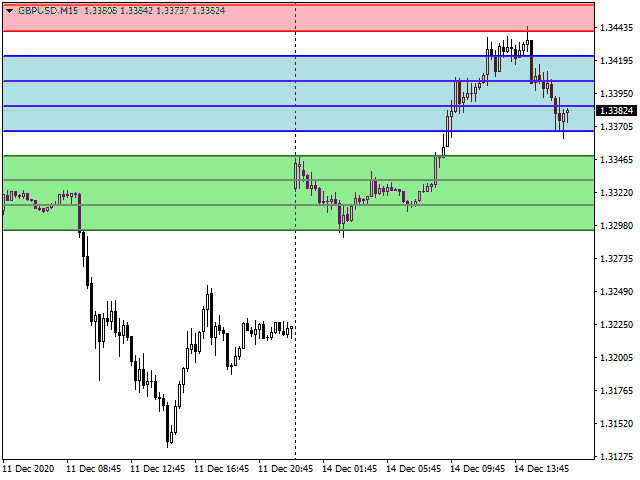
  • Abilitare o disabilitare la visualizzazione della croce cardinale. La croce cardinale è costituita da linee orizzontali e verticali che si intersecano al prezzo base. La linea orizzontale segna chiaramente il livello di prezzo che funge da base per la costruzione di altri livelli, e la linea verticale può essere utilizzata per l'orientamento visivo nel tempo rispetto a questo livello di prezzo.
  • Abilitare o disabilitare la visualizzazione della croce diagonale. La croce diagonale è costituita da due linee tracciate ad angoli di 45 gradi rispetto alle linee orizzontali e verticali della croce cardinale. Queste linee riflettono la relazione prezzo-tempo 1:1 chiave nella teoria di Gann, dove un'unità di variazione di prezzo corrisponde a un'unità di variazione di tempo. L'intersezione di queste linee diagonali con i movimenti di prezzo può indicare importanti punti di supporto e resistenza, nonché potenziali momenti di accelerazione o decelerazione del trend.

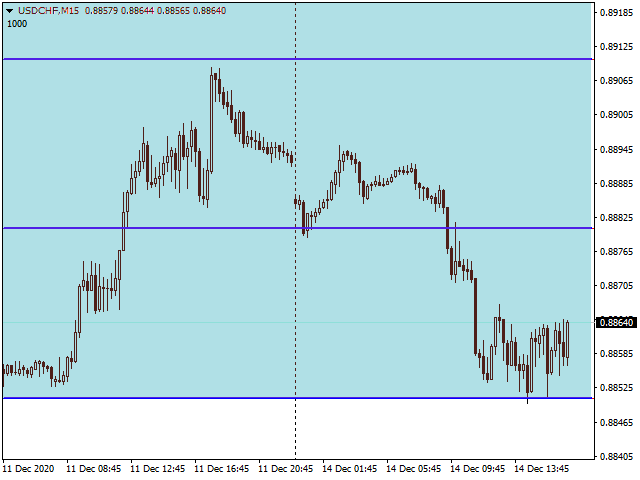
La possibilità di controllare indipendentemente la visualizzazione delle croci cardinali e diagonali consente ai trader di personalizzare la visualizzazione dell'indicatore in base alle proprie esigenze analitiche ed evitare di sovraccaricare il grafico con informazioni non necessarie, concentrandosi solo sugli elementi più importanti per la propria strategia di trading attuale.

Impostazioni di Visualizzazione:

Per garantire un lavoro confortevole con l'indicatore Gunn Crosses, sono fornite ampie impostazioni per personalizzare la visualizzazione visiva di linee ed etichette. Puoi regolare individualmente il colore delle linee delle croci cardinali e diagonali, nonché il colore del testo delle etichette che visualizzano i livelli di prezzo. Ciò ti consente di adattare l'aspetto dell'indicatore allo schema di colori del tuo grafico e rendere l'analisi più comoda e intuitiva, facilitando la percezione visiva dei livelli chiave di supporto e resistenza.

Applicazione dell'Indicatore Gunn Crosses in una Strategia di Trading:

L'indicatore Gunn Crosses può essere utilizzato in vari modi all'interno di una strategia di trading:

  • Identificazione dei Livelli di Supporto e Resistenza: Le linee delle croci possono fungere da livelli statici da cui il prezzo può rimbalzare o che può attraversare.
  • Ricerca di Punti di Inversione: Il prezzo che attraversa le linee delle croci può indicare potenziali cambiamenti di tendenza.
  • Impostazione dei Livelli Target: Le intersezioni delle linee delle croci cardinali e diagonali possono essere utilizzate come guide per l'impostazione degli ordini take-profit.
  • Identificazione delle Zone di Consolidamento: La convergenza delle linee delle croci può indicare periodi di movimento laterale dei prezzi.
  • Filtraggio dei Segnali: L'indicatore può essere utilizzato insieme ad altri strumenti di analisi tecnica per confermare i segnali di trading.

Vantaggi dell'Utilizzo dell'Indicatore Gunn Crosses:

  • Visualizza i livelli chiave di supporto e resistenza basati sulla geometria fondamentale dei quadrati di Gann.
  • Selezione flessibile del prezzo base per il calcolo dei livelli (attuale o definito dall'utente), consentendo di adattare l'indicatore a vari scenari analitici.
  • Capacità di utilizzare una porzione del prezzo per un'analisi più approfondita e specifica, coerente con le tecniche avanzate di Gann.
  • Controllo indipendente sulla visualizzazione delle croci cardinali e diagonali per ottimizzare la visualizzazione del grafico.
  • Ampia gamma di impostazioni per personalizzare il colore di linee ed etichette per una visualizzazione confortevole e una migliore percezione delle informazioni.
  • Aiuta a identificare potenziali punti di inversione e obiettivi di prezzo, tenendo conto delle relazioni geometriche e temporali.
  • Integra un potente strumento analitico, basato sui principi di uno dei trader più influenti, nella tua piattaforma di trading.

L'indicatore Gunn Crosses diventerà una preziosa aggiunta al tuo arsenale di strumenti di analisi tecnica, aiutandoti a svelare la geometria nascosta del mercato e a prendere decisioni di trading più informate utilizzando i potenti metodi sviluppati dal grande W.D. Gann! Approfondisci la tua comprensione del suo approccio unico ed eleva il tuo trading a un nuovo livello di comprensione dei modelli di mercato.


Prodotti consigliati
Auto Fibo Pro m
DMITRII GRIDASOV
Indicatore "Auto FIBO Pro" Crypto_Forex: è un ottimo strumento ausiliario nel trading! - L'indicatore calcola e posiziona automaticamente sul grafico i livelli di Fibo e le linee di tendenza locali (colore rosso). - I livelli di Fibonacci indicano le aree chiave in cui il prezzo può invertirsi. - I livelli più importanti sono 23,6%, 38,2%, 50% e 61,8%. - Puoi usarlo per lo scalping di inversione o per il trading di zone grid. - Ci sono molte opportunità per migliorare il tuo sistema attuale usa
Chinetti pip collector XL is a complete turnkey trading system. If a trader does not yet have his own trading system, he can apply Chinetti pip collector XL to trading. Trading with this indicator is very easy. Even a beginner in Forex can handle it. Trading rules: wait for the indicator to start drawing a blue line. This means that the price trend is starting now. Now we are waiting for the indicator to analyze the market and draw an up arrow on the chart. At this point, we open a buy order.
Price Magnet — Price Density and Attraction Levels Indicator Price Magnet is a professional analytical tool designed to identify key support and resistance levels based on statistical Price Density. The indicator analyzes a specified historical period and detects price levels where the market spent the most time. These zones act as “magnets,” attracting price action or forming a structural base for potential reversals. Unlike traditional Volume Profile tools, Price Magnet focuses on price-time d
Deal Trading SPT
Sukunthakan Ngernbamrung
Deal Trading SPT (Super Trend) is an indicator, shows the market trend direction, entry position, take profit level, stop loss level and trend strength. Utility Help to further filter and develop strategy to trade Market overview on the chart Stop loss and take profit calculation with market volatility Resistance and support for trialing stop No repaint after the finished bar Works in any timeframe and financial instrument, including forex, CFD and crypto etc. Message pop-up, notification with
Trend PA
Mikhail Nazarenko
5 (3)
The Trend PA indicator uses   Price Action   and its own filtering algorithm to determine the trend. This approach helps to accurately determine entry points and the current trend on any timeframe. The indicator uses its own algorithm for analyzing price changes and Price Action. Which gives you the advantage of recognizing, without delay, a new nascent trend with fewer false positives. Trend filtering conditions can be selected in the settings individually for your trading style. The indicator
Crosskalp1
Mikhail Bilan
Добрый День уважаемые трейдеры!  Вашему вниманию индикатор созданный и работающий на базе трендовика ADX,  для торговли на смене направления движения который учитывает коррекцию и даёт возможность на ней заработать.  Применяю этот индикатор для скальпинга. Рекомендую таймфреймы от 15 ти минутного(М15) до часового (Н1) периодов.  Красный кружок сигнал на продажу- Sell) Зелёный кружок  сигнал на покупку Buy) Чем меньше ваш таймфрейм тем меньше пунктов вы зарабатываете.   Важно выставлять стопы! !В
Diamond Trend
Segundo Calvo Munoz
Indicator which identifies Trend and also buy/sell opportunities. Use for entries aligned to the Trend.  Although Diamond Trend is very accurate identifying entry points, it is always recommended to use a support indicator in order to reconfirm the operation. Remind to look for those Assets and Timeframes which best fit to your trader behavior/need... Valid for Scalping and Long Term operations. Please, set up a Bars Chart to be able to visualize the indicator properly...  ...And remind to give
VR Cub
Vladimir Pastushak
VR Cub è un indicatore per ottenere punti di ingresso di alta qualità. L'indicatore è stato sviluppato per facilitare i calcoli matematici e semplificare la ricerca dei punti di ingresso in una posizione. La strategia di trading per la quale è stato scritto l'indicatore ha dimostrato la sua efficacia per molti anni. La semplicità della strategia di trading è il suo grande vantaggio, che consente anche ai trader alle prime armi di commerciare con successo con essa. VR Cub calcola i punti di apert
Harvest GOLD
Sayan Vandenhout
Harvest GOLD USES THE TREND WAVE INDICATOR AND IT CAN IDENTIFY THE BEGINNING AND THE END OF A NEW WAVE TREND MOVEMENT. AS AN OSCILLATOR, THE INDICATOR IDENTIFIES THE OVERBOUGHT AND OVERSOLD ZONES. IT WORKS GREAT TO CATCH THE SHORT TERM PRICE REVERSALS AND USES A MARTINGALE STRATEGY TO CLOSE ALL TRADES IN PROFIT. USE DEFAULT SETTINGS ON H1 OR HIGHER TIME FRAME ON ANY PAIR FOR MORE ACCURATE TRADES WHY THIS EA : Smart entries calculated by 3 great strategies The EA can be run on even a $30000
Anubis Skunk
Sayan Vandenhout
Anubis Skunk USES THE TREND WAVE INDICATOR AND IT CAN IDENTIFY THE BEGINNING AND THE END OF A NEW WAVE TREND MOVEMENT. AS AN OSCILLATOR, THE INDICATOR IDENTIFIES THE OVERBOUGHT AND OVERSOLD ZONES. IT WORKS GREAT TO CATCH THE SHORT TERM PRICE REVERSALS AND USES A MARTINGALE STRATEGY TO CLOSE ALL TRADES IN PROFIT. USE DEFAULT SETTINGS ON H1 OR HIGHER TIME FRAME ON ANY PAIR FOR MORE ACCURATE TRADES WHY THIS EA : Smart entries calculated by 5 great strategies The EA can be run on even a $20000
Vanglutio
Sayan Vandenhout
VANGLUTIO USES THE TREND WAVE INDICATOR AND IT CAN IDENTIFY THE BEGINNING AND THE END OF A NEW WAVE TREND MOVEMENT. AS AN OSCILLATOR, THE INDICATOR IDENTIFIES THE OVERBOUGHT AND OVERSOLD ZONES. IT WORKS GREAT TO CATCH THE SHORT TERM PRICE REVERSALS AND USES A MARTINGALE STRATEGY TO CLOSE ALL TRADES IN PROFIT. USE DEFAULT SETTINGS ON H1 OR HIGHER TIME FRAME ON ANY PAIR FOR MORE ACCURATE TRADES WHY THIS EA : Smart entries calculated by 5 great strategies The EA can be run on even a $20000 ac
Robot scalper per timeframe M5. Negozia sulla coppia di valute GBPUSD. Questo robot è stato sviluppato appositamente da un'azienda di trader professionisti per il trading con la sterlina. Il robot apre approssimativamente da 5 a 15 operazioni al giorno. È meglio fare trading con broker che hanno uno spread basso su GBPUSD fino a 10 pip. Il deposito minimo consigliato per iniziare è di $ 500 o più. vantaggi: non usa martingala. non una rete. ogni operazione ha uno stop loss. bot professionale s
"Adjustable Fractals" - è una versione avanzata dell'indicatore frattale, uno strumento di trading molto utile! - Come sappiamo, l'indicatore MT4   Standard fractals non ha impostazioni, il che è molto scomodo per i trader. - Adjustable Fractals ha risolto questo problema, ha tutte le impostazioni necessarie: - Periodo regolabile dell'indicatore (valori consigliati: superiori a 7). - Distanza regolabile dai massimi/minimi del prezzo. - Design regolabile delle frecce frattali. - L'indicatore è d
Trend Ray
Andriy Sydoruk
The indicator shows the potential trend direction by cyclical-wave dependence. Thus, all the rays of the intersection will be optimal rays, in the direction of which the price is expected to move, taking into account the indicator period. Rays can be used as a direction for potential market movement. But we must not forget that the approach must be comprehensive, the indicator signals require additional information to enter the market.
Gold Phoenix
Yaroslav Varankin
The perfect tool for Scalng in the Forex markets You can trade both from signal to signal and using take profit  The algorithm does not use Zigzag!  No redrawing!  This is a channel instrument that uses a moving average as a filter. Moving Average  There are 2 parameters for the settings Ma Period = 5 period Moving Average  Channel 1.0 distance of channel lines from the chart Price Signal Filter - calculation of signal opening and filter There is a complete set of Alert There is a multi-timefram
Night ghost
Dmitriy Kashevich
Night Ghost - Indicatore a freccia per opzioni binarie. Questo è un assistente affidabile per te in futuro! - Nessun ridisegno sul grafico -Funziona alla grande su tutte le coppie di valute! -Precisione dell'indicatore fino al 90% (soprattutto di notte) -Non c'è bisogno di impostare per molto tempo (impostato perfettamente per le opzioni binarie) - Segnali non in ritardo - La comparsa di un segnale sulla candela corrente -Perfetto per il periodo M1 (non più!) - Colore della candela ad
Fiery Pinnacle FX
Sayan Vandenhout
Fiery Pinnacle USES THE TREND WAVE INDICATOR AND IT CAN IDENTIFY THE BEGINNING AND THE END OF A NEW WAVE TREND MOVEMENT. AS AN OSCILLATOR, THE INDICATOR IDENTIFIES THE OVERBOUGHT AND OVERSOLD ZONES. IT WORKS GREAT TO CATCH THE SHORT TERM PRICE REVERSALS AND USES A MARTINGALE STRATEGY TO CLOSE ALL TRADES IN PROFIT. USE DEFAULT SETTINGS ON H1 OR HIGHER TIME FRAME ON ANY PAIR FOR MORE ACCURATE TRADES WHY THIS EA : Smart entries calculated by 4 great strategies The EA can be run on even a $300
Zig Zag Robot: A Comprehensive Reversal Trading System The Zig Zag Robot is a powerful tool designed to accurately identify key market reversals and filter out market "noise." It goes beyond a simple Zig Zag indicator by combining multiple tools and built-in logic to provide you with ready-to-use trading signals and help you make more informed decisions. How It Works The indicator uses a multi-level approach to market analysis, which allows it to find high-probability entry points: Signal Filter
MA Alignment Scanner
Benedict Jamora
5 (1)
This indicator scans and displays currency pairs that have recently aligned moving averages on a given timeframe. You can configure which pairs the indicator will scan. It also includes all types of alert options. Bullish MA Alignment =  MA1>MA2>MA3>MA4>MA5 Bearish MA Alignment =  MA1<MA2<MA3<MA4<MA5 Features Attach to one chart and scans all the currency pairs configured and visible in the Market Watch Window It can monitor all the available timeframes from M1 to MN1 and sends alerts on every
VandoraFX Gold
Sayan Vandenhout
VANDORA FX USES THE TREND WAVE INDICATOR AND IT CAN IDENTIFY THE BEGINNING AND THE END OF A NEW WAVE TREND MOVEMENT. AS AN OSCILLATOR, THE INDICATOR IDENTIFIES THE OVERBOUGHT AND OVERSOLD ZONES. IT WORKS GREAT TO CATCH THE SHORT TERM PRICE REVERSALS AND USES A MARTINGALE STRATEGY TO CLOSE ALL TRADES IN PROFIT. USE DEFAULT SETTINGS ON H1 OR HIGHER TIME FRAME ON ANY PAIR FOR MORE ACCURATE TRADES WHY THIS EA : Smart entries calculated by 5 great strategies The EA can be run on even a $20000 a
Delta Pairs
Anatolii Zainchkovskii
Delta Pairs is an indicator for pair trading, it displays the divergence of two currency pairs. Does not redraw. A useful tool for the analysis of the behavior of two currency pairs relative to each other. Purpose The Delta Pairs indicator is designed for determining the divergences in the movements of two currency pairs. This indicator is displayed as two line charts and the difference (delta) between these charts in the form of a histogram. The Delta Pairs indicator will be useful for those w
Rira Renko
Vitor Palmeira Abbehusen
RENKO on Time Chart This indicator is an enhanced Renko, so you can watch the Renko bricks on the chart to understand price movement more clearly the other improvement is automated box size according to ATR (Average True Range) period you can set the ATR number as you want and the box size of Renko changes automatically based on price movement Inputs Mode: Box size is the input to specify the size of the Renko box you want to print on the chart. This input lets you choose the fixed box siz
MESA Spectrum
Christopher Kryza
The MESA Spectrum indicator calculates the power spectrum of a data series using the Maximum Entropy Spectrum Estimation method and produces a power spectrum plot. The Maximum Entropy algorithm, unlike a simple FFT transform, will include frequencies from the entire complex frequency plane and not just the Nyquist interval which, in general terms, means that it can resolve cycle periods that are larger than the data window passed to the function. In addition, MESA has the ability to fit very sha
GJ Options
Sayan Vandenhout
GJ OPTIONS USES THE TREND WAVE INDICATOR AND IT CAN IDENTIFY THE BEGINNING AND THE END OF A NEW WAVE TREND MOVEMENT. AS AN OSCILLATOR, THE INDICATOR IDENTIFIES THE OVERBOUGHT AND OVERSOLD ZONES. IT WORKS GREAT TO CATCH THE SHORT TERM PRICE REVERSALS AND USES A MARTINGALE STRATEGY TO CLOSE ALL TRADES IN PROFIT. USE DEFAULT SETTINGS ON H1 OR HIGHER TIME FRAME ON ANY PAIR FOR MORE ACCURATE TRADES WHY THIS EA : Smart entries calculated by 5 great strategies The EA can be run on even a $20000 account
Order Blocks Breaker
Suvashish Halder
5 (2)
Introducing Order Blocks Breaker , a brand-new way to identify and leverage order blocks in your trading strategy. After developing multiple order block tools with unique concepts, I’m proud to present this tool that takes things to the next level. Unlike previous tools, Order Blocks Breaker not only identifies order blocks but also highlights Breaker Order Blocks —key areas where the price is likely to retest after a breakout. MT5 -  https://www.mql5.com/en/market/product/124102/ This tool inco
Vanexio
Sayan Vandenhout
VANEXIO USES THE TREND WAVE INDICATOR AND IT CAN IDENTIFY THE BEGINNING AND THE END OF A NEW WAVE TREND MOVEMENT. AS AN OSCILLATOR, THE INDICATOR IDENTIFIES THE OVERBOUGHT AND OVERSOLD ZONES. IT WORKS GREAT TO CATCH THE SHORT TERM PRICE REVERSALS AND USES A MARTINGALE STRATEGY TO CLOSE ALL TRADES IN PROFIT. USE DEFAULT SETTINGS ON H1 OR HIGHER TIME FRAME ON ANY PAIR FOR MORE ACCURATE TRADES WHY THIS EA : Smart entries calculated by 5 great strategies The EA can be run on even a $20000 acco
FREE
Quantum Falcon Signal Free is a smart visual trading indicator for MetaTrader 4 designed for Forex and Gold traders. The indicator combines: • Trend analysis • RSI momentum confirmation • MACD momentum filtering • ATR volatility filtering • Higher timeframe confirmation • Smart exit signal detection Main Features: • Smart Buy and Sell signals • Exit Buy / Exit Sell alerts • Real-time dashboard on chart • Professional candle arrows • Multi-timeframe trend confirmation • ATR market volatility filt
FREE
FX Flow
Eva Stella Conti
FX Flow   indicator can be used as an anticipator of the next trend, preferably confirmed by Price Action or another oscillator (RSi, Stochastic ..). It takes the money flows of the major currencies USD EUR GBP AUD NZD CAD CHF JPY into account, and processes them. Excellent tool for indices, but also for correlations between currencies. Works on each timeframes.  Blue line: Bull market Yellow line: Bear market Note : if the indicator opens the window, but does not draw lines, load the historie
Range Predictor
Suvashish Halder
Introducing the Range Predictor : Your Ultimate Guide to Future Trading Ranges! Imagine having the power to see into the future of market moves— Range Predictor brings this dream to life. Designed to deliver real-time, predictive support and resistance levels , this tool goes beyond standard indicators, offering trend direction insights and precise range forecasts . Whether you're a day trader or a swing trader, the Range Predictor is your all-in-one toolkit for mastering the markets. MT5 Ver
Renko, Heiken Ashi, Ticks Bar, Range Bar.    Easy switching, easy setup, all in one window.        Place the Custom Chart indicator and view Renko, Heiken Ashi, Tick bar, Range bar charts in real time at real chart.    Position the offline chart window so that the indicator control panel is visible.    Switch the chart mode by click of a button.    Connect to the output chart any indicator, expert advisor without any restrictions.    No, it doesn't work in the tester.    Yes, you can use an
Gli utenti di questo prodotto hanno anche acquistato
Neuro Poseidon MT4
Daria Rezueva
4.84 (43)
Neuro Poseidon is a new indicator by Daria Rezueva. It combines precise trading signals with adaptive TP/SL levels - creating best possible trades as a result! Message me and get  Neuro Poseidon Assistant  as a gift to automize your trading process! What makes it stand out? 1. Proven profitability on all assets and timeframes 2. Only confirmed BUY and SELL signals present on the chart 3. Adaptive TP & SL levels generated by the software for each trade 4. Easy to understand - suitable for all
Gann Made Easy
Oleg Rodin
4.84 (167)
Gann Made Easy è un sistema di trading Forex professionale e facile da usare che si basa sui migliori principi del trading utilizzando la teoria di mr. WD Gann. L'indicatore fornisce segnali ACQUISTA e VENDI accurati, inclusi i livelli di Stop Loss e Take Profit. Puoi fare trading anche in movimento utilizzando le notifiche PUSH. CONTATTAMI DOPO L'ACQUISTO PER RICEVERE GRATUITAMENTE LE ISTRUZIONI DI TRADING E OTTIMI INDICATORI EXTRA! Probabilmente hai già sentito parlare molte volte dei metodi d
Super Signal – Skyblade Edition Sistema professionale di segnali di tendenza senza repaint / senza ritardo con tasso di vincita eccezionale | Per MT4 / MT5 Funziona meglio su timeframe più bassi, come 1 minuto, 5 minuti e 15 minuti. Caratteristiche principali: Super Signal – Skyblade Edition è un sistema intelligente di segnali progettato specificamente per il trading di tendenza. Utilizza una logica di filtraggio multilivello per identificare esclusivamente i movimenti direzionali forti, supp
Questo prodotto è stato aggiornato per il mercato 2026 e ottimizzato per le ultime build di MT5. AVVISO DI AGGIORNAMENTO PREZZO: Smart Trend Trading System è attualmente disponibile a $99 . Il prezzo aumenterà a $199 dopo i prossimi 30 acquisti . OFFERTA SPECIALE: Dopo aver acquistato Smart Trend Trading System, inviami un messaggio privato per ricevere Smart Universal EA GRATIS e trasformare i tuoi segnali Smart Trend in operazioni automatiche. Smart Trend Trading System è un sistema di tradin
Neo Wave PRO
Nikolay Raykov
5 (1)
Price & Time Market Structure Indicator A professional market structure tool that analyzes waves through both price and time — not price alone. Main Description NeoWave PRO is a professional market structure indicator for MetaTrader 4 designed for traders who want to move beyond traditional one-dimensional wave tools such as ZigZag, swing indicators, and basic high/low systems. Most wave indicators analyze only one thing: Price. But a real market wave is not only a price movement. A true wave de
M1 Sniper
Oleg Rodin
5 (24)
M1 SNIPER è un sistema di indicatori di trading facile da usare. Si tratta di un indicatore a freccia progettato per l'intervallo temporale M1. L'indicatore può essere utilizzato come sistema autonomo per lo scalping sull'intervallo temporale M1 e come parte del tuo sistema di trading esistente. Sebbene questo sistema di trading sia stato progettato specificamente per il trading sull'intervallo temporale M1, può comunque essere utilizzato anche con altri intervalli temporali. Inizialmente ho pro
Trend Catcher ind
Ramil Minniakhmetov
5 (10)
INDICATORE TREND CATCHER L'indicatore Trend Catcher analizza i movimenti dei prezzi di mercato, utilizzando una combinazione di indicatori di analisi del trend proprietari dell'autore e personalizzati. Identifica la vera direzione del mercato filtrando il rumore a breve termine e concentrandosi sulla forza del momentum sottostante, sull'espansione della volatilità e sul comportamento della struttura dei prezzi. Utilizza inoltre una combinazione di indicatori personalizzati di smoothing e filtr
Dynamic Forex28 Navigator
Bernhard Schweigert
4.43 (7)
Dynamic Forex28 Navigator - Lo strumento di trading Forex di nuova generazione. ATTUALMENTE SCONTATO DEL 49%. Dynamic Forex28 Navigator è l'evoluzione dei nostri indicatori popolari di lunga data, che combinano la potenza di tre in uno: Advanced Currency Strength28 Indicator (695 recensioni) + Advanced Currency IMPULSE con ALERT (520 recensioni) + CS28 Combo Signals (Bonus). Dettagli sull'indicatore https://www.mql5.com/en/blogs/post/758844 Cosa offre l'indicatore di forza di nuova generazione?
ORB Seeker
Marcela Goncalves De Oliveira
Prezzo speciale di lancio! Solo 79 dollari! Il prezzo aumenterà dopo 10 vendite, prezzo finale $199. Dopo l'acquisto, contattami per ricevere un Expert Advisor (EA) bonus GRATUITO in grado di automatizzare completamente i segnali di breakout e di fornire file di configurazione ottimizzati. Individua con sicurezza le eruzioni cutanee durante le sessioni di allenamento! ORB Seeker è un indicatore ORB (Opening Range Breakout) professionale, pensato per i trader che desiderano precisione, semplici
Indicatore Miraculous – Strumento Forex e Binario 100% Non-Repaint Basato sul Quadrato di Nove di Gann Questo video presenta l' Indicatore Miraculous , uno strumento di trading altamente accurato e potente, sviluppato specificamente per i trader di Forex e Opzioni Binarie . Ciò che rende unico questo indicatore è la sua base sul leggendario Quadrato di Nove di Gann e sulla Legge della Vibrazione di Gann , rendendolo uno degli strumenti di previsione più precisi disponibili nel trading moderno. L
Advanced Supply Demand
Bernhard Schweigert
4.91 (300)
Speciale Trading- SCONTO DEL 30% La soluzione migliore per qualsiasi trader principiante o esperto! Questo indicatore è uno strumento di trading unico, di alta qualità e conveniente, perché abbiamo incorporato una serie di funzionalità proprietarie e una nuova formula. Con questo aggiornamento, potrai visualizzare doppie zone di timeframe. Non solo potrai visualizzare un TF più alto, ma anche entrambi, il TF del grafico e il TF più alto: MOSTRA ZONE ANNIDATE. Tutti i trader che operano con Of
ATTUALMENTE SCONTATO DEL 40% La soluzione migliore per ogni principiante o trader esperto! Questo indicatore è uno strumento di trading unico, di alta qualità e conveniente perché abbiamo incorporato una serie di caratteristiche proprietarie e una nuova formula. Con un solo grafico è possibile leggere la forza delle valute per 28 coppie Forex! Immaginate come migliorerà il vostro trading perché sarete in grado di individuare l'esatto punto di innesco di una nuova tendenza o di un'opportunità
PZ Trend Trading
PZ TRADING SLU
4.8 (5)
Capture every opportunity: your go-to indicator for profitable trend trading Trend Trading is an indicator designed to profit as much as possible from trends taking place in the market, by timing pullbacks and breakouts. It finds trading opportunities by analyzing what the price is doing during established trends. [ Installation Guide | Update Guide | Troubleshooting | FAQ | All Products ] Trade financial markets with confidence and efficiency Profit from established trends without getting whips
PRO Renko System
Oleg Rodin
5 (30)
PRO Renko System è un sistema di trading altamente accurato appositamente progettato per il trading di grafici RENKO. Questo è un sistema universale che può essere applicato a vari strumenti di trading. Il sistema neutralizza efficacemente il cosiddetto rumore di mercato che consente di accedere a segnali di inversione accurati. L'indicatore è molto facile da usare e ha un solo parametro responsabile della generazione del segnale. Puoi facilmente adattare lo strumento a qualsiasi strumento di
Scientific trade
Aleksey Ivanov
5 (1)
An extremely convenient indicator that truly makes the process of making money on the exchange easy. It is based on the scientifically rigorous theory of the market developed by the author, the beginning of which is presented here .                The full algorithm of this indicator operation is presented in the article .               The indicator calculates the most probable price movement trajectory and displays it on the chart. Based on the predicted price movement trajectory
Atomic Analyst
Issam Kassas
5 (8)
Questo prodotto è stato aggiornato per il mercato 2026 e ottimizzato per le ultime build di MT5. AVVISO DI AGGIORNAMENTO PREZZO: Atomic Analyst è attualmente disponibile a $99 . Il prezzo aumenterà a $199 dopo i prossimi 30 acquisti . OFFERTA SPECIALE: Dopo aver acquistato Atomic Analyst, inviami un messaggio privato per ricevere Smart Universal EA GRATIS e trasformare i tuoi segnali Atomic Analyst in operazioni automatiche. Atomic Analyst è un indicatore di trading Price Action non-repainting
M1 Quantum
Hamed Dehgani
M1 Quantum è un sistema di trading professionale per M1 che fornisce segnali di trading rapidi e precisi con Stop Loss, Take Profit e gestione intelligente del capitale integrati. M1 Quantum include un sistema professionale di gestione del capitale progettato per far crescere rapidamente il conto concentrandosi su vittorie consecutive . Caratteristiche principali dell' Indicatore M1 Quantum Progettato per il time frame M1 e tutte le principali coppie di valute Tutti i trade hanno Stop Loss e Tak
Market Structure Patterns MT4
Samuel Manoel De Souza
5 (18)
Market Structure Patterns   è un indicatore basato sui   Smart Money Concepts   che mostra gli   elementi SMC/ICT   che possono portare le tue decisioni di trading a un livello superiore. Approfitta di   alert ,   notifiche push   e   email   per essere avvisato quando si forma un elemento sul grafico, il prezzo supera un livello e/o entra in una zona. Gli sviluppatori possono accedere ai valori degli elementi dell’indicatore utilizzando le   variabili globali , consentendo l’automazione delle d
Scalping Lines System  - è un sistema di trading scalping specificamente progettato per il trading dell'oro, l'asset XAUUSD, su timeframe M1-H1. Combina indicatori per l'analisi di trend, volatilità e ipercomprato/ipervenduto, riuniti in un unico oscillatore per l'identificazione di segnali a breve termine. I principali parametri interni per le linee di segnale sono preconfigurati. Alcuni parametri possono essere modificati manualmente: "Durata dell'onda di tendenza", che regola la durata di un
Friends, we present to your attention our new Forex Gump Laser indicator. Since there are no designers in our team, but mainly mathematicians, financiers, programmers and traders, we did not make any special changes in the indicator design. In appearance, it resembles the usual Forex Gump. On the other hand, Forex Gump has become not just the name of an indicator, it is a brand. And we try to preserve the corporate identity in all its varieties. The whole essence of the indicator in its operatio
Scalper Inside PRO
Alexey Minkov
4.68 (69)
Scalper Inside PRO Scalper Inside PRO is an intraday trend and scalping indicator that uses exclusive built-in algorithms to evaluate market direction and key target levels. The indicator automatically calculates entry and exit points and several profit target levels, and it shows detailed performance statistics, so you can see how different instruments and strategies behaved on historical data. This helps you select instruments that fit current market conditions. You can also connect your own a
System Trend Pro
Aleksandr Makarov
5 (2)
System Trend Pro - This is the best trend trading indicator!!! The indicator no repaint!!!  The indicator has   MTF   mode, which adds confidence to trading on the trend (   no repaint   ). How to trade? Everything is very simple, we wait for the first signal (big arrow), then wait for the second signal (small arrow) and enter the market in the direction of the arrow. (See screens 1 and 2.) Exit on the opposite signal or take 20-30 pips, close half of it, and keep the rest until the opposite
Documentation for connecting Metatrader 4 with Python with a simple drag and drop EA.   A full end-to-end solution ,fully tested ,fast and efficient! The Pytrader ecosystem consists of a python script and a MT4 EA. (  MT5  version ) Further for the licensing an indicator is used.  The communication between the python script and the EA is based on sockets. EA is the  Server   and the python script the  Client .  It is always query(function / python script) and output(data / server). The EA doe
KURAMA GOLD SIGNAL PRO (MT4) — Filtro a 7 livelli · TP/SL automatico · Punteggio di qualità · Salvataggio dello storico dei segnali | Sistema di trading completo per XAUUSD Nessun ridisegno (repaint) in tempo reale. Nell'istante in cui appare un segnale, freccia, ingresso, TP e SL vengono bloccati sul posto e non si spostano mai più. Ciò che fai tradare è proprio questo segnale in tempo reale. E nella v7.20, ogni segnale realmente inviato viene salvato automaticamente e ripristinato con esattez
BTMM State Engine Pro is a MetaTrader 4 indicator for traders who use the Beat The Market Maker approach: Asian session context, kill zone timing, level progression, peak formation detection, and a multi-pair scanner from a single chart. It combines cycle state logic with a built-in scanner dashboard so you do not need the same tool on many charts at once. What it does Draws the Asian session range; session times can follow broker server offset or be set in inputs. Tracks level progression (L
MetaBands M4
Vahidreza Heidar Gholami
3.5 (6)
MetaBands uses powerful and unique algorithms to draw channels and detect trends so that it can provide traders with potential points for entering and exiting trades. It’s a channel indicator plus a powerful trend indicator. It includes different types of channels which can be merged to create new channels simply by using the input parameters. MetaBands uses all types of alerts to notify users about market events. Features Supports most of the channel algorithms Powerful trend detection algorith
Divergence indicator 10 different indicators. Finding and displaying classic and hidden divergences. Indicators in which divergences are searched: MACD MACD Histogram; RSI; Stochastic; CCI; momentum; OBV; VWmacd; Chaikin Money Flow; Money Flow Index. This is a replica of the indicator from the tradingview resource, adapted for the MT4 terminal. MT5 version available here:  https://www.mql5.com/en/market/product/87879 Settings: Bars in history for analysis - number of bars for analysis; Diver
RelicusRoad Pro
Relicus LLC
4.65 (107)
RelicusRoad Pro: Sistema Operativo Quantitativo di Mercato 70% DI SCONTO ACCESSO A VITA (TEMPO LIMITATO) - UNISCITI A 2.000+ TRADER Perché la maggior parte dei trader fallisce anche con indicatori "perfetti"? Perché operano su Singoli Concetti isolati. Un segnale senza contesto è una scommessa. Per vincere serve CONFLUENZA . RelicusRoad Pro non è un semplice indicatore. È un Ecosistema Quantitativo completo . Mappa la "Fair Value Road", distinguendo tra rumore e rotture strutturali. Smetti di in
Enigmera
Ivan Stefanov
5 (8)
ENIGMERA: Il cuore del mercato Importante: La demo di MQL5.com funziona nel Strategy Tester e potrebbe non riflettere completamente le funzionalità di Enigmera. Consulta la descrizione, gli screenshot e il video per maggiori dettagli. Non esitare a inviarmi un messaggio se hai domande! Il codice dell'indicatore è stato completamente riscritto. La versione 3.0 aggiunge nuove funzionalità e corregge i bug accumulati dall'inizio dell'indicatore. Introduzione Questo indicatore e sistema di trading
KT Alpha Hunter Arrows MT4
KEENBASE SOFTWARE SOLUTIONS
La maggior parte degli indicatori a frecce ti dà un segnale e poi ti lascia capire da solo tutto il resto. KT Alpha Hunter Arrows ti offre un piano di trading completo. Ogni freccia di segnale viene visualizzata con un piano già tracciato: linea di ingresso, stop loss, quattro livelli di take profit e un verdetto edge in tempo reale che ti indica se quel simbolo e quel timeframe meritano di essere tradati in quel momento. Il pacchetto include un Trade Manager EA che gestisce l’esecuzione dopo il
Altri dall’autore
Line Profit
Iurii Tokman
5 (4)
Line Profit   Indicator of the visual line of profit in the deposit currency. Works only if there are open positions in the market for the symbol on which the indicator is installed. You can move the line with the mouse or enable automatic tracking of the Bid price. Description of indicator settings: colotLine - line color WidthLine - line width colotText - text color FontSize - the height of the text Anchor - an anchor method for text FollowBid - follow the Bid price
FREE
StopLevel
Iurii Tokman
StopLevel   The meter controls the STOPLEVEL level. When the level changes, it signals with an alert. STOPLEVEL - the   minimum offset in points from the current closing price for placing Stop orders, or the minimum allowable stop loss / take profit level in points. A zero value of STOPLEVEL means either the absence of a restriction on the minimum distance for stop loss / take profit, or the fact that the trading server uses external mechanisms for dynamic level control that cannot be transmitte
FREE
ChannelRSI5
Iurii Tokman
5 (5)
ChannelRSI5   The Relative Strength Index (RSI) indicator with dynamic levels of overbought and oversold zones. Dynamic levels change and adjust to the current changes in the indicator and prices, and represent a kind of channel. Indicator settings period_RSI - Averaging period for calculating the RSI index. applied_RSI - The applied price. It can be any of the price constants: PRICE_CLOSE - Closing price, PRICE_OPEN - Opening price, PRICE_HIGH - Maximum price for the period, PRICE_LOW - Minimum
FREE
MovingInWL
Iurii Tokman
MovingInWL   The Expert Advisor is designed to move the stop of open positions to no loss when they reach a certain predetermined profit level. Description of the advisor settings: MagicNumber - order identifier LevelProfit - The level of profit in points that the position must reach in order for its stop to be moved to the level without loss. LevelWLoss - The level without loss in points, to which the stop position will be transferred after its profit reaches the   LevelProfit   level in points
FREE
Comb
Iurii Tokman
The indicator displays a grid in the form of a "honeycomb" or regular hexagon. An alternative to the standard grid of the terminal. Description of the indicator settings: color_comb - grid color width - width, for example: 22 for a screen resolution of 1920*1080, 15 for a screen resolution of 1366*768, etc. height - height, for example: 6 for a screen resolution of 1920*1080, 4 for a screen resolution of 1366*768, etc.
FREE
Indicatore Ombre: Svela il Potere Nascosto di Ogni Candela! Sei stanco di un'analisi superficiale dell'azione dei prezzi? Desideri una comprensione più profonda della forza di acquirenti e venditori in ogni intervallo temporale? Ti presentiamo l' Indicatore Ombre – il tuo strumento indispensabile per visualizzare e analizzare le dinamiche nascoste del mercato! Questo potente indicatore trasforma la battaglia invisibile tra tori e orsi, riflessa nella dimensione delle ombre delle candele, in un i
FREE
Robo T
Iurii Tokman
Robo T Expert Advisor is a non-indicator trading system. Expert Advisor settings: Level_ord - distance from the current price for placing initial pending Buy Stop and Sell Stop orders, the default value is 22. Lot_1 - initial lot for buy series, the default value is 0.1. Lot_2 - initial lot for sell series, the default value is 0.1. TakeProfit - profit level, the default value is 30. TSProfitOnly - only profit is trailed. If disabled, trailing is also performed in the negative stop-loss area. Th
Hammering
Iurii Tokman
Hammering is an automated trading system which works on any currency pair. Multi-currency and single-currency trading is performed. Making decisions the EA uses signals of the Slope Direction Line indicator. Settings. Profit_Percent_AccountEquity = 0.4; - profit as percentage of free margin Fix_AccountEquity = 0; - fixed level of free margin FIX_PROFIT = 1000; - fixed level of profit period = 55; - indicator period. FilterNumber = 2; - indicator filter. ma_method = 3; - indicator averaging metho
Robo Grid FX
Iurii Tokman
ROBO GRID FX is a grid Expert Advisor. It is developed for intraday trading in the active market and on fast currency pairs. This is a grid EA with a closed-loop averaging system. The closed-loop averaging system represents a stable strategy of moving to breakeven in case of the deposit drawdown on fast and aggressive currency pairs. The EA places a grid of pending orders in both directions and locks it on the breakthrough of a quote fluctuation in the channel of 40-60 points in case of an unrpo
Crazy Scalper
Iurii Tokman
3.5 (4)
The Crazy Scalper trading robot does not use any indicators. It utilizes a scalping system, which trades in two directions simultaneously (buys and sells). Two opposite positions cannot bring profit at the same time, one of them will be losing. If there is a losing position, a lock is used. If the locking position fails and price reverses to the opposite, teh robot moves it to breakeven using the averaging system and pending orders. Settings TakeProfit = 3; - the take profit in points; Lock_Lev
Pyramid MA
Iurii Tokman
5 (1)
Pyramid MA - Characteristics of the EA: uses Moving Averages (MA) indicator. Changes order grid when a trend reverses. Exponent of order volume increase by the main trading grid against averaging positions. Works on pending BUYSTOP and SELLSTOP orders. Uses a system of averaging losses which controls a balance of open trades and moves it to breakeven. Sound alert about open and completed trades. You can easily create your own trading strategy on the basis of PYRAMID MA. Expert Advisor settings:
Boom
Iurii Tokman
The Expert Advisor is based on the indicator analysis. Trading decisions are made using Moving Average values. Indicators can be configured by external variables: TF = 0 - select a working timeframe. It can be one of the chart periods. 0 means the current chart period. 1 - 1 minute. 5 - 5 minutes. 15 - 15 minutes. 30 - 30 minutes. 60 - 1 hour. 240 - 4 hours. 1440 - 1 day. 10 080 - 1 week. 43 200 - 1 month. shift = 0 - index of obtained value from the indicator buffer (shifting back by specified
Forex Jumper
Iurii Tokman
1 (1)
Forex Jumper is an Expert Advisor for trading EURJPY. Candlestick pattern analysis is used for generating trading signals. The EA uses BUYSTOP and SELLSTOP pending orders. Settings: Lot = 0 - manual setup of the opened orders' volume Risk = 13 - MM risk percentage, the parameter works if Lot = 0 MagicNumber = 208 - ID of EA orders and positions, magic number TP = 20 - virtual profit level in points if there is a single unidirectional open position on the market TP2 = 20 - virtual profit level in
Bands Jazz
Iurii Tokman
Bands Jazz EA is based on the analysis of the Bollinger Bands indicator. The EA algorithm is simple - it uses Stop Loss, Take Profit and Trailing Stop. Settings TimeBeginHour —trading start hour. Values 0 to 24. TimeBeginMinute —trading start minute. Values 0 to 60. TimeEndHour —trading end hour. Values 0 to 24. TimeEndMinute —trading end minute. Values 0 to 60. period —averaging period for Bollinger Bands calculations. deviation —number of standard deviations from the main line for Bollinger B
Smart YTG
Iurii Tokman
4.6 (5)
Smart YTG has been developed for trading GBPUSD on the H1 chart. This is a trend following system and works well during trending price behavior using STOP orders. It detects trend by analyzing the Price Channel indicator which is built straight into the Expert Advisor, therefore you do not need to additionally install any indicator. On the flat areas where the market is undecided, and further movement of the market is being determined, a breakeven function is activated, and if there are open pos
Eureka Lock
Iurii Tokman
The Eureka Lock Expert Advisor detects flat price movement intervals relative to the specified settings. Trading is performed by BUY STOP and SELL STOP pending orders from the borders of the defined flat. Instead of limiting the losses, a loss-making position is locked by an increased volume. A virtual profit level is used as well. Settings: TF_flet = 15 - timeframe a flat is detected at Bars_flet = 25 - amount of bars for a flat detection extern int Size_flet = 30 - distance limit between the
The product shows general information in a single chart window. It is convenient when you trade many symbols simultaneously. The indicator shows the total number of positions and pending orders. The following info is displayed for opened positions: symbol, amount of opened buy orders for this symbol and their total profit in deposit currency, amount of opened sell orders and their total profit, total profit of opened buy and sell orders. The following info is displayed for pending orders: symbol
Moving Average. Calculation method: average value of all prices used for determining a bar. Description of External Settings of the EA: MA_period - period of averaging for calculation of the indicator. Recommended values: 5, 13, 21, 34. ma_method - averaging method. It can have any values ​​of the Moving Average method (Moving Average). 0 - (SMA) Simple Moving Average. 1 - (EMA) Exponential Moving Average. SMMA 2 - (SMMA) Smoothed Moving Average. LWMA 3 - (LWMA) Linear weighed Moving Average.
Description of the Settings: MA_period_fast - The period of averaging for calculation of fast Moving Average. MA_period_slow - The period of averaging for calculation of slow Moving Average. price - price used. It can be any of the price constants. 0 - (CLOSE) Close price. 1 - (OPEN) Open price. 2 - (HIGH) The maximum price. 3 - (LOW) The minimum price. 4 - (MEDIAN) The average price, (high+low)/2. 5 - (TYPICAL) Typical price, (high+low+close)/3. 6 - (WEIGHTED) Weighed close price, (high+low+clo
The Piramida Grid EA analyzes the values of the Slope Direction Line indicator for determining position entry. The grid of orders changes once the market reverses. Works on pending BUYSTOP and SELLSTOP orders. Uses a system of averaging losses which controls a balance of open trades and moves it to breakeven. Automatic detection of 4 and 5 decimal places. Expert Advisor Setup: period = 32; - period for the Slope Direction Line indicator FilterNumber = 2; - Slope Direction Line filter setup ma_m
The Martin Pristine trading robot analyzes the signals of the Price Channel Central indicator for trading decisions. No need to additionally attach the indicator to a chart, it's built into the Expert Advisor. After each losing trade, the lot is multiplied by 2. This Expert Advisor can detect 4 and 5-digit quotes automatically. Only one position can be open in the market at the same time. Expert Advisor settings: TF = 15; - select the chart timeframe for Price Channel Central Bars_Count = 100;
The Future Price indicator shows the probable variants of a future price movement based on the searching for matches in the quotes history. The indicator works in two modes: the first iterates over and displays the specified number of variants, the second - the indicator displays one specified variant. Settings Static_VARIANTS = 0; - display a specific variant; if = 0, iterates over all variants TOTAL_VARIANTS = 20; - the number of variants in the set, not greater than 30 is recommended Time_Se
Reanimator
Iurii Tokman
This is a semi-automatic trading robot. Buttons are used to open/close positions. Further position tracking is performed automatically by virtual profit level. Loss-making positions are averaged by increased/decreased lots. The buttons do not work in the strategy tester meaning that you can check the EA only on demo and real accounts. Special settings OPEN_BUY and OPEN_SELL can be used to test the EA in the strategy tester. Settings MagicNumber - identifier of the EA's orders. The robot works o
The indicator determines flat areas of the price movement according to the specified parameters. Settings: FletPips - limit in points for determining the flat FletBars - limit in number of bars for determining the flat CountBars - number of bars in history for the analysis of price movement. 0 - all bars in history are analyzed colir - color of the price section determined as flat Dop - additional drawing of price labels Alerts - display a dialog box with custom data Text - custom text for notif
Bar Boss
Iurii Tokman
5 (1)
The Expert Advisor uses the FletBoxPush indicator for market analysis and for determining trading signals. The indicator is built into the Expert Advisor, there is no need to additionally run it on a chart. The EA trades breakouts of certain levels determined as flat borders. The EA uses Stop Loss. Description of EA Parameters TimeFrames chart period required for the indicator colour - the color of the price zone defined as flat, a setting for the indicator Rectangle - show price zones defined
BarKhan
Iurii Tokman
The BarKhan indicator is calculated as sum of differences of three digital moving averages. The calculation formula is as follows: the difference of digital moving averages 1 and 2 is added to the difference of digital moving averages 2 and 3 Description of the indicator settings: MA_Period1 - the period of the first digital moving average MA_Period2 - the period of the second digital moving average MA_Period3 - the period of the third digital moving average
Octet
Iurii Tokman
Multi-currency indicator, analyzes 56 currency pairs simultaneously. It is important that all currency pairs are selected in the market watch with their history data downloaded. The indicator shows a rise or fall of a certain currency against the other 7 currencies as a total in the form of a line. The indicator values are expressed as a percentage. Description of the indicator settings Type_Calculation - three options for calculating the percentage of the currency rise or fall Prefix - used wh
Multi-currency indicator, analyzes 56 currency pairs simultaneously: AUD EUR GBP NZD CAD CHF JPY USD AUD SUMM EURAUD GBPAUD AUDNZD AUDCAD AUDCHF AUDJPY AUDUSD EUR EURAUD SUMM EURGBP EURNZD EURCAD EURCHF EURJPY EURUSD GBP GBPAUD EURGBP SUMM GBPNZD GBPCAD GBPCHF GBPJPY GBPUSD NZD AUDNZD EURNZD GBPNZD SUMM NZDCAD NZDCHF NZDJPY NZDUSD CAD AUDCAD EURCAD GBPCAD NZDCAD SUMM CADCHF CADJPY USDCAD CHF AUDCHF EURCHF GBPCHF NZDCHF CADCHF SUMM CHFJPY USDCHF JPY AUDJPY EURJPY GBPJPY NZDJPY CADJPY CHFJPY SUMM
Firm
Iurii Tokman
The Expert Advisor does not use indicator, it is always in the market. The logic of the EA is based on the analysis of the previously opened orders present in the market. Expert Advisor settings: StopLoss_Percent - loss level in percent TakeProfit - profit level in points Risk - setting for automatic calculation of order volumes for the EA, works if LOT =0 LOT - fixed volume of orders Slippage - maximum allowed price slippage MagicNumber - magic number for EA's orders Show_Information - enable o
Grid Flat
Iurii Tokman
The Expert Advisor places a grid of orders with the specified step. Orders have the take profit level set at the distance of grid step, as well as the total stop loss level for all order of the same type. Trading is performed only within the time interval specified in the settings. Once the time ends, all pending orders are deleted and all open positions are force-closed. It is not recommended to use the EA as a fully automated trading system for continuous trading, only for working in certain m
Filtro:
Nessuna recensione
Rispondi alla recensione