Gunn Crosses

Gunn Crosses: Gann Çaprazları ve W.D. Gann'ın Ticaret Yöntemleriyle Piyasa Geometrisini Keşfedin!

Gann karelerinin güçlü geometrisini kullanarak teknik analizlerinizi derinleştirmek mi istiyorsunuz? Gunn Crosses göstergesi, efsanevi Gann karesinin diyagonal ve kardinal çaprazlarına göre hesaplanan destek ve direnç seviyelerini görselleştirmenin benzersiz bir yolunu sunar. Gann karesi, William Delbert Gann tarafından kullanılan kapsamlı ticaret teknikleri cephaneliğinin kilit bir unsurudur.

Bu gösterge, tüm zamanların en ünlü ve gizemli tüccarlarından biri olan William Delbert Gann tarafından geliştirilen ilkelere dayanarak potansiyel dönüş noktalarını ve kilit fiyat seviyelerini belirlemeye çalışan tüccarlar için değerli bir araçtır. Onun felsefesini ve yöntemlerini anlamak, ticaret yeteneklerinizi önemli ölçüde genişletebilir.

William Delbert Gann: Teknik Analizin Efsanesi:

W.D. Gann (1878-1955), önde gelen bir finans analisti, borsa yatırımcısı ve teknik analiz üzerine çok sayıda kitap ve kursun yazarıydı. Piyasa araştırması matematik, geometri, astronomi ve hatta eski numeroloji sistemlerini kapsıyordu. Gann, piyasaların belirli matematiksel yasalara ve tekrar eden döngülere göre işlediğine ve bunların kendi benzersiz yöntemleri kullanılarak tahmin edilebileceğine inanıyordu.

Ticaret teknikleri karmaşıklık ve doğrulukla karakterize edildi. Gann, Gann açıları, Gann yelpazeleri, Gann kareleri (özellikle Dokuz Karesi, Altıgen ve 360 Daire), zaman döngüleri ve kilit tarihler dahil olmak üzere çeşitli araçlar kullandı. Amacı sadece fiyat hareketinin yönünü belirlemek değil, aynı zamanda dönüşlerin ve hedef seviyelerinin zamanlamasını doğru bir şekilde tahmin etmekti.

Gann'ın Ticaret Yaklaşımının Temel Yönleri:

  • Piyasa Geometrisi: Gann, fiyat grafiklerindeki geometrik ilişkilere büyük önem verdi. Belirli açıların ve şekillerin doğal destek ve direnç seviyeleri oluşturduğuna inanıyordu. Gann kareleri, fiyat ve zaman ilişkilerinin geometrik biçimlerde görüntülendiği bu ilkenin bir örneğidir.
  • Zaman Döngüleri: Gann, piyasa hareketlerinin belirli ritimlere tabi olduğuna inanarak, çeşitli sürelerdeki döngüleri titizlikle inceledi. Gelecekteki dönüşleri tahmin etmek için bu döngüleri tanımlamaya çalıştı.
  • Gann Açıları: Önemli yüksek veya düşük seviyelerden belirli açılarda (en yaygın olarak 45, 90, 180 derece) çizilen çizgiler, önemli destek ve direnç seviyeleri olarak kabul edildi. Bu açıların kesişimi genellikle potansiyel trend değişikliklerini gösteriyordu.
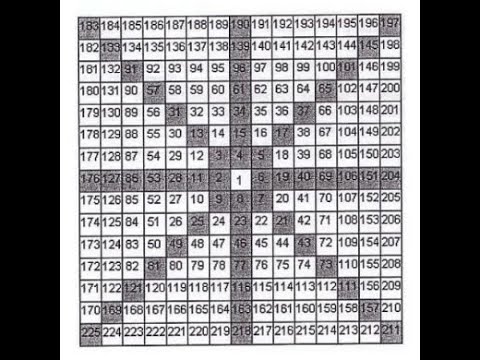
  • Gann Kareleri: Bu araçlar, fiyat ve zaman ilişkilerini kare biçiminde birleştirir. Gunn Crosses göstergesinin temelini oluşturan Gann karelerinin diyagonal ve kardinal çizgileri özellikle önemli seviyeler olarak kabul edilir.
  • Numeroloji ve Astrolojik: Bu yönler daha ezoterik olsa da, Gann sayısal dizilerin ve astronomik faktörlerin piyasa dinamikleri üzerindeki etkisini de araştırdı.

Gunn Crosses Göstergesinin Temel İlkeleri:

Gunn Crosses göstergesi, Gann karesinin diyagonal ve kardinal çaprazlarının kesişimiyle oluşan önemli destek ve direnç seviyelerini grafiğinizde otomatik olarak hesaplar ve görüntüler. Bu çaprazlar, Gann'ın analitik yaklaşımının kilit unsurlarıdır ve fiyatın önemli bir muhalefetle karşılaşabileceği veya destek bulabileceği alanları belirlemeye yardımcı olur.

  • Kardinal Çapraz: Seçilen temel fiyatta kesişen yatay ve dikey çizgilerden oluşur. Yatay çizgi fiyat seviyesinin kendisini temsil eder ve dikey çizgi bu fiyata göre bir zaman ekseni olarak kabul edilebilir.
  • Diyagonal Çapraz: Kardinal çaprazın yatay ve dikey çizgilerine göre 45 derecelik açılarda çizilen iki çizgiden oluşur. Bu çizgiler, Gann'ın teorisine göre gelecekteki fiyat hareketini belirlemede kritik bir faktör olan 1:1 fiyat-zaman ilişkisini yansıtır.

Bu çizgilerin kesişimi, yatırımcıların piyasaya giriş ve çıkış noktalarını belirlemek ve stop-loss ve take-profit emirleri ayarlamak için kullanabileceği potansiyel destek ve direnç seviyeleri oluşturur.

Temel Fiyatı Tanımlamada Esneklik:

Göstergenin temel özelliklerinden biri, Gann çaprazlarının oluşturulduğu fiyata göre esnekliğidir. Şunları kullanabilirsiniz:

  • Mevcut Fiyat: Seviyelerin hesaplanması, grafikteki en son fiyata göre dinamik olarak gerçekleştirilecektir. Bu, mevcut destek ve direnç seviyelerini gerçek zamanlı olarak izlemenizi sağlar.
  • Kullanıcı Tanımlı Fiyat: Price parametresini kullanarak, seviyelerin hesaplanmasının temeli olarak kullanılacak belirli bir fiyat değerini manuel olarak belirleyebilirsiniz. Bu, gelecekteki fiyat hareketini etkileyebileceğine inandığınız geçmişteki yüksek, düşük veya diğer önemli fiyat noktalarına göre analiz yapmak için yararlı olabilir.

Fiyat Oluşumunun Bir Bölümünü Kullanma:

Gunn Crosses göstergesi ayrıca seviyeleri hesaplamak için fiyatın yalnızca bir bölümünü kullanma yeteneği de sağlar. Bu, analiz için fiyatın belirli rakamlarını yalıtmanıza olanak tanıyan Digit ve minus_znak ayarları aracılığıyla elde edilir.

Şu anki fiyat 1.23456 örneğini kullanarak bu ayarların nasıl çalıştığını ayrıntılı olarak inceleyelim:

  • Digit ayarı _5____ olarak ayarlanırsa, hesaplama için 23456 sayısı kullanılır. Bu, göstergenin fiyatın son beş rakamını alacağı anlamına gelir. Bu yaklaşım, daha küçük fiyat hareketlerini analiz etmek veya belirli önemli rakamlarla ilgili seviyeleri belirlemek için yararlı olabilir.
  • _6____ değeri için 123456 sayısı (altı rakamın tamamı) kullanılır. Bu, mevcut tüm fiyat bilgilerini kullanan standart yaklaşımdır.
  • __4____ değeri için 3456 sayısı (üçüncüden altıncıya kadar olan rakamlar) kullanılır. Fiyatın belirli rakamlarının seviyelerin oluşumu üzerinde daha büyük bir etkisi olduğuna inanıyorsanız bu yararlı olabilir.
  • ___3___ değeri için 456 sayısı (son üç rakam) kullanılır. Öncekine benzer şekilde, bu daha kısa vadeli fiyat dalgalanmalarına odaklanmanızı sağlar.
  • ____2__ değeri için 56 sayısı (son iki rakam) kullanılır. Bu seçenek, çok kısa vadeli analiz veya yüksek volatiliteye sahip araçlar için ilginç olabilir.

minus_znak ayarı, seçilen fiyat bölümünün sağından belirli sayıda rakamı kaldırmanıza olanak tanır. Digit'in _5____ olarak ayarlandığı (sonuç olarak 23456 sayısı) bir örnek düşünün:

  • minus_znak _0 olarak ayarlanırsa, fiyat oluşturan sayı 23456 olur. Bu, seçilen fiyat bölümünün değişiklik yapılmadan kullanıldığı anlamına gelir.
  • _1 değeriyle 2345 sayısı (son rakam kaldırıldı) kullanılır. Bu, daha kaba destek ve direnç seviyelerini belirlemeye yardımcı olabilir.
  • _2 değeriyle 234 sayısı (son iki rakam kaldırıldı) kullanılır. Fiyat temelinin daha da basitleştirilmesi, daha önemli uzun vadeli seviyeleri ortaya çıkarabilir.

Bu ayarlar, yatırımcıların analizleri için en önemli gördükleri fiyatın belirli yönlerine odaklanmalarını sağlar; bu, çok sayıda ondalık basamağa sahip araçlarla çalışırken veya Gann'ın belirli numerolojik yaklaşımlarını uygularken özellikle yararlı olabilir.

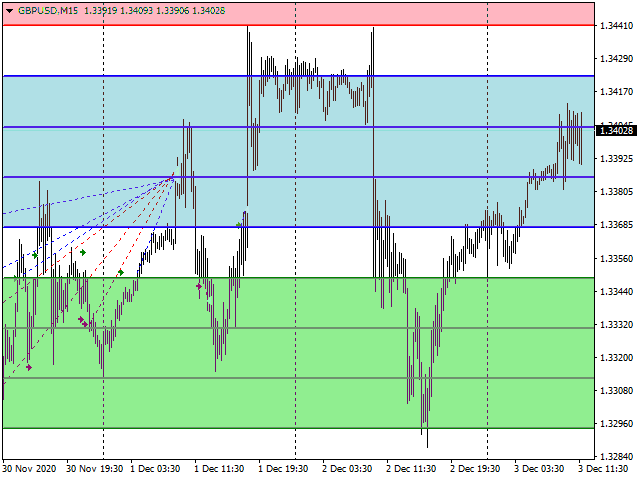
Çaprazları Görüntüleme:

Gunn Crosses göstergesi, grafikteki Gann çaprazlarının görüntülenmesi üzerinde kullanıcıya tam kontrol sağlar. Karşılık gelen ayarları kullanarak şunları yapabilirsiniz:

  • Kardinal çaprazın görüntülenmesini etkinleştirin veya devre dışı bırakın. Kardinal çapraz, temel fiyatta kesişen yatay ve dikey çizgilerden oluşur. Yatay çizgi, diğer seviyelerin oluşturulmasının temeli olarak hizmet veren fiyat seviyesini açıkça işaretler ve dikey çizgi, bu fiyat seviyesine göre zamandaki görsel yönlendirme için kullanılabilir.
  • Diyagonal çaprazın görüntülenmesini etkinleştirin veya devre dışı bırakın. Diyagonal çapraz, kardinal çaprazın yatay ve dikey çizgilerine göre 45 derecelik açılarda çizilen iki çizgiden oluşur. Bu çizgiler, Gann teorisindeki temel 1:1 fiyat-zaman ilişkisini, yani bir birim fiyat değişikliğinin bir birim zaman değişikliğine karşılık geldiği ilişkiyi yansıtır. Bu diyagonal çizgilerin fiyat hareketleriyle kesişimi, önemli destek ve direnç noktalarının yanı sıra potansiyel trend hızlanma veya yavaşlama anlarını gösterebilir.

Kardinal ve diyagonal çaprazların görüntülenmesini bağımsız olarak kontrol etme yeteneği, yatırımcıların göstergenin görselleştirmesini analitik ihtiyaçlarına göre özelleştirmelerine ve grafiği gereksiz bilgilerle aşırı yüklemekten kaçınmalarına, yalnızca mevcut ticaret stratejileri için en önemli olan unsurlara odaklanmalarına olanak tanır.

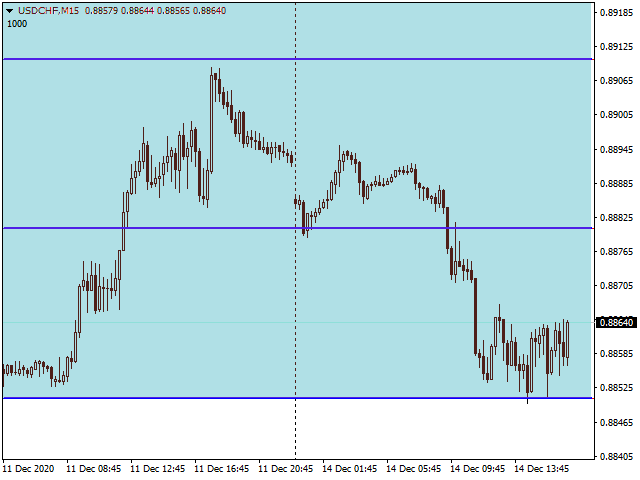
Görselleştirme Ayarları:

Gunn Crosses göstergesiyle rahat çalışmayı sağlamak için, çizgilerin ve etiketlerin görsel görüntüsünü özelleştirmek için kapsamlı ayarlar sağlanmıştır. Kardinal ve diyagonal çapraz çizgilerinin rengini ve fiyat seviyelerini görüntüleyen etiketlerin metin rengini ayrı ayrı ayarlayabilirsiniz. Bu, göstergenin görünümünü grafiğinizin renk şemasına göre uyarlamanıza ve analizi daha kullanışlı ve sezgisel hale getirmenize olanak tanır, bu da temel destek ve direnç seviyelerinin görsel algısını kolaylaştırır.

Gunn Crosses Göstergesini Bir Ticaret Stratejisine Uygulama:

Gunn Crosses göstergesi, bir ticaret stratejisi içinde çeşitli şekillerde kullanılabilir:

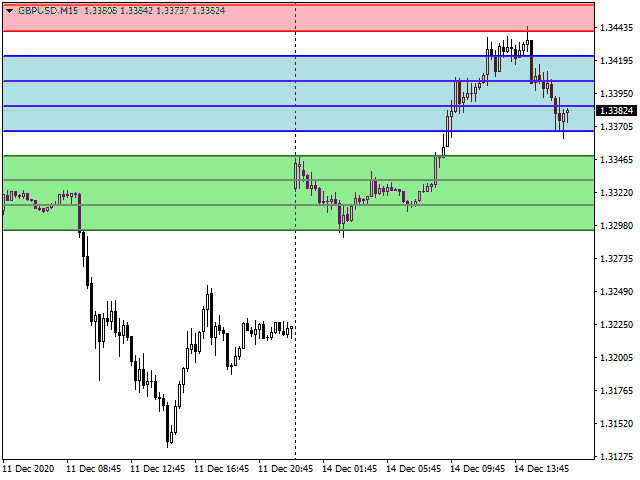
  • Destek ve Direnç Seviyelerini Belirleme: Çaprazların çizgileri, fiyatın sıçrayabileceği veya kırabileceği statik seviyeler olarak işlev görebilir.
  • Dönüş Noktalarını Bulma: Fiyatın çapraz çizgilerini geçmesi potansiyel trend değişikliklerini gösterebilir.
  • Hedef Seviyeleri Ayarlama: Kardinal ve diyagonal çapraz çizgilerinin kesişimleri, kar alma emirleri ayarlamak için kılavuz olarak kullanılabilir.
  • Konsolidasyon Bölgelerini Belirleme: Çapraz çizgilerinin yakınlaşması, fiyatın yatay hareket ettiği dönemleri gösterebilir.
  • Sinyalleri Filtreleme: Gösterge, ticaret sinyallerini doğrulamak için diğer teknik analiz araçlarıyla birlikte kullanılabilir.

Gunn Crosses Göstergesini Kullanmanın Avantajları:

  • Gann karelerinin temel geometrisine dayalı temel destek ve direnç seviyelerini görüntüler.
  • Seviyeleri hesaplamak için esnek temel fiyat seçimi (mevcut veya kullanıcı tanımlı), bu da göstergeyi çeşitli analitik senaryolara uyarlamanıza olanak tanır.
  • Gann'ın gelişmiş teknikleriyle tutarlı olarak, daha derin ve daha spesifik analiz için fiyatın bir bölümünü kullanma yeteneği.
  • Grafik görselleştirmesini optimize etmek için kardinal ve diyagonal çaprazların görüntülenmesi üzerinde bağımsız kontrol.
  • Rahat görselleştirme ve daha iyi bilgi algısı için çizgilerin ve etiketlerin rengini özelleştirmek için kapsamlı ayarlar.
  • Geometrik ve zamansal ilişkileri dikkate alarak potansiyel dönüş noktalarını ve fiyat hedeflerini belirlemeye yardımcı olur.
  • En etkili yatırımcılardan birinin ilkelerine dayanan güçlü bir analitik aracı ticaret terminalinize entegre eder.

Gunn Crosses göstergesi, piyasanın gizli geometrisini ortaya çıkarmanıza ve büyük W.D. Gann tarafından geliştirilen güçlü yöntemleri kullanarak daha bilinçli ticaret kararları vermenize yardımcı olarak, teknik analiz araçları cephaneliğinize değerli bir katkı sağlayacaktır! Onun benzersiz yaklaşımı hakkındaki anlayışınızı derinleştirin ve ticaretinizi piyasa kalıplarını anlama konusunda yeni bir düzeye yükseltin.


Önerilen ürünler
"Auto FIBO Pro" Crypto_Forex göstergesi - ticarette harika bir yardımcı araçtır! - Gösterge, Fibo seviyelerini ve yerel trend çizgilerini (kırmızı renk) otomatik olarak hesaplar ve grafikte yerleştirir. - Fibonacci seviyeleri, fiyatın tersine dönebileceği önemli alanları gösterir. - En önemli seviyeler %23,6, %38,2, %50 ve %61,8'dir. - Ters scalping veya bölge ızgara ticareti için kullanabilirsiniz. - Auto FIBO Pro göstergesini kullanarak mevcut sisteminizi geliştirmek için birçok fırsat vardı
Chinetti pip collector XL is a complete turnkey trading system. If a trader does not yet have his own trading system, he can apply Chinetti pip collector XL to trading. Trading with this indicator is very easy. Even a beginner in Forex can handle it. Trading rules: wait for the indicator to start drawing a blue line. This means that the price trend is starting now. Now we are waiting for the indicator to analyze the market and draw an up arrow on the chart. At this point, we open a buy order.
Deal Trading SPT
Sukunthakan Ngernbamrung
Deal Trading SPT (Super Trend) is an indicator, shows the market trend direction, entry position, take profit level, stop loss level and trend strength. Utility Help to further filter and develop strategy to trade Market overview on the chart Stop loss and take profit calculation with market volatility Resistance and support for trialing stop No repaint after the finished bar Works in any timeframe and financial instrument, including forex, CFD and crypto etc. Message pop-up, notification with
Trend PA
Mikhail Nazarenko
5 (3)
The Trend PA indicator uses   Price Action   and its own filtering algorithm to determine the trend. This approach helps to accurately determine entry points and the current trend on any timeframe. The indicator uses its own algorithm for analyzing price changes and Price Action. Which gives you the advantage of recognizing, without delay, a new nascent trend with fewer false positives. Trend filtering conditions can be selected in the settings individually for your trading style. The indicator
Добрый День уважаемые трейдеры!  Вашему вниманию индикатор созданный и работающий на базе трендовика ADX,  для торговли на смене направления движения который учитывает коррекцию и даёт возможность на ней заработать.  Применяю этот индикатор для скальпинга. Рекомендую таймфреймы от 15 ти минутного(М15) до часового (Н1) периодов.  Красный кружок сигнал на продажу- Sell) Зелёный кружок  сигнал на покупку Buy) Чем меньше ваш таймфрейм тем меньше пунктов вы зарабатываете.   Важно выставлять стопы! !В
Diamond Trend
Segundo Calvo Munoz
Indicator which identifies Trend and also buy/sell opportunities. Use for entries aligned to the Trend.  Although Diamond Trend is very accurate identifying entry points, it is always recommended to use a support indicator in order to reconfirm the operation. Remind to look for those Assets and Timeframes which best fit to your trader behavior/need... Valid for Scalping and Long Term operations. Please, set up a Bars Chart to be able to visualize the indicator properly...  ...And remind to give
Harvest GOLD USES THE TREND WAVE INDICATOR AND IT CAN IDENTIFY THE BEGINNING AND THE END OF A NEW WAVE TREND MOVEMENT. AS AN OSCILLATOR, THE INDICATOR IDENTIFIES THE OVERBOUGHT AND OVERSOLD ZONES. IT WORKS GREAT TO CATCH THE SHORT TERM PRICE REVERSALS AND USES A MARTINGALE STRATEGY TO CLOSE ALL TRADES IN PROFIT. USE DEFAULT SETTINGS ON H1 OR HIGHER TIME FRAME ON ANY PAIR FOR MORE ACCURATE TRADES WHY THIS EA : Smart entries calculated by 3 great strategies The EA can be run on even a $30000
Anubis Skunk USES THE TREND WAVE INDICATOR AND IT CAN IDENTIFY THE BEGINNING AND THE END OF A NEW WAVE TREND MOVEMENT. AS AN OSCILLATOR, THE INDICATOR IDENTIFIES THE OVERBOUGHT AND OVERSOLD ZONES. IT WORKS GREAT TO CATCH THE SHORT TERM PRICE REVERSALS AND USES A MARTINGALE STRATEGY TO CLOSE ALL TRADES IN PROFIT. USE DEFAULT SETTINGS ON H1 OR HIGHER TIME FRAME ON ANY PAIR FOR MORE ACCURATE TRADES WHY THIS EA : Smart entries calculated by 5 great strategies The EA can be run on even a $20000
VANGLUTIO USES THE TREND WAVE INDICATOR AND IT CAN IDENTIFY THE BEGINNING AND THE END OF A NEW WAVE TREND MOVEMENT. AS AN OSCILLATOR, THE INDICATOR IDENTIFIES THE OVERBOUGHT AND OVERSOLD ZONES. IT WORKS GREAT TO CATCH THE SHORT TERM PRICE REVERSALS AND USES A MARTINGALE STRATEGY TO CLOSE ALL TRADES IN PROFIT. USE DEFAULT SETTINGS ON H1 OR HIGHER TIME FRAME ON ANY PAIR FOR MORE ACCURATE TRADES WHY THIS EA : Smart entries calculated by 5 great strategies The EA can be run on even a $20000 ac
This indicator works on MT4 and is very easy to use. When you receive a signal from it, you wait for that candle with the signal to close and you enter your trade at the beginning of the next new candle . A red arrow means sell and a green arrow means buy. All arrows comes with Alert  like for easy identification of trade signal. Are you okay with that? 1 minute candle 1 minute expire
Robot scalper for M5 timeframe. Trades on the GBPUSD currency pair. This robot has been specially developed by a company of professional traders for trading in the pound sterling. The robot approximately opens 5 to 15 trades every day. It is best to trade with brokers that have a low spread on GBPUSD up to 10 pips. The recommended minimum deposit to start is $500 or more. Advantages: does not use martingale. not a net. every trade has a stop loss. professional bot specifically for the GBPUSD p
"Ayarlanabilir Fraktallar" - fraktal göstergesinin gelişmiş bir versiyonudur, çok kullanışlı bir ticaret aracıdır! - Bildiğimiz gibi Standart fraktallar mt4 göstergesinin hiç ayarı yoktur - bu, yatırımcılar için çok elverişsizdir. - Ayarlanabilir Fraktallar bu sorunu çözmüştür - gerekli tüm ayarlara sahiptir: - Göstergenin ayarlanabilir periyodu (önerilen değerler - 7'nin üzerinde). - Fiyatın Yüksek/Düşük noktalarına ayarlanabilir mesafe. - Fraktal oklarının ayarlanabilir tasarımı. - Gösterged
"Pattern 123" is an indicator-a trading system built on a popular pattern, pattern 123. This is the moment when we expect a reversal on the older trend and enter the continuation of the small trend, its 3rd impulse. The indicator displays signals and markings on an open chart. You can enable/disable graphical constructions in the settings. The indicator has a built-in notification system (email, mobile terminal, standard terminal alert). "Pattern 123" has a table that displays signals from sele
Trend Ray
Andriy Sydoruk
The indicator shows the potential trend direction by cyclical-wave dependence. Thus, all the rays of the intersection will be optimal rays, in the direction of which the price is expected to move, taking into account the indicator period. Rays can be used as a direction for potential market movement. But we must not forget that the approach must be comprehensive, the indicator signals require additional information to enter the market.
Gold Phoenix
Yaroslav Varankin
The perfect tool for Scalng in the Forex markets You can trade both from signal to signal and using take profit  The algorithm does not use Zigzag!  No redrawing!  This is a channel instrument that uses a moving average as a filter. Moving Average  There are 2 parameters for the settings Ma Period = 5 period Moving Average  Channel 1.0 distance of channel lines from the chart Price Signal Filter - calculation of signal opening and filter There is a complete set of Alert There is a multi-timefram
Night ghost
Dmitriy Kashevich
Night Ghost - İkili opsiyonlar için ok göstergesi. Bu, gelecekte sizin için güvenilir bir yardımcıdır! - Grafikte yeniden çizim yok -Tüm döviz çiftlerinde harika çalışıyor! -%90'a varan gösterge doğruluğu (Özellikle geceleri) -Uzun süre kurulum yapmaya gerek yok (İkili Opsiyonlar için mükemmel kurulum) - Geç olmayan sinyaller - Mevcut mum üzerinde bir sinyalin görünümü -M1 dönemi için mükemmel (Artık Yok!) - Göz dostu mum rengi (Kırmızı ve Mavi) -Yüklü Uyarı Onunla çalışmak: - Mavi
The Binary Profit Maker,  This indicator works on MT4 and is very easy to use. When you receive a signal from it, you wait for that candle with the signal to close and you enter your trade at the beginning of the next new candle . A Up Purple arrow means Buy and a Down Purple arrow means Sell. All arrows comes with Alert  like for easy identification of trade signal. Are you okay with that? How To Enter Trade? 1 minute candle 1 minute expire
Fiery Pinnacle USES THE TREND WAVE INDICATOR AND IT CAN IDENTIFY THE BEGINNING AND THE END OF A NEW WAVE TREND MOVEMENT. AS AN OSCILLATOR, THE INDICATOR IDENTIFIES THE OVERBOUGHT AND OVERSOLD ZONES. IT WORKS GREAT TO CATCH THE SHORT TERM PRICE REVERSALS AND USES A MARTINGALE STRATEGY TO CLOSE ALL TRADES IN PROFIT. USE DEFAULT SETTINGS ON H1 OR HIGHER TIME FRAME ON ANY PAIR FOR MORE ACCURATE TRADES WHY THIS EA : Smart entries calculated by 4 great strategies The EA can be run on even a $300
Zig Zag Robot: A Comprehensive Reversal Trading System The Zig Zag Robot is a powerful tool designed to accurately identify key market reversals and filter out market "noise." It goes beyond a simple Zig Zag indicator by combining multiple tools and built-in logic to provide you with ready-to-use trading signals and help you make more informed decisions. How It Works The indicator uses a multi-level approach to market analysis, which allows it to find high-probability entry points: Signal Filter
VR Cub
Vladimir Pastushak
VR Cub , yüksek kaliteli giriş noktaları elde etmenin bir göstergesidir. Gösterge, matematiksel hesaplamaları kolaylaştırmak ve bir pozisyona giriş noktalarının aranmasını basitleştirmek için geliştirildi. Göstergenin yazıldığı ticaret stratejisi uzun yıllardan beri etkinliğini kanıtlamaktadır. Ticaret stratejisinin basitliği, acemi yatırımcıların bile başarılı bir şekilde ticaret yapmasına olanak tanıyan büyük avantajıdır. VR Cub, pozisyon açılış noktalarını ve Kâr Al ve Zararı Durdur hedef sev
MA Alignment Scanner
Benedict Jamora
5 (1)
This indicator scans and displays currency pairs that have recently aligned moving averages on a given timeframe. You can configure which pairs the indicator will scan. It also includes all types of alert options. Bullish MA Alignment =  MA1>MA2>MA3>MA4>MA5 Bearish MA Alignment =  MA1<MA2<MA3<MA4<MA5 Features Attach to one chart and scans all the currency pairs configured and visible in the Market Watch Window It can monitor all the available timeframes from M1 to MN1 and sends alerts on every
VANDORA FX USES THE TREND WAVE INDICATOR AND IT CAN IDENTIFY THE BEGINNING AND THE END OF A NEW WAVE TREND MOVEMENT. AS AN OSCILLATOR, THE INDICATOR IDENTIFIES THE OVERBOUGHT AND OVERSOLD ZONES. IT WORKS GREAT TO CATCH THE SHORT TERM PRICE REVERSALS AND USES A MARTINGALE STRATEGY TO CLOSE ALL TRADES IN PROFIT. USE DEFAULT SETTINGS ON H1 OR HIGHER TIME FRAME ON ANY PAIR FOR MORE ACCURATE TRADES WHY THIS EA : Smart entries calculated by 5 great strategies The EA can be run on even a $20000 a
Delta Pairs
Anatolii Zainchkovskii
Delta Pairs is an indicator for pair trading, it displays the divergence of two currency pairs. Does not redraw. A useful tool for the analysis of the behavior of two currency pairs relative to each other. Purpose The Delta Pairs indicator is designed for determining the divergences in the movements of two currency pairs. This indicator is displayed as two line charts and the difference (delta) between these charts in the form of a histogram. The Delta Pairs indicator will be useful for those w
Rira Renko
Vitor Palmeira Abbehusen
RENKO on Time Chart This indicator is an enhanced Renko, so you can watch the Renko bricks on the chart to understand price movement more clearly the other improvement is automated box size according to ATR (Average True Range) period you can set the ATR number as you want and the box size of Renko changes automatically based on price movement Inputs Mode: Box size is the input to specify the size of the Renko box you want to print on the chart. This input lets you choose the fixed box siz
ForexGumpOopster - this indicator was developed to determine the trend direction and price pivot points on the H1, H4, D1 timeframes. The default settings are for the GBPUSD currency pair. For the EURUSD currency pair, the time frame H1, H4, D1 is recommended in the indicator settings to change the parameter "smooth = 5". This indicator is well suited for traders who trade on the scalping system. The arrows on the screen indicate the points of price reversal, and the lines indicate the directio
MESA Spectrum
Christopher Kryza
The MESA Spectrum indicator calculates the power spectrum of a data series using the Maximum Entropy Spectrum Estimation method and produces a power spectrum plot. The Maximum Entropy algorithm, unlike a simple FFT transform, will include frequencies from the entire complex frequency plane and not just the Nyquist interval which, in general terms, means that it can resolve cycle periods that are larger than the data window passed to the function. In addition, MESA has the ability to fit very sha
GJ OPTIONS USES THE TREND WAVE INDICATOR AND IT CAN IDENTIFY THE BEGINNING AND THE END OF A NEW WAVE TREND MOVEMENT. AS AN OSCILLATOR, THE INDICATOR IDENTIFIES THE OVERBOUGHT AND OVERSOLD ZONES. IT WORKS GREAT TO CATCH THE SHORT TERM PRICE REVERSALS AND USES A MARTINGALE STRATEGY TO CLOSE ALL TRADES IN PROFIT. USE DEFAULT SETTINGS ON H1 OR HIGHER TIME FRAME ON ANY PAIR FOR MORE ACCURATE TRADES WHY THIS EA : Smart entries calculated by 5 great strategies The EA can be run on even a $20000 account
Automatic Support & Resistance Indicator for MetaTrader 4 The Automatic Support & Resistance Indicator for MT4 is a dedicated analytical tool designed for the MetaTrader 4 platform. It automatically identifies key support and resistance zones across multiple timeframes by analyzing historical price behavior. Support areas are highlighted in green, while resistance zones are displayed in brown, allowing traders to interpret market structure quickly and efficiently. This indicator is commonly used
Indicator Description GOLD TITAN KING SIGNAL INDICATOR High-Precision Gold Scalping Buy/Sell Signals – Manual Trading Assistant Overview The Gold Titan King Signal Indicator is a manual trading assistant tool designed for high-frequency scalping on Gold (XAUUSD) and other major pairs. It generates clear BUY/SELL signals with precise entry levels, along with adjustable Stop Loss and Take Profit levels displayed directly on the chart. ️ This tool is NOT an EA. It does not execute trades
Order Blocks Breaker
Suvashish Halder
5 (1)
Introducing Order Blocks Breaker , a brand-new way to identify and leverage order blocks in your trading strategy. After developing multiple order block tools with unique concepts, I’m proud to present this tool that takes things to the next level. Unlike previous tools, Order Blocks Breaker not only identifies order blocks but also highlights Breaker Order Blocks —key areas where the price is likely to retest after a breakout. MT5 -  https://www.mql5.com/en/market/product/124102/ This tool inco
Bu ürünün alıcıları ayrıca şunları da satın alıyor
Smc Blast Signal
Mohit Dhariwal
5 (3)
NEW YEAR 2026 SALE OFFER PRICE AT JUST 99 DOLLARS FEW COPIES ONLY AT This price From 10th Jan -20th Jan MIDNIGHT Final offer GRAB YOUR COPY ON THIS New Year EVE Prices will be increased to 150 after the offer period ends Full Fledged EA and Alert plus for alerts will also be provided in this offer along with the purchase of Indicator. Limited copies only at this price and Ea too. Grab your copy soon Alert plus for indicator with set file is kept in comment section with the image  SMC Blast Signa
Scalper Inside PRO
Alexey Minkov
4.74 (69)
An exclusive indicator that utilizes an innovative algorithm to swiftly and accurately determine the market trend. The indicator automatically calculates opening, closing, and profit levels, providing detailed trading statistics. With these features, you can choose the most appropriate trading instrument for the current market conditions. Additionally, you can easily integrate your own arrow indicators into Scalper Inside Pro to quickly evaluate their statistics and profitability. Scalper Inside
Şu anda %20 İNDİRİMLİ! Herhangi bir Acemi veya Uzman Tüccar için En İyi Çözüm! Bu gösterge paneli yazılımı 28 döviz çifti üzerinde çalışıyor. Ana göstergelerimizden 2'sine (Gelişmiş Para Birimi Gücü 28 ve Gelişmiş Para Birimi Dürtüsü) dayanmaktadır. Tüm Forex piyasasına harika bir genel bakış sağlar. Gelişmiş Para Birimi Gücü değerlerini, para birimi hareket hızını ve tüm (9) zaman dilimlerinde 28 Forex çifti için sinyalleri gösterir. Trendleri ve / veya scalping fırsatlarını belirlemek için
First 25 copies at $80, after that price becomes $149 (4 copies left) Gold Signal Pro is a powerful MT4 indicator designed to help traders spot strong price reactions in the market. It focuses on clear wick rejections , showing when price strongly rejects a level and often continues in the same direction. Gold Signal Pro is mainly built for scalping gold (XAUUSD) and works best on lower timeframes like M5 and M15 , where timing matters most. That said, it can also be used on any forex pair, a
GOLD Impulse with Alert
Bernhard Schweigert
4.64 (11)
Bu gösterge, 2 ürünümüz Advanced Currency IMPULSE with ALERT  +   Currency Strength Exotics  'in süper bir kombinasyonudur. Tüm zaman dilimleri için çalışır ve 8 ana para birimi artı bir Sembol için grafiksel olarak güç veya zayıflık dürtüsünü gösterir! Bu Gösterge, Altın, Egzotik Çiftler, Emtialar, Endeksler veya Vadeli İşlemler gibi herhangi bir sembol için para birimi gücü ivmesini göstermek için uzmanlaşmıştır. Türünün ilk örneğidir, Altın, Gümüş, Petrol, DAX, US30, MXN, TRY, CNH vb. içi
Atomic Analyst
Issam Kassas
5 (3)
Öncelikle belirtmek gerekir ki bu Ticaret Göstergesi Yeniden Çizim Yapmaz, Gecikmez ve Gecikme Göstermez, bu da hem manuel hem de robot ticareti için ideal hale getirir. Kullanıcı kılavuzu: ayarlar, girişler ve strateji. Atom Analisti, Piyasada Daha İyi Bir Avantaj Bulmak İçin Fiyatın Gücünü ve Momentumunu Kullanan PA Fiyat Hareketi Göstergesidir. Gürültüleri ve Yanlış Sinyalleri Kaldırmaya ve Ticaret Potansiyelini Artırmaya Yardımcı Olan Gelişmiş Filtrelerle Donatılmıştır. Birden fazla katman
Trend indicator AI
Ramil Minniakhmetov
4.9 (77)
Trend Ai göstergesi, trend tanımlamasını işlem yapılabilir giriş noktaları ve geri dönüş uyarılarıyla birleştirerek bir yatırımcının piyasa analizini geliştirecek harika bir araçtır. Bu gösterge, kullanıcıların forex piyasasının karmaşıklıklarında güvenle ve hassasiyetle yol almalarını sağlar. Birincil sinyallerin ötesinde, Trend Ai göstergesi geri çekilmeler veya düzeltmeler sırasında ortaya çıkan ikincil giriş noktalarını belirleyerek, yatırımcıların belirlenen trend içindeki fiyat düzeltmele
Volatility Trend System - girişler için sinyaller veren bir ticaret sistemi. Oynaklık sistemi, trend yönünde doğrusal ve noktasal sinyaller ve ayrıca yeniden çizme ve gecikme olmaksızın trendden çıkmak için sinyaller verir. Trend göstergesi, orta vadeli trendin yönünü izler, yönünü ve değişimini gösterir. Sinyal göstergesi volatilitedeki değişikliklere dayalıdır ve piyasa girişlerini gösterir. Gösterge, çeşitli uyarı türleri ile donatılmıştır. Çeşitli alım satım araçlarına ve zaman dilimlerine
Dynamic Forex28 Navigator
Bernhard Schweigert
4.43 (7)
Dynamic Forex28 Navigator - Yeni Nesil Forex Ticaret Aracı. ŞU ANDA %49 İNDİRİM. Dynamic Forex28 Navigator, uzun zamandır popüler olan göstergelerimizin evrimidir ve üçünün gücünü tek bir göstergede birleştirir: Gelişmiş Döviz Gücü28 Göstergesi (695 inceleme) + Gelişmiş Döviz İMPULS ve UYARI (520 inceleme) + CS28 Kombo Sinyalleri (Bonus). Gösterge hakkında ayrıntılar https://www.mql5.com/en/blogs/post/758844 Yeni Nesil Güç Göstergesi Ne Sunuyor?  Orijinallerde sevdiğiniz her şey, şimdi yeni
Miraculous Göstergesi – Gann Dokuz Kareye Dayalı %100 Tekrarlamayan Forex ve İkili Araç Bu video, Forex ve İkili Opsiyon traderları için özel olarak geliştirilmiş son derece doğru ve güçlü bir ticaret aracı olan Miraculous Göstergesi 'ni tanıtıyor. Bu göstergeyi benzersiz kılan, efsanevi Gann Dokuz Karesi ve Gann Titreşim Yasası 'na dayanmasıdır; bu da onu modern ticarette mevcut en hassas tahmin araçlarından biri yapmaktadır. Miraculous Göstergesi tamamen tekrarlamaz ; yani mum kapandıktan son
ZeusArrow Smart Liquidity Finder  Smart Liquidity Finder is Ai controlled indicator based on the Idea of Your SL is My Entry. It scan and draws the major Liquidity areas on chart partitioning them with Premium and Discount Zone and allows you find the best possible trading setups and help you decide the perfect entry price to avoid getting your Stop Loss hunted . Now no more confusion about when to enter and where to enter. Benefit from this one of it's kind trading tool powered by Ai an trade
Algo Pumping MT4
Ihor Otkydach
4.69 (16)
PUMPING STATION – Kişisel “her şey dahil” stratejiniz Karşınızda PUMPING STATION — forex dünyasında işlem yapma şeklinizi heyecan verici ve etkili bir sürece dönüştürecek devrim niteliğinde bir gösterge. Bu sadece bir yardımcı değil, güçlü algoritmalarla donatılmış tam teşekküllü bir ticaret sistemidir ve daha istikrarlı işlem yapmanıza yardımcı olur. Bu ürünü satın aldığınızda ŞUNLARI ÜCRETSİZ olarak alırsınız: Özel ayar dosyaları: Otomatik kurulum ve maksimum performans için. Adım adım video e
Matrix Arrow Indicator MT4
Juvenille Emperor Limited
5 (3)
Matrix Arrow Indicator MT4 , forex, emtialar, kripto para birimleri, endeksler, hisse senetlerigibi tüm sembollerde/araçlarda kullanılabilen %100 yeniden boyamayan çoklu zaman çerçevesi göstergesini izleyen benzersiz bir 10'u 1 arada trenddir.  Matrix Arrow Indicator MT4 , mevcut eğilimi erken aşamalarında belirleyecek ve aşağıdakiler gibi 10'a kadar standart göstergeden bilgi ve veri toplayacaktır: Ortalama Yönlü Hareket Endeksi (ADX) Emtia Kanal Endeksi (CCI) Klasik Heiken Ashi mumları Hareke
Trend Lines PRO
Roman Podpora
5 (1)
TREND ÇİZGİLERİ PRO     Piyasanın gerçek yön değişimini anlamaya yardımcı olur. Gösterge, gerçek trend dönüşlerini ve büyük oyuncuların piyasaya yeniden girdiği noktaları gösterir. Anlıyorsun     BOS hatları  Daha yüksek zaman dilimlerindeki trend değişiklikleri ve önemli seviyeler, karmaşık ayarlar veya gereksiz gürültü olmadan gösterilir. Sinyaller yeniden çizilmez ve çubuk kapandıktan sonra grafikte kalır. Göstergenin gösterdiği şey: Gerçek değişimler  trend (BOS çizgileri) Bir sinyal göründ
Bu indikatörü satın alırsanız, Profesyonel Trade Manager’ımı  + EA   ÜCRETSİZ olarak alacaksınız. Öncelikle, bu Ticaret Sistemi'nin Non-Repainting, Non-Redrawing ve Non-Lagging Göstergesi olduğunu vurgulamak önemlidir, bu da hem manuel hem de robot ticareti için ideal hale getirir. Online kurs, kılavuz ve ön ayarları indir. "Smart Trend Trading System MT5", yeni ve deneyimli tüccarlar için özelleştirilmiş kapsamlı bir ticaret çözümüdür. 10'dan fazla premium göstergeyi birleştiriyor ve 7'den faz
FX Power MT4 NG
Daniel Stein
4.95 (20)
FX Power: Daha Akıllı Ticaret Kararları için Para Birimlerinin Gücünü Analiz Edin Genel Bakış FX Power , her piyasa koşulunda başlıca para birimlerinin ve altının gerçek gücünü anlamak için vazgeçilmez bir araçtır. Güçlü para birimlerini alıp zayıf olanları satarak, FX Power ticaret kararlarınızı basitleştirir ve yüksek olasılıklı fırsatları ortaya çıkarır. İster trendlere sadık kalın ister Delta'nın aşırı değerlerini kullanarak tersine dönüşleri öngörün, bu araç ticaret tarzınıza mükemmel bir
PZ Day Trading
PZ TRADING SLU
3.67 (3)
Effortless trading: non-repainting indicator for accurate price reversals This indicator detects price reversals in a zig-zag fashion, using only price action analysis and a donchian channel. It has been specifically designed for short-term trading, without repainting or backpainting at all. It is a fantastic tool for shrewd traders aiming to increase the timing of their operations. [ Installation Guide | Update Guide | Troubleshooting | FAQ | All Products ] Amazingly easy to trade It provides
F-16 Uçak Göstergesini tanıtıyoruz, ticaret deneyiminizi devrimleştirmek için tasarlanmış son teknoloji bir MT4 aracı. F-16 savaş uçağının eşsiz hızı ve hassasiyetinden ilham alan bu gösterge, finansal piyasalarda eşi benzeri olmayan performans sunmak için ileri algoritmalar ve son teknoloji teknolojileri bir araya getirir. F-16 Uçak Göstergesi ile gerçek zamanlı analiz sunarak yüksek doğruluklu ticaret sinyalleri üretirken rekabetin üzerine çıkacaksınız. Dinamik özellikleri, farklı varlık sınıf
FX Volume
Daniel Stein
4.63 (38)
FX Volume: Bir Broker’ın Perspektifinden Gerçek Piyasa Duyarlılığını Deneyimleyin Kısa Özet Trading yaklaşımınızı bir adım öteye taşımak ister misiniz? FX Volume , perakende traderlar ile brokerların nasıl konumlandığını gerçek zamanlı olarak sunar—COT gibi gecikmeli raporlardan çok daha önce. İster istikrarlı kazançları hedefliyor olun, ister piyasada daha güçlü bir avantaj arayın, FX Volume önemli dengesizlikleri belirlemenize, kırılmaları (breakout) doğrulamanıza ve risk yönetiminizi iyileş
SMC Easy Signal
Mohamed Hassan
4.73 (15)
SMC Easy Signal was built to remove the confusion around the smart money concept by turning structural shifts like BOS (Break of Structure) and CHoCH (Change of Character) into simple buy and sell trading signals. It simplifies market structure trading by automatically identifying breakouts and reversals as they happen, allowing traders to focus on execution rather than analysis. Whether the market is continuing its trend or preparing to reverse, the indicator translates complex price action in
System Trend Pro
Aleksandr Makarov
5 (2)
System Trend Pro - This is the best trend trading indicator!!! The indicator no repaint!!!  The indicator has   MTF   mode, which adds confidence to trading on the trend (   no repaint   ). How to trade? Everything is very simple, we wait for the first signal (big arrow), then wait for the second signal (small arrow) and enter the market in the direction of the arrow. (See screens 1 and 2.) Exit on the opposite signal or take 20-30 pips, close half of it, and keep the rest until the opposite
Trend Arrow Super
Aleksandr Makarov
5 (2)
Trend Arrow Super The indicator not repaint or change its data. A professional, yet very easy to use Forex system. The indicator gives accurate BUY\SELL signals. Trend Arrow Super is very easy to use, you just need to attach it to the chart and follow simple trading recommendations. Buy signal: Arrow + Histogram in green color, enter immediately on the market to buy. Sell signal: Arrow + Histogram of red color, enter immediately on the market to sell.
ŞU ANDA %26 INDIRIMLI Yeni Başlayanlar veya Uzman Tüccarlar için En İyi Çözüm! Bu Gösterge benzersiz, yüksek kaliteli ve uygun fiyatlı bir ticaret aracıdır çünkü bir dizi tescilli özellik ve yeni bir formül ekledik. Sadece BİR grafik ile 28 Forex çifti için Döviz Gücünü okuyabilirsiniz! Yeni bir trendin veya scalping fırsatının tam tetik noktasını belirleyebildiğiniz için ticaretinizin nasıl gelişeceğini hayal edin? Kullanım kılavuzu: buraya tıklayın Bu ilk olan, orijinal! Değersiz bir özen
Meravith
Ivan Stefanov
5 (1)
Gösterge, her noktadan hacmi analiz eder ve bu hacim için piyasa tükenme seviyelerini hesaplar. Üç çizgiden oluşur: Boğa hacmi tükenme çizgisi Ayı hacmi tükenme çizgisi Piyasa trendini gösteren bir çizgi. Bu çizgi, piyasanın boğa mı yoksa ayı mı olduğunu yansıtacak şekilde rengini değiştirir. Piyasayı istediğiniz herhangi bir başlangıç noktasından analiz edebilirsiniz. Bir hacim tükenme çizgisine ulaşıldığında, bir sonraki analize başlamak için yeni bir nokta belirleyin. Herhangi bir şeyi analiz
Volatility Master for MetaTrader is a real-time dashboard tool that scans up to 56 symbols using up to 2 flexible dashboards on different charts to identify high-volatility, trending markets instantly. With clear bullish/bearish signals, customizable alerts, and a user-friendly interface, it helps you avoid range-bound conditions and focus on high-probability trades. Clarity leads to confidence. Trade confidently and protect your capital effectively with this powerful dashboard. Setup & Guide: 
KATANA Scalper for MT4 製品概要 MT4用のKATANA Scalper は、MetaTrader 4プラットフォーム向けに最適化された高性能テクニカル分析指標です。これは、短期取引(スカルピングとデイトレード)における最も重要な2つの課題、 価格ノイズ と シグナルラグ に対処するために特別に設計されています。 独自の信号処理アルゴリズムを用い、表面的な市場の変動を取り除き、統計的に重要な 「モメンタムコア 」を明らかにします。複雑な市場データを明確な視覚インターフェースに構築することで、トレーダーが感情ではなく客観的な市場物理学に基づいて正確でデータに基づいた意思決定を行うことを可能にします。 5 主要な技術的利点 1. 非線形ノイズリダクション(遅延の最小化) 従来の移動平均やオシレーターは、平滑化と遅延の数学的なトレードオフに悩まされています。KATANA Scalperは、価格動向を瞬時に追跡しつつ、全体のトレンドに影響を与えないマイナーノイズを効果的にフィルタリングする非線形ロジックを採用しています。これはトレンドの発生をより正確に捉えるこ
Delta Fusion Pro
Francesco Secchi
5 (2)
Delta Fusion Pro – Gün İçi İşlem için Gelişmiş Emir Akışı Analizi Delta Fusion Pro, MetaTrader 4 için profesyonel bir göstergedir. Agresif emir akışını ortaya çıkarır ve kurumsal baskının yoğunluğunu ve yönünü gerçek zamanlı olarak gösterir. Geleneksel hacim göstergelerinden farklı olarak, Ask ve Bid hacimleri arasındaki delta farkını analiz eder; dönüşleri önceden tahmin eder, trendleri doğrular ve profesyonel ilgi alanlarını belirler. Ana Özellikler Akıllı Otomatik Ayar Sistemi Tüm parametr
Önceden gösterge   Piyasa dönüş seviyelerini ve bölgelerini belirler , fiyatın seviyeye geri dönmesini beklemenize ve yeni bir trendin başlangıcında, sonunda değil, işleme girmenize olanak tanır. Gösteriyor   tersine çevirme seviyeleri       Piyasanın yön değişikliğini teyit ettiği ve daha fazla hareket oluşturduğu yer. Bu gösterge yeniden çizim gerektirmeden çalışır, her türlü enstrüman için optimize edilmiştir ve en yüksek potansiyelini bir enstrümanla birlikte kullanıldığında ortaya koyar.
Advanced Supply Demand
Bernhard Schweigert
4.91 (296)
New Year Trading Special – 50% OFF Best Solution for any Newbie or Expert Trader! This indicator is a unique, high quality and affordable trading tool because we have incorporated a number of proprietary features and a new formula. With this update, you will be able to show double timeframe zones. You will not only be able to show a higher TF but to show both, the chart TF, PLUS the higher TF: SHOWING NESTED ZONES. All Supply Demand traders will love it. :) Important Information Revealed Maximiz
Currency Strength Matrix
Raymond Gilmour
4.5 (26)
THE ONLY CURRENCY STRENGTH INDICATOR THAT IS BASED ON PRICE ACTION. DESIGNED FOR TREND, MOMENTUM & REVERSAL TRADERS This indicator  reads price action to confirm trend and strength . Advanced multi-currency and multi-time frame indicator that shows you simply by looking at one chart, every currency pair that is trending and the strongest and weakest currencies driving those trends. For full details on how to use this indicator, and also how to get a FREE chart tool, please see user manual HERE
Yazarın diğer ürünleri
Line Profit
Iurii Tokman
5 (3)
Line Profit   Indicator of the visual line of profit in the deposit currency. Works only if there are open positions in the market for the symbol on which the indicator is installed. You can move the line with the mouse or enable automatic tracking of the Bid price. Description of indicator settings: colotLine - line color WidthLine - line width colotText - text color FontSize - the height of the text Anchor - an anchor method for text FollowBid - follow the Bid price
FREE
ChannelRSI5
Iurii Tokman
5 (5)
ChannelRSI5   The Relative Strength Index (RSI) indicator with dynamic levels of overbought and oversold zones. Dynamic levels change and adjust to the current changes in the indicator and prices, and represent a kind of channel. Indicator settings period_RSI - Averaging period for calculating the RSI index. applied_RSI - The applied price. It can be any of the price constants: PRICE_CLOSE - Closing price, PRICE_OPEN - Opening price, PRICE_HIGH - Maximum price for the period, PRICE_LOW - Minimum
FREE
StopLevel   The meter controls the STOPLEVEL level. When the level changes, it signals with an alert. STOPLEVEL - the   minimum offset in points from the current closing price for placing Stop orders, or the minimum allowable stop loss / take profit level in points. A zero value of STOPLEVEL means either the absence of a restriction on the minimum distance for stop loss / take profit, or the fact that the trading server uses external mechanisms for dynamic level control that cannot be transmitte
FREE
The Crazy Scalper trading robot does not use any indicators. It utilizes a scalping system, which trades in two directions simultaneously (buys and sells). Two opposite positions cannot bring profit at the same time, one of them will be losing. If there is a losing position, a lock is used. If the locking position fails and price reverses to the opposite, teh robot moves it to breakeven using the averaging system and pending orders. Settings TakeProfit = 3; - the take profit in points; Lock_Lev
Bar Boss
Iurii Tokman
5 (1)
The Expert Advisor uses the FletBoxPush indicator for market analysis and for determining trading signals. The indicator is built into the Expert Advisor, there is no need to additionally run it on a chart. The EA trades breakouts of certain levels determined as flat borders. The EA uses Stop Loss. Description of EA Parameters TimeFrames chart period required for the indicator colour - the color of the price zone defined as flat, a setting for the indicator Rectangle - show price zones defined
Comb
Iurii Tokman
The indicator displays a grid in the form of a "honeycomb" or regular hexagon. An alternative to the standard grid of the terminal. Description of the indicator settings: color_comb - grid color width - width, for example: 22 for a screen resolution of 1920*1080, 15 for a screen resolution of 1366*768, etc. height - height, for example: 6 for a screen resolution of 1920*1080, 4 for a screen resolution of 1366*768, etc.
FREE
MovingInWL   The Expert Advisor is designed to move the stop of open positions to no loss when they reach a certain predetermined profit level. Description of the advisor settings: MagicNumber - order identifier LevelProfit - The level of profit in points that the position must reach in order for its stop to be moved to the level without loss. LevelWLoss - The level without loss in points, to which the stop position will be transferred after its profit reaches the   LevelProfit   level in points
FREE
Gölge İndikatörü: Her Mumun Gizli Gücünü Ortaya Çıkarın! Yüzeysel fiyat hareketi analizinden bıktınız mı? Her zaman diliminde alıcı ve satıcı gücünü daha derinlemesine anlamak mı istiyorsunuz? Karşınızda Gölge İndikatörü – piyasanın gizli dinamiklerini görselleştirmek ve analiz etmek için vazgeçilmez aracınız! Bu güçlü indikatör, mum gövdelerinin boyutlarında yansıyan boğalar ve ayılar arasındaki görünmez savaşı, doğrudan grafiğinizde net ve bilgilendirici bir histograma dönüştürür. Mum gövdeler
FREE
Robo T Expert Advisor is a non-indicator trading system. Expert Advisor settings: Level_ord - distance from the current price for placing initial pending Buy Stop and Sell Stop orders, the default value is 22. Lot_1 - initial lot for buy series, the default value is 0.1. Lot_2 - initial lot for sell series, the default value is 0.1. TakeProfit - profit level, the default value is 30. TSProfitOnly - only profit is trailed. If disabled, trailing is also performed in the negative stop-loss area. Th
Hammering is an automated trading system which works on any currency pair. Multi-currency and single-currency trading is performed. Making decisions the EA uses signals of the Slope Direction Line indicator. Settings. Profit_Percent_AccountEquity = 0.4; - profit as percentage of free margin Fix_AccountEquity = 0; - fixed level of free margin FIX_PROFIT = 1000; - fixed level of profit period = 55; - indicator period. FilterNumber = 2; - indicator filter. ma_method = 3; - indicator averaging metho
ROBO GRID FX is a grid Expert Advisor. It is developed for intraday trading in the active market and on fast currency pairs. This is a grid EA with a closed-loop averaging system. The closed-loop averaging system represents a stable strategy of moving to breakeven in case of the deposit drawdown on fast and aggressive currency pairs. The EA places a grid of pending orders in both directions and locks it on the breakthrough of a quote fluctuation in the channel of 40-60 points in case of an unrpo
Pyramid MA - Characteristics of the EA: uses Moving Averages (MA) indicator. Changes order grid when a trend reverses. Exponent of order volume increase by the main trading grid against averaging positions. Works on pending BUYSTOP and SELLSTOP orders. Uses a system of averaging losses which controls a balance of open trades and moves it to breakeven. Sound alert about open and completed trades. You can easily create your own trading strategy on the basis of PYRAMID MA. Expert Advisor settings:
The Expert Advisor is based on the indicator analysis. Trading decisions are made using Moving Average values. Indicators can be configured by external variables: TF = 0 - select a working timeframe. It can be one of the chart periods. 0 means the current chart period. 1 - 1 minute. 5 - 5 minutes. 15 - 15 minutes. 30 - 30 minutes. 60 - 1 hour. 240 - 4 hours. 1440 - 1 day. 10 080 - 1 week. 43 200 - 1 month. shift = 0 - index of obtained value from the indicator buffer (shifting back by specified
Forex Jumper is an Expert Advisor for trading EURJPY. Candlestick pattern analysis is used for generating trading signals. The EA uses BUYSTOP and SELLSTOP pending orders. Settings: Lot = 0 - manual setup of the opened orders' volume Risk = 13 - MM risk percentage, the parameter works if Lot = 0 MagicNumber = 208 - ID of EA orders and positions, magic number TP = 20 - virtual profit level in points if there is a single unidirectional open position on the market TP2 = 20 - virtual profit level in
Bands Jazz EA is based on the analysis of the Bollinger Bands indicator. The EA algorithm is simple - it uses Stop Loss, Take Profit and Trailing Stop. Settings TimeBeginHour —trading start hour. Values 0 to 24. TimeBeginMinute —trading start minute. Values 0 to 60. TimeEndHour —trading end hour. Values 0 to 24. TimeEndMinute —trading end minute. Values 0 to 60. period —averaging period for Bollinger Bands calculations. deviation —number of standard deviations from the main line for Bollinger B
Smart YTG
Iurii Tokman
4.6 (5)
Smart YTG has been developed for trading GBPUSD on the H1 chart. This is a trend following system and works well during trending price behavior using STOP orders. It detects trend by analyzing the Price Channel indicator which is built straight into the Expert Advisor, therefore you do not need to additionally install any indicator. On the flat areas where the market is undecided, and further movement of the market is being determined, a breakeven function is activated, and if there are open pos
The Eureka Lock Expert Advisor detects flat price movement intervals relative to the specified settings. Trading is performed by BUY STOP and SELL STOP pending orders from the borders of the defined flat. Instead of limiting the losses, a loss-making position is locked by an increased volume. A virtual profit level is used as well. Settings: TF_flet = 15 - timeframe a flat is detected at Bars_flet = 25 - amount of bars for a flat detection extern int Size_flet = 30 - distance limit between the
The product shows general information in a single chart window. It is convenient when you trade many symbols simultaneously. The indicator shows the total number of positions and pending orders. The following info is displayed for opened positions: symbol, amount of opened buy orders for this symbol and their total profit in deposit currency, amount of opened sell orders and their total profit, total profit of opened buy and sell orders. The following info is displayed for pending orders: symbol
Moving Average. Calculation method: average value of all prices used for determining a bar. Description of External Settings of the EA: MA_period - period of averaging for calculation of the indicator. Recommended values: 5, 13, 21, 34. ma_method - averaging method. It can have any values ​​of the Moving Average method (Moving Average). 0 - (SMA) Simple Moving Average. 1 - (EMA) Exponential Moving Average. SMMA 2 - (SMMA) Smoothed Moving Average. LWMA 3 - (LWMA) Linear weighed Moving Average.
Description of the Settings: MA_period_fast - The period of averaging for calculation of fast Moving Average. MA_period_slow - The period of averaging for calculation of slow Moving Average. price - price used. It can be any of the price constants. 0 - (CLOSE) Close price. 1 - (OPEN) Open price. 2 - (HIGH) The maximum price. 3 - (LOW) The minimum price. 4 - (MEDIAN) The average price, (high+low)/2. 5 - (TYPICAL) Typical price, (high+low+close)/3. 6 - (WEIGHTED) Weighed close price, (high+low+clo
The Piramida Grid EA analyzes the values of the Slope Direction Line indicator for determining position entry. The grid of orders changes once the market reverses. Works on pending BUYSTOP and SELLSTOP orders. Uses a system of averaging losses which controls a balance of open trades and moves it to breakeven. Automatic detection of 4 and 5 decimal places. Expert Advisor Setup: period = 32; - period for the Slope Direction Line indicator FilterNumber = 2; - Slope Direction Line filter setup ma_m
The Martin Pristine trading robot analyzes the signals of the Price Channel Central indicator for trading decisions. No need to additionally attach the indicator to a chart, it's built into the Expert Advisor. After each losing trade, the lot is multiplied by 2. This Expert Advisor can detect 4 and 5-digit quotes automatically. Only one position can be open in the market at the same time. Expert Advisor settings: TF = 15; - select the chart timeframe for Price Channel Central Bars_Count = 100;
The Future Price indicator shows the probable variants of a future price movement based on the searching for matches in the quotes history. The indicator works in two modes: the first iterates over and displays the specified number of variants, the second - the indicator displays one specified variant. Settings Static_VARIANTS = 0; - display a specific variant; if = 0, iterates over all variants TOTAL_VARIANTS = 20; - the number of variants in the set, not greater than 30 is recommended Time_Se
This is a semi-automatic trading robot. Buttons are used to open/close positions. Further position tracking is performed automatically by virtual profit level. Loss-making positions are averaged by increased/decreased lots. The buttons do not work in the strategy tester meaning that you can check the EA only on demo and real accounts. Special settings OPEN_BUY and OPEN_SELL can be used to test the EA in the strategy tester. Settings MagicNumber - identifier of the EA's orders. The robot works o
The indicator determines flat areas of the price movement according to the specified parameters. Settings: FletPips - limit in points for determining the flat FletBars - limit in number of bars for determining the flat CountBars - number of bars in history for the analysis of price movement. 0 - all bars in history are analyzed colir - color of the price section determined as flat Dop - additional drawing of price labels Alerts - display a dialog box with custom data Text - custom text for notif
BarKhan
Iurii Tokman
The BarKhan indicator is calculated as sum of differences of three digital moving averages. The calculation formula is as follows: the difference of digital moving averages 1 and 2 is added to the difference of digital moving averages 2 and 3 Description of the indicator settings: MA_Period1 - the period of the first digital moving average MA_Period2 - the period of the second digital moving average MA_Period3 - the period of the third digital moving average
Octet
Iurii Tokman
Multi-currency indicator, analyzes 56 currency pairs simultaneously. It is important that all currency pairs are selected in the market watch with their history data downloaded. The indicator shows a rise or fall of a certain currency against the other 7 currencies as a total in the form of a line. The indicator values are expressed as a percentage. Description of the indicator settings Type_Calculation - three options for calculating the percentage of the currency rise or fall Prefix - used wh
Multi-currency indicator, analyzes 56 currency pairs simultaneously: AUD EUR GBP NZD CAD CHF JPY USD AUD SUMM EURAUD GBPAUD AUDNZD AUDCAD AUDCHF AUDJPY AUDUSD EUR EURAUD SUMM EURGBP EURNZD EURCAD EURCHF EURJPY EURUSD GBP GBPAUD EURGBP SUMM GBPNZD GBPCAD GBPCHF GBPJPY GBPUSD NZD AUDNZD EURNZD GBPNZD SUMM NZDCAD NZDCHF NZDJPY NZDUSD CAD AUDCAD EURCAD GBPCAD NZDCAD SUMM CADCHF CADJPY USDCAD CHF AUDCHF EURCHF GBPCHF NZDCHF CADCHF SUMM CHFJPY USDCHF JPY AUDJPY EURJPY GBPJPY NZDJPY CADJPY CHFJPY SUMM
The Expert Advisor does not use indicator, it is always in the market. The logic of the EA is based on the analysis of the previously opened orders present in the market. Expert Advisor settings: StopLoss_Percent - loss level in percent TakeProfit - profit level in points Risk - setting for automatic calculation of order volumes for the EA, works if LOT =0 LOT - fixed volume of orders Slippage - maximum allowed price slippage MagicNumber - magic number for EA's orders Show_Information - enable o
The Expert Advisor places a grid of orders with the specified step. Orders have the take profit level set at the distance of grid step, as well as the total stop loss level for all order of the same type. Trading is performed only within the time interval specified in the settings. Once the time ends, all pending orders are deleted and all open positions are force-closed. It is not recommended to use the EA as a fully automated trading system for continuous trading, only for working in certain m
Filtrele:
İnceleme yok
İncelemeye yanıt