Line Profit
- Indicatori
-
Iurii Tokman
 Veda http://ytg.com.ua resource - the author works for automation of trade on the forex market - advisers, experts will, trading robots, indicators, trading strategies, scripts, functions and libraries.
 - Versione: 1.0
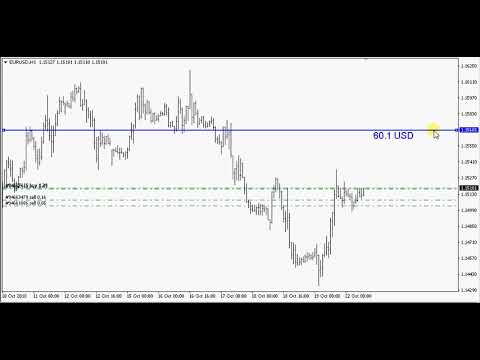
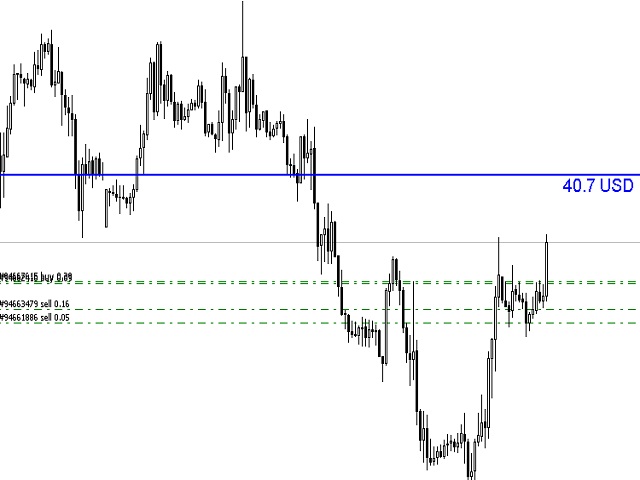
Line Profit
Indicator of the visual line of profit in the deposit currency. Works only if there are open positions in the market for the symbol on which the indicator is installed. You can move the line with the mouse or enable automatic tracking of the Bid price.
Description of indicator settings:
- colotLine - line color
- WidthLine - line width
- colotText - text color
- FontSize - the height of the text
- Anchor - an anchor method for text
- FollowBid - follow the Bid price


Indicador excelente!!! Muito Obrigado!!! Nosso Bom Deus no comando!!!