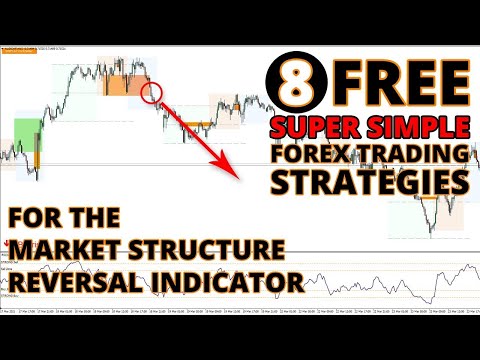
Market Reversal Alerts
- Indicatori
- LEE SAMSON
- Versione: 5.10
- Aggiornato: 12 novembre 2021
- Attivazioni: 10
Il profitto dalla struttura del mercato cambia quando il prezzo si inverte e si ritira.
L'indicatore di avviso di inversione della struttura del mercato identifica quando una tendenza o un movimento di prezzo si sta avvicinando all'esaurimento e pronto a invertire. Ti avvisa dei cambiamenti nella struttura del mercato che in genere si verificano quando stanno per verificarsi un'inversione o un forte pullback.
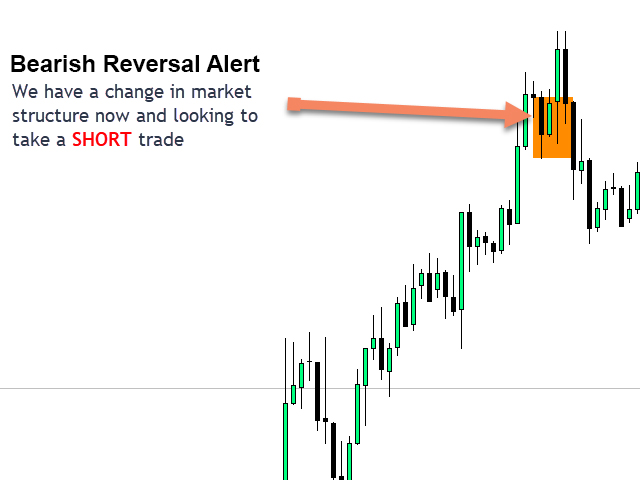
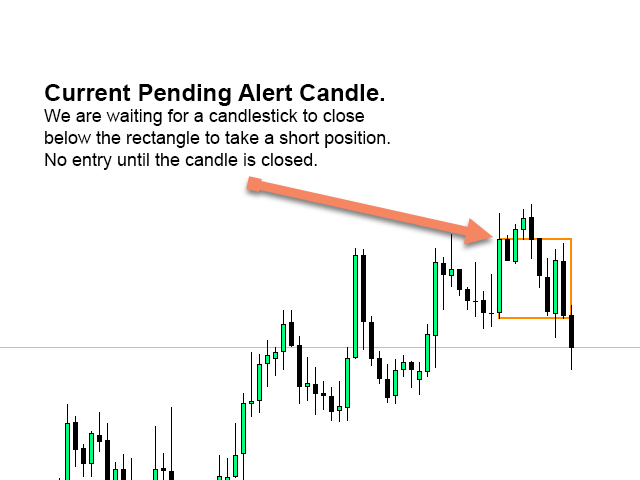
L'indicatore identifica inizialmente i breakout e lo slancio del prezzo, ogni volta che si forma un nuovo massimo o minimo vicino a un possibile punto di esaurimento. L'indicatore disegna un rettangolo sull'ultima candela colorata opposta. Quindi seguirà il rettangolo insieme al prezzo mentre continua a muoversi nella sua attuale tendenza a breve termine. Una volta che il prezzo si indebolisce abbastanza da chiudersi al di sopra o al di sotto del rettangolo, ciò indicherebbe un potenziale cambiamento nella struttura del mercato. L'indicatore ti avvisa quindi di un potenziale cambiamento di direzione e dell'inizio di una possibile inversione di tendenza o di un forte pullback.
Guarda l'indicatore in azione qui sotto per vedere come funziona!
Componente aggiuntivo dashboard opzionale per monitorare TUTTE le coppie e gli intervalli di tempo qui: https://www.mql5.com/en/market/product/62751
EA disponibile qui: Avvisi di inversione del mercato del commercio automatico! https://www.mql5.com/en/market/product/65383
Versione MT5 disponibile qui: https://www.mql5.com/en/market/product/57892
Caratteristiche
Avvisa di potenziali cambiamenti nella struttura del mercato nei punti chiave di esaurimento
Disegna automaticamente la struttura del mercato a breve termine quando il prezzo si avvicina ai livelli di esaurimento
Segue i rettangoli di avviso dietro il prezzo mentre si muove nella direzione del trend attuale per trovare le voci più strette
Cambia il colore in un rettangolo a blocco pieno sugli avvisi per mostrare dove si sono verificate potenziali inversioni nella struttura del mercato
Funziona su tutti i simboli e tempi
Avvisi pop-up, push ed e-mail integrati integrati
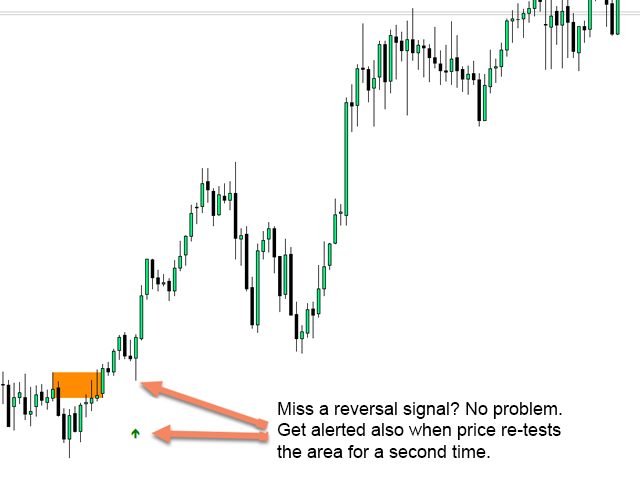
Avvisi quando si è verificato un nuovo test di un avviso di inversione confermando che l'immissione è più probabile
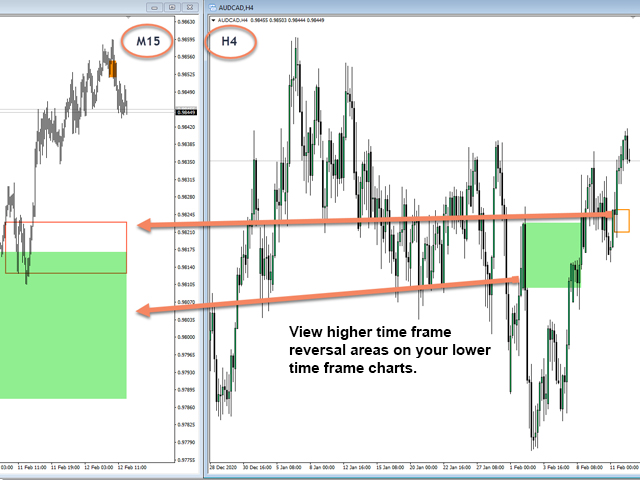
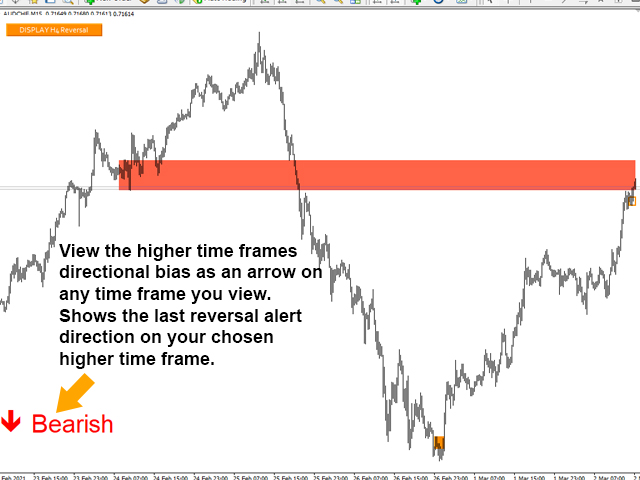
Ti consente di visualizzare i rettangoli di inversione del periodo di tempo più alto nel periodo di tempo di trading più basso. Ottimo per i trader di tendenza e per identificare la direzione del trend in tempi più lunghi
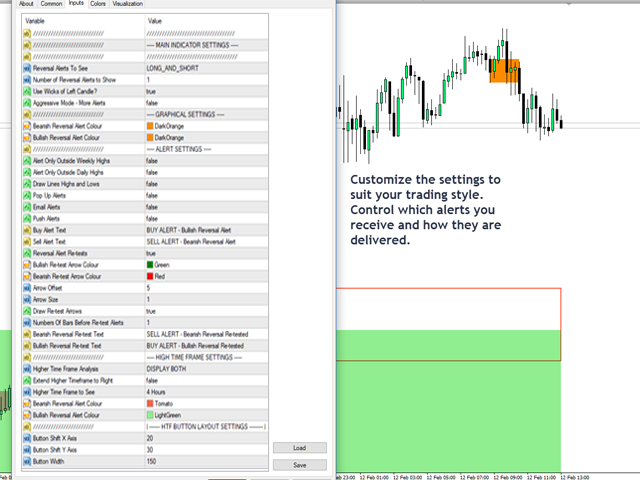
Seleziona tutti gli avvisi di inversione o solo gli avvisi lunghi o brevi, seleziona gli avvisi direzionali desiderati in base alla direzione del trend corrente di ciascuna coppia
Visualizza la freccia di distorsione direzionale dell'intervallo di tempo più alto sul grafico dell'intervallo di tempo inferiore.
Strategia e come negoziare con l'indicatore di inversione della struttura del mercato
Quando si verifica un avviso di inversione:
Guardare a sinistra! C'è un livello di offerta/domanda o supporto/resistenza a cui ci stiamo rivolgendo. I cambiamenti (inversioni) della struttura del mercato di solito si verificano quando il prezzo esegue nuovamente il test di un vecchio livello o si è appena verificata una caccia allo stop al di sopra di quel livello di supporto o resistenza.
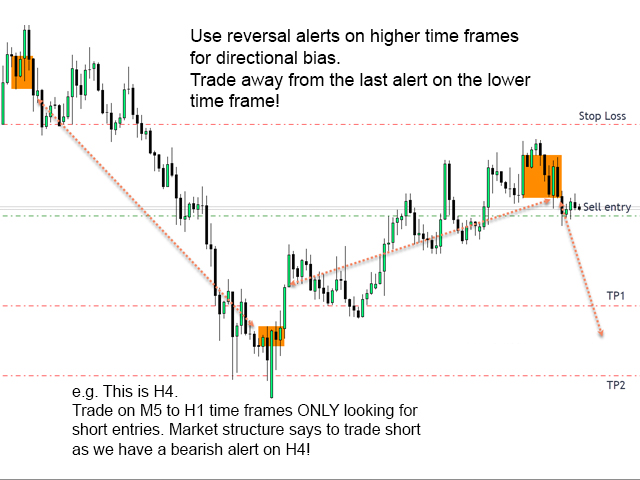
Consulta un intervallo di tempo più alto per vedere se c'è un'area di supporto/resistenza a cui ci stiamo rivolgendo. Come sopra, i cambiamenti nella struttura del mercato si verificano spesso in intervalli di tempo inferiori quando a livelli principali in un intervallo di tempo più elevato.
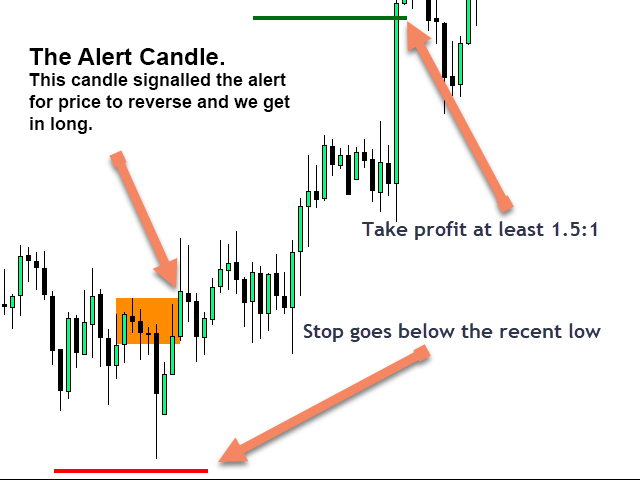
Se le condizioni di cui sopra sono soddisfatte, piazza semplicemente uno scambio nella direzione dell'inversione.
Puoi aggiungere ulteriori indicatori come convalida o utilizzare questo indicatore per aggiungere ulteriore convalida agli indicatori o alla strategia esistenti!
Ferma la perdita e prendi profitto
Il tuo stop dovrebbe sempre andare appena al di sopra del massimo più recente o al di sotto del minimo più recente. Se l'inversione identifica correttamente uno spostamento nella struttura del mercato, il prezzo raramente tornerà al di sopra/al di sotto del picco più recente. La dimensione del tuo stop dipenderà da quanto è stata aggressiva l'ultima mossa per creare il massimo recente.


magnifico indicador, útil en mi estrategias de trading muy recomendable