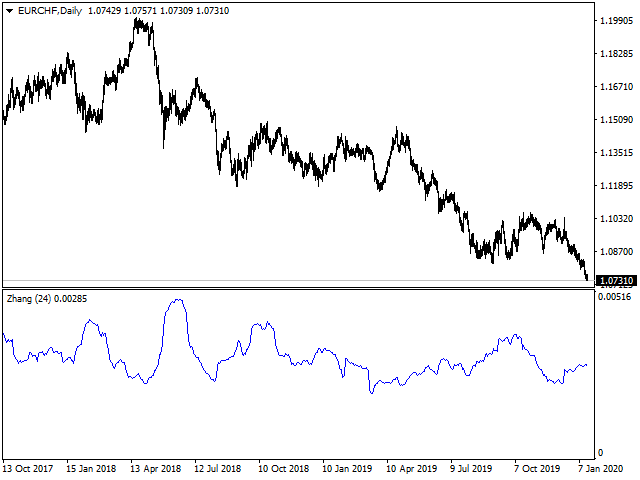
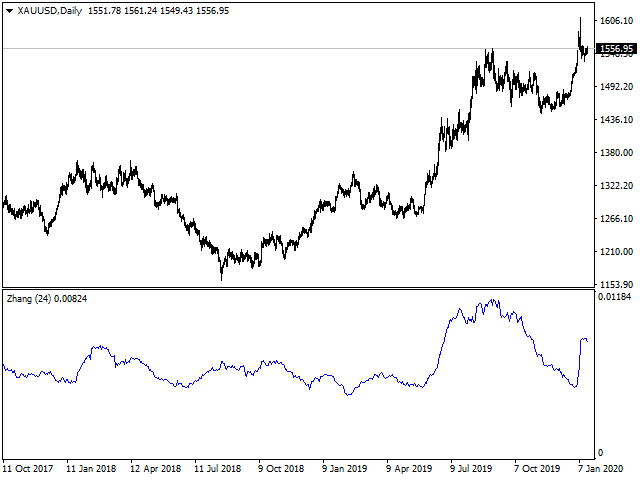
Zhang Historical Volatility Indicator

In finance, volatility (symbol σ) is the degree of variation of a trading price series over time as measured by the  standard deviation of logarithmic returns.

Historic volatility measures a time series of past market prices. Implied volatility looks forward in time, being derived from the market price of a market-traded derivative (in particular, an option).

In 2000 Yang-Zhang created a volatility measure that handles both opening jumps and drift. It is the sum of the overnight volatility (close-to-open volatility) and a weighted average of the Rogers-Satchell volatility and the open-to-close volatility. The assumption of continuous prices does mean the measure tends to slightly underestimate the volatility -  https://www.jstor.org/stable/10.1086/209650?seq=1#metadata_info_tab_contents

For using from within an Expert Adviser, call the indicator with

iCustom(NULL,0,"ZhangHistoricalVolatility",24,0,0);


Prodotti consigliati
The Visual Volatility Clustering indicator clusters the market based on volatility. The indicator does not redraw and gives accurate data, does not use closing prices. Uses the opening prices or the highs or lows of the previous completed bar. Therefore, all information will be clear and unambiguous. The essence of the indicator is to divide the price market into certain areas according to a similar type of volatility. This can be done in any way. In this example, the indicator is configured fo
Daily Average Retracement Dashboard is an indicator that allows you to monitor multiple currency pairs at one time. This indicator is mainly for strategies that trade price retracement based on Resistance 3/4 or Support 3/4. After applying this indicator to the chart window, it will hide the chart and display the currency pairs in a table form. There are several data shown on the table that will help trader know when to analyze the currency and do trade using retracement. The indicator will show
Pointer View
Andrei Gerasimenko
The indicator marks the points on the chart where the standard ZigZag indicator has drawn its top or bottom. With this indicator, you can easily understand where the top or bottom was formed, and where it was redrawn. The indicator gives an alert when a new point appears. Warning! Parameter  Applied Price   -   expands the possibilities of building the indicator.   It is possible to build at OPEN, CLOSE and standard HIGH/LOW prices. Input parameters ----------- Depth   - period of the ZigZag ind
FREE
Cosmic Nebula
Pieter Gerhardus Van Zyl
Cosmic Nebula is an advanced MT4 momentum and trend-state oscillator that transforms classical ADX directional flow into a multi-state market structure model. By combining directional pressure, triple-EMA (TEMA) smoothing, and weighted signal comparison, it visualizes market conditions as distinct “cosmic phases,” allowing traders to instantly recognize trend strength, transitions, and exhaustion. The indicator runs in a separate window and plots four color-coded histogram states around a zero e
TWO PAIRS SQUARE HEDGE METER INDICATOR Try this brilliant 2 pairs square indicator It draws a square wave of the relation between your two inputs symbols when square wave indicates -1 then it is very great opportunity to SELL pair1 and BUY Pair2 when square wave indicates +1 then it is very great opportunity to BUY pair1 and SELL Pair2 the inputs are : 2 pairs of symbols         then index value : i use 20 for M30 charts ( you can try other values : 40/50 for M15 , : 30 for M30 , : 10 for H1 ,
This indicator alerts you when/before new candle bar formed. In other words,this indicator alerts you every 1/5/30/60/240 minutes. This indicator is especially useful for traders who trade when new bars formed. *This indicator don't work propery in strategy tester.Use Free Version to check functionality in live trading. Input Parameters Alert_Or_Sound =Sound ----- Choose alert or sound or both to notify you when new bar is coming. Enable_1mBarAlert ----- Enable alert for 1 min bar diff_1m --
Proxy OrderFlow MT4
Vincent Jose Proenca
5 (1)
Indicatore basato sul disequilibrio del tick-spread. TF: Funziona su tutti i timeframe (da M1 a D1). Coppie: Compatibile con Forex, indici, oro e CFD (regolazione automatica per JPY, Oro e CFD). Impostazioni: TickWindow (200) – finestra di osservazione dei tick SpreadWeight (1.5) – peso dello spread NormalizationPeriod (20) – periodo di normalizzazione (z-score) Overbought / Oversold (±3.0) – soglie di allerta AlertCooldown (300s) – tempo di raffreddamento tra gli avvisi Conclusione: Proxy Or
Time Bubble ***Specialized for GBPJPY 1H time frame*** (tested for two years with success rates about 82%) Time Circle's smart algorithm detects the price circles with time . give strong signals at the right time as result of combine the price and time. our team spent months to develop this indicator specially for GBPJPY ..with high success rates about 82% win trades over two years .tested from December 2016 to November 2018. *** in last two years total signals 1012 with 829 Wins and 183 Lo
Blahtech Market Profile
Blahtech Limited
4.53 (15)
Was: $249  Now: $99   Market Profile defines a number of day types that can help the trader to determine market behaviour. A key feature is the Value Area, representing the range of price action where 70% of trading took place. Understanding the Value Area can give traders valuable insight into market direction and establish the higher odds trade. It is an excellent addition to any system you may be using. Blahtech Limited presents their Market Profile indicator for the MetaTrader community. Ins
Multi Pivot Indicator - Professional Trading Tool MULTI PIVOT PRO INDICATOR Professional Multi Pivot Indicator for MT4 5-in-1 Pivot Indicator Professional Trading Tool for MetaTrader 4 ENGLISH TÜRKÇE Multi Pivot Indicator PRO Classic Fibonacci Camarilla Woodie DM What is Multi Pivot Indicator? Multi Pivot Indicator is a professional trading tool that displays 5 different pivot calculation methods on your MetaTrader 4 charts. Pivot points are critical support and resistance
Il nostro indicatore Basic Support and Resistance è la soluzione necessaria per aumentare l'analisi tecnica.Questo indicatore consente di proiettare i livelli di supporto e resistenza sul grafico/ MT5 gratuita Funzionalità Integrazione dei livelli di Fibonacci: Con la possibilità di visualizzare i livelli di Fibonacci insieme a livelli di supporto e resistenza, il nostro indicatore ti dà una visione ancora più profonda del comportamento del mercato e delle possibili aree di inversione. Ottimi
The   Visual Volatility Clustering   indicator clusters the market based on volatility. The indicator does not redraw and gives accurate data, does not use closing prices. Uses the opening prices or the highs or lows of the previous completed bar. Therefore, all information will be clear and unambiguous. The essence of the indicator is to divide the price market into certain areas according to a similar type of volatility. This can be done in any way. In this example, the indicator is configure
Octave Fractal Channel — Dynamic Gann-Based Support/Resistance Levels with Auto-Scaling. This indicator plots a dynamic channel based on the fractal structure of price movement. Channel levels adapt to the current symbol and timeframe, making it suitable for use across various financial instruments — from currency pairs to cryptocurrencies and indices. The indicator can be used in combination with other technical tools, such as the RSI oscillator, to provide additional signal filtering. How to
We present you the indicator "Candle closing counter", which will become your indispensable assistant in the world of trading. That’s why knowing when the candle will close can help: If you like to trade using candle patterns, you will know when the candle will be closed. This indicator will allow you to check if a known pattern has formed and if there is a possibility of trading. The indicator will help you to prepare for market opening and market closure. You can set a timer to create a pre
Support and Resistance Zones MultiTimeframe
Mohamed Gamal Abdelnasser Yous Hashesh
A powerful indicator that highlights key market zones and helps traders identify potential opportunities across multiple timeframes. Designed for clarity and efficiency, it provides real-time alerts to keep you informed of important price levels. Key Features: Works on multiple timeframes: M1, M5, M15, M30, H1, H4, D1, W1, MN1. Customizable zone colors for each timeframe. Real-time alerts and notifications when price reaches significant zones. Automatically manages chart objects to keep your wo
Volume Profile Sniper v11. 1 è uno strumento completo per l'analisi di mercato Un approccio professionale al trading Volume Profile Sniper v11.1 integra più di 15 filtri chiave in un unico indicatore, fornendo segnali chiari basati su una valutazione completa della situazione del mercato. Caratteristiche principali Analisi dello squilibrio di volume-l'algoritmo calcola la percentuale di acquirenti e venditori in ciascuna candela, segnalando la predominanza di una delle parti (soglia configurab
Trade Sniper MT4
Thomas Bradley Butler
MT4 is a Histogram version of MT5:  https://www.mql5.com/en/market/product/122151 Introducing Trade Sniper: Your Edge in the Markets.  Tired of missing profitable trades or getting caught on the wrong side of the market? Meet Trade Sniper, the cutting-edge indicator that harnesses the power of trends to give you a razor-sharp advantage in your trading. Trend Sniper is not just another run-of-the-mill indicator. It's a sophisticated tool that combines advanced algorithms with time-tested trading
Swing trading is a method in which traders attempt to take advantage of market fluctuations. They buy a security when they believe the market will rise and sell if they feel the market will fall, which, as you can imagine, is common in most trading strategies, irrespective of trading style. The four most frequently occurring patterns in the swing trading domain are reversal, retracement (or pullback), breakouts, and breakdowns. it work all currency pair, and work all timeframe 100% non repaint
The   VWAP indicator   is our version of the popular Volume-Weighted Average Price indicator. The VWAP is the ratio between the value traded (price multiplied by the number of volume traded) and the total volume traded over a specific time period. As a result, it measures the average price of the instrument much better than the simple moving average. Although there are many ways to use the VWAP, most investors use it to calculate the daily average.  The indicator works in five modes: Moving  -
L'indicatore mostra i punti pivot giornalieri. È possibile specificare il numero di giorni da visualizzare. Per il forex non considera i dati della sessione domenicale. È possibile modificare il colore, lo stile e la larghezza per ogni livello. È meglio utilizzare questo indicatore con un intervallo di tempo non superiore a Н1. 4 Livelli di supporto e resistenza con anche Livelli Intermedi che è possibile nascondere. Trading sui pivot: Perno 1.pp 2. r1 r2 r3, s1 s2 s3 I punti pivot sono st
Currency Strength Meter AI
Odaine Ramon Mcmillan
4.14 (7)
Introducing our A.I Currency Strength Meter Forex Indicator, a state-of-the-art tool designed to provide forex traders with real-time insights into the strength of various currencies. Leveraging the latest advancements in artificial intelligence and machine learning, this innovative indicator analyzes market data in real-time, providing users with accurate and up-to-date information to inform their trading decisions. In addition to its cutting-edge algorithms, the Currency Strength Meter Forex I
Il dashboard di avviso RSI / TDI ti consente di monitorare gli RSI contemporaneamente (selezionabili da te) su ogni coppia principale scambiata. Puoi usarlo in due modi: 1. Seleziona più intervalli di tempo e il trattino ti mostrerà quando ci sono più intervalli di tempo estesi oltre le normali condizioni di trading. Un ottimo indicatore del fatto che il prezzo ha spinto al massimo di recente poiché ha raggiunto un livello di ipercomprato o ipervenduto su più intervalli di tempo, quindi un r
L'indicatore SMC Venom Model BPR è uno strumento professionale per i trader che operano nell'ambito del concetto di Smart Money (SMC). Identifica automaticamente due modelli chiave sul grafico dei prezzi: FVG   (Fair Value Gap) è una combinazione di tre candele, in cui c'è un gap tra la prima e la terza candela. Forma una zona tra livelli in cui non c'è supporto di volume, il che spesso porta a una correzione dei prezzi. BPR   (Balanced Price Range) è una combinazione di due modelli FVG che for
Gold Trend 4
Sergei Linskii
Gold Trend   - è un buon indicatore tecnico azionario. L'algoritmo dell'indicatore analizza il movimento del prezzo di un asset e riflette la volatilità e le potenziali zone di ingresso. I migliori segnali dell'indicatore: - Per VENDERE = istogramma rosso + puntatore SHORT rosso + freccia di segnale gialla nella stessa direzione + freccia rossa di direzione del trend. - Per l'ACQUISTO = istogramma blu + puntatore LONG blu + freccia di segnale acquatica nella stessa direzione + freccia blu di
Gold Venamax MT4
Sergei Linskii
3 (2)
Gold Venamax : questo è il miglior indicatore tecnico azionario. L'algoritmo dell'indicatore analizza il movimento dei prezzi di un asset e riflette la volatilità e le potenziali zone di ingresso. Caratteristiche dell'indicatore: Questo è un super indicatore con Magic e due blocchi di frecce di tendenza per un trading comodo e redditizio. Sul grafico viene visualizzato il pulsante rosso per cambiare blocco. Magic è impostato nelle impostazioni dell'indicatore, in modo da poter installare l'indi
This multicurrency indicator is the Lite version of the Cosmic Diviner Reversal Zone Pro indicator. The indicator is based on original formulas for analyzing the volatility and price movement strength. This allows determining the overbought and oversold states of instruments with great flexibility, as well as setting custom levels for opening buy or sell orders when the overbought or oversold values of the instruments reach a user-defined percentage. A huge advantage of Reversal Zone Lite is the
Volume Confirm Trend Zone is the indicator for filtering sideways and confirm trend to help your system trading. Indicator can use every currency pairs, every time frame, and every broker. You can see trend zone when color to change in volume indicator. Features When the color changes to the blue: Buy Zone is a strong trend. When the color changes to the red: Sell Zone is a strong trend.
IconTradeSL
Vadim Gorodetskii
IconTradeSL.  Возможность выставлять sl по уровням. В индикаторе установлена возможность показывать историю уровней на графике. Возможность выставлять sl по уровням. Настройки индикатора: ЦВЕТ_BAR - цвет баров по которым ищем SL ЦВЕТ_Тек_BAR - Purple;//цвет текущего бара BAR - поиск в последних BAR барах (по умолчанию 200) show_bar - показывать бары по которым ищем SL
"Impulses and Corrections 4" is created to help traders navigate the market situation. The indicator shows multi-time frame upward and downward "Impulses" of price movements. These impulses are the basis for determining the "Base" , which is composed of zones of corrections of price movements, as well as "Potential" zones for possible scenarios of price movement. Up and down impulses are determined based on a modified formula of Bill Williams' "Fractals" indicator. The last impulse is always "U
Indicatore di gestione del rischio e monitoraggio dei limiti per trader professionisti e account di valutazione (Prop) Questo strumento visualizza esclusivamente sul grafico informazioni precise su gestione del rischio e limiti, per aiutarti a decidere con maggiore concentrazione. L’indicatore non apre/chiude/modifica operazioni e non interferisce con gli Expert Advisor. Caratteristiche Monitoraggio del drawdown giornaliero e totale Calcola e mostra il drawdown giornaliero e totale in base a Ba
Gli utenti di questo prodotto hanno anche acquistato
Gann Made Easy
Oleg Rodin
4.83 (160)
Gann Made Easy è un sistema di trading Forex professionale e facile da usare che si basa sui migliori principi del trading utilizzando la teoria di mr. WD Gann. L'indicatore fornisce segnali ACQUISTA e VENDI accurati, inclusi i livelli di Stop Loss e Take Profit. Puoi fare trading anche in movimento utilizzando le notifiche PUSH. CONTATTAMI DOPO L'ACQUISTO PER RICEVERE GRATUITAMENTE LE ISTRUZIONI DI TRADING E OTTIMI INDICATORI EXTRA! Probabilmente hai già sentito parlare molte volte dei metodi d
M1 Sniper
Oleg Rodin
5 (21)
M1 SNIPER è un sistema di indicatori di trading facile da usare. Si tratta di un indicatore a freccia progettato per l'intervallo temporale M1. L'indicatore può essere utilizzato come sistema autonomo per lo scalping sull'intervallo temporale M1 e come parte del tuo sistema di trading esistente. Sebbene questo sistema di trading sia stato progettato specificamente per il trading sull'intervallo temporale M1, può comunque essere utilizzato anche con altri intervalli temporali. Inizialmente ho pro
Scalper Inside PRO
Alexey Minkov
4.74 (69)
Scalper Inside PRO – Since 2020. An exclusive indicator that utilizes an innovative algorithm to swiftly and accurately determine the market trend. The indicator automatically calculates opening, closing, and profit levels, providing detailed trading statistics. With these features, you can choose the most appropriate trading instrument for the current market conditions. Additionally, you can easily integrate your own arrow indicators into Scalper Inside Pro to quickly evaluate their statistics
Market Makers
Mohamed Hassan
5 (3)
After purchase, contact me privately to receive 1 month of free testing with EA Forex Proton! This advanced MT4 trading robot automatically executes signals from any MT4 indicator, including Market Makers. The latest version also includes AI integration, allowing each trade signal to be analyzed using Artificial Intelligence. Live Signal with EA Forex Proton: Click here Market Makers is a powerful price action trading system designed to identify high-probability Buy and Sell opportunities based
Innanzitutto, vale la pena sottolineare che questo Strumento di Trading è un Indicatore Non-Ridipingente, Non-Ridisegnante e Non-Laggante, il che lo rende ideale per il trading professionale. Corso online, manuale utente e demo. L'Indicatore Smart Price Action Concepts è uno strumento molto potente sia per i nuovi che per i trader esperti. Racchiude più di 20 utili indicatori in uno solo, combinando idee di trading avanzate come l'Analisi del Trader del Circolo Interno e le Strategie di Trading
Ultimate Sniper Dashboard
Hispraise Chinedum Abraham
4.82 (22)
Scontato a 299 dollari! I prezzi potrebbero aumentare in futuro! Leggi la descrizione qui sotto! Il miglior sistema di ingresso per la plancia Ultimate Sniper: LIVELLI DINAMICI FINALI. (Si prega di controllare i miei prodotti) L'Ultimate Sniper Dashboard funziona SOLO sui mercati live a causa dei limiti di test della MT4 multicurrency. Vi presentiamo l'Ultimate Sniper Dashboard! Il nostro migliore che contiene sia HA-Sniper, MA-Sniper e molte modalità speciali. Il cruscotto Ultimate Sniper è
Trend Screener
STE S.S.COMPANY
4.79 (95)
Indicatore di tendenza, soluzione unica rivoluzionaria per il trading di tendenze e il filtraggio con tutte le importanti funzionalità di tendenza integrate in un unico strumento! È un indicatore multi-timeframe e multi-valuta al 100% non ridipingibile che può essere utilizzato su tutti i simboli/strumenti: forex, materie prime, criptovalute, indici e azioni. OFFERTA A TEMPO LIMITATO: l'indicatore di screening di supporto e resistenza è disponibile a soli 50$ e a vita. (Prezzo originale 250$) (o
L'indicatore " Dynamic Scalper System " è progettato per il metodo di scalping, ovvero per il trading all'interno di onde di trend. Testato sulle principali coppie di valute e sull'oro, è compatibile con altri strumenti di trading. Fornisce segnali per l'apertura di posizioni a breve termine lungo il trend, con ulteriore supporto al movimento dei prezzi. Il principio dell'indicatore. Le frecce grandi determinano la direzione del trend. Un algoritmo per generare segnali per lo scalping sotto fo
Atomic Analyst
Issam Kassas
5 (5)
Innanzitutto, vale la pena sottolineare che questo indicatore di trading non è repaint, non è ridisegno e non presenta ritardi, il che lo rende ideale sia per il trading manuale che per quello automatico. Manuale utente: impostazioni, input e strategia. L'Analista Atomico è un indicatore di azione del prezzo PA che utilizza la forza e il momentum del prezzo per trovare un miglior vantaggio sul mercato. Dotato di filtri avanzati che aiutano a rimuovere rumori e segnali falsi, e aumentare il pote
Super Signal – Skyblade Edition Sistema professionale di segnali di tendenza senza repaint / senza ritardo con tasso di vincita eccezionale | Per MT4 / MT5 Funziona meglio su timeframe più bassi, come 1 minuto, 5 minuti e 15 minuti. Caratteristiche principali: Super Signal – Skyblade Edition è un sistema intelligente di segnali progettato specificamente per il trading di tendenza. Utilizza una logica di filtraggio multilivello per identificare esclusivamente i movimenti direzionali forti, supp
Trend indicator AI
Ramil Minniakhmetov
4.53 (83)
Trend Ai indicator è un ottimo strumento che migliorerà l'analisi di mercato di un trader combinando l'identificazione della tendenza con punti di ingresso utilizzabili e avvisi di inversione. Questo indicatore consente agli utenti di navigare nelle complessità del mercato forex con fiducia e precisione Oltre ai segnali primari, l'indicatore Ai di tendenza identifica i punti di ingresso secondari che si presentano durante i pullback o i ritracciamenti, consentendo ai trader di capitalizzare le
Vi presentiamo ON Trade Waves Patterns Harmonic Elliot Wolfe, un indicatore avanzato progettato per rilevare vari tipi di pattern sul mercato utilizzando metodi sia manuali che automatici. Ecco come funziona: Pattern Armonici: Questo indicatore è in grado di individuare pattern armonici che appaiono sul vostro grafico. Questi pattern sono fondamentali per i trader che praticano la teoria del trading armonico, come descritta nel libro di Scott Carney "Harmonic Trading vol 1 & 2". Che li disegniat
Currency Strength Wizard è un indicatore molto potente che ti fornisce una soluzione all-in-one per un trading di successo. L'indicatore calcola la potenza di questa o quella coppia forex utilizzando i dati di tutte le valute su più intervalli di tempo. Questi dati sono rappresentati in una forma di indice di valuta facile da usare e linee elettriche di valuta che puoi utilizzare per vedere il potere di questa o quella valuta. Tutto ciò di cui hai bisogno è collegare l'indicatore al grafico che
TPSpro RFI Levels
Roman Podpora
4.86 (28)
ISTRUZIONI RUS  /  ISTRUZIONI   ENG  /  Versione MT5 Funzioni principali: Visualizza le zone attive di venditori e acquirenti! L'indicatore mostra tutti i livelli/zone di primo impulso corretti per acquisti e vendite. Quando questi livelli/zone vengono attivati, ovvero dove inizia la ricerca dei punti di ingresso, i livelli cambiano colore e vengono riempiti con colori specifici. Vengono visualizzate anche delle frecce per una percezione più intuitiva della situazione. LOGIC AI - Visualizzazion
BTMM State Engine Pro is a MetaTrader 4 indicator for traders who use the Beat The Market Maker approach: Asian session context, kill zone timing, level progression, peak formation detection, and a multi-pair scanner from a single chart. It combines cycle state logic with a built-in scanner dashboard so you do not need the same tool on many charts at once. What it does Draws the Asian session range; session times can follow broker server offset or be set in inputs. Tracks level progression (L
Linear Trend Predictor : indicatore di tendenza che combina punti di ingresso e linee di supporto direzionale. Funziona secondo il principio di rottura del canale dei prezzi alto/basso. L'algoritmo dell'indicatore filtra il rumore di mercato, tiene conto della volatilità e delle dinamiche di mercato. Capacità dell'indicatore Utilizzando metodi di smoothing, mostra l'andamento del mercato e i punti di ingresso per l'apertura di ordini di ACQUISTO o VENDITA. Adatto per determinare i movimenti d
ATTUALMENTE SCONTATO DEL 40% La soluzione migliore per ogni principiante o trader esperto! Questo indicatore è uno strumento di trading unico, di alta qualità e conveniente perché abbiamo incorporato una serie di caratteristiche proprietarie e una nuova formula. Con un solo grafico è possibile leggere la forza delle valute per 28 coppie Forex! Immaginate come migliorerà il vostro trading perché sarete in grado di individuare l'esatto punto di innesco di una nuova tendenza o di un'opportunità
Easy Breakout
Mohamed Hassan
4.71 (14)
After your purchase, feel free to contact me for more details on how to receive a bonus indicator called VFI, which pairs perfectly with Easy Breakout for enhanced confluence!    Easy Breakout is a powerful price action trading system built on one of the most popular and widely trusted strategies among traders: the Breakout strategy ! This indicator delivers crystal-clear Buy and Sell signals based on breakouts from key support and resistance zones. Unlike typical breakout indicators, it levera
Volatility Trend System - un sistema di trading che fornisce segnali per le voci. Il sistema di volatilità fornisce segnali lineari e puntuali nella direzione del trend, nonché segnali per uscirne, senza ridisegnare e ritardi. L'indicatore di tendenza monitora la direzione della tendenza a medio termine, mostra la direzione e il suo cambiamento. L'indicatore di segnale si basa sui cambiamenti della volatilità e mostra gli ingressi nel mercato. L'indicatore è dotato di diversi tipi di avvisi. Pu
Trend Lines PRO
Roman Podpora
5 (1)
LINEE DI TENDENZA PRO       Aiuta a capire dove il mercato sta realmente cambiando direzione. L'indicatore mostra reali inversioni di tendenza e punti in cui i principali attori rientrano. Vedi  Linee BOS   Cambiamenti di tendenza e livelli chiave su timeframe più ampi, senza impostazioni complesse o rumore inutile. I segnali non vengono ridisegnati e rimangono sul grafico dopo la chiusura della barra. VERSIONE MT 5     -      Svela il suo massimo potenziale se abbinato all'indicatore   RFI LEVE
Order Block Hunter
Noha Mohamed Fathy Younes Badr
5 (10)
Order block hunter indicator is the best indicator for  hunt the order blocks that area where there has been a large concentration of limit orders waiting to be executed Order blocks are identified on a chart by observing previous price action and looking for areas where the price experienced significant movement or sudden changes in direction .This indicator does that for you by using very complicated codes and helps you to take the best areas To buy and sell because it make marks at the best a
GOLD Impulse with Alert
Bernhard Schweigert
4.67 (12)
Questo indicatore è una super combinazione dei nostri 2 prodotti Advanced Currency IMPULSE with ALERT  +   Currency Strength Exotics . Funziona per tutti i time frame e mostra graficamente l'impulso di forza o debolezza per le 8 valute principali più un simbolo! Questo indicatore è specializzato nel mostrare l'accelerazione della forza delle valute per qualsiasi simbolo come oro, coppie esotiche, materie prime, indici o futures. Primo nel suo genere, qualsiasi simbolo può essere aggiunto all
Apollo SR Master è un indicatore di Supporto/Resistenza con caratteristiche speciali che rendono il trading con le zone di Supporto/Resistenza più semplice e affidabile. L'indicatore calcola le zone di Supporto/Resistenza in tempo reale senza alcun ritardo, rilevando i massimi e i minimi dei prezzi locali. Quindi, per confermare la nuova area SR formata, l'indicatore mostra un segnale speciale che segnala che la zona SR può essere presa in considerazione e utilizzata come un vero e proprio segna
KT Gaussian Trend Filter MT4
KEENBASE SOFTWARE SOLUTIONS
KT Gaussian Trend Filter combina il filtraggio gaussiano con la regressione lineare per offrire un’analisi di tendenza chiara e precisa. Genera segnali di acquisto e vendita facili da interpretare, mettendo in evidenza la direzione di lungo periodo del mercato. Caratteristiche Filtro gaussiano completamente personalizzabile: Regola lunghezza e poli per perfezionare il livello di smoothing e migliorare la leggibilità del trend. Regressione lineare avanzata: Raffina ulteriormente il filtraggio ga
Advanced Supply Demand
Bernhard Schweigert
4.91 (299)
Speciale Trading- SCONTO DEL 40% La soluzione migliore per qualsiasi trader principiante o esperto! Questo indicatore è uno strumento di trading unico, di alta qualità e conveniente, perché abbiamo incorporato una serie di funzionalità proprietarie e una nuova formula. Con questo aggiornamento, potrai visualizzare doppie zone di timeframe. Non solo potrai visualizzare un TF più alto, ma anche entrambi, il TF del grafico e il TF più alto: MOSTRA ZONE ANNIDATE. Tutti i trader che operano con Of
Route Lines Prices - è un indicatore progettato per individuare le direzioni di prezzo. La sua interfaccia semplice contiene diversi algoritmi per il calcolo del comportamento dei prezzi e della direzione futura. Questi algoritmi includono il calcolo della volatilità e lo smussamento dei prezzi in base ai timeframe utilizzati. L'indicatore ha un singolo parametro per modificare il valore di " Calculating price values ". Il valore predefinito di 1 fornisce un calcolo automatico bilanciato, che p
PRO Renko System
Oleg Rodin
5 (30)
PRO Renko System è un sistema di trading altamente accurato appositamente progettato per il trading di grafici RENKO. Questo è un sistema universale che può essere applicato a vari strumenti di trading. Il sistema neutralizza efficacemente il cosiddetto rumore di mercato che consente di accedere a segnali di inversione accurati. L'indicatore è molto facile da usare e ha un solo parametro responsabile della generazione del segnale. Puoi facilmente adattare lo strumento a qualsiasi strumento di
- Real price is 80$ - 40% Discount (It is 49$ now) Contact me for instruction, add group and any questions! - Non-repaint - I just sell my products in Elif Kaya profile, any other websites are stolen old versions, So no any new updates or support. - Lifetime update free Related product:   Bitcoin Expert Introduction The breakout and retest strategy is traded support and resistance levels. it involves price breaking through a previous level.  The break and retest strategy is designed to help tr
Daily Candle Predictor è un indicatore che prevede il prezzo di chiusura di una candela. L'indicatore è destinato principalmente all'uso sui grafici D1. Questo indicatore è adatto sia per il trading forex tradizionale che per il trading di opzioni binarie. L'indicatore può essere utilizzato come sistema di trading autonomo o può fungere da aggiunta al sistema di trading esistente. Questo indicatore analizza la candela corrente, calcolando alcuni fattori di forza all'interno del corpo della cande
Indicatore Miraculous – Strumento Forex e Binario 100% Non-Repaint Basato sul Quadrato di Nove di Gann Questo video presenta l' Indicatore Miraculous , uno strumento di trading altamente accurato e potente, sviluppato specificamente per i trader di Forex e Opzioni Binarie . Ciò che rende unico questo indicatore è la sua base sul leggendario Quadrato di Nove di Gann e sulla Legge della Vibrazione di Gann , rendendolo uno degli strumenti di previsione più precisi disponibili nel trading moderno. L
Altri dall’autore
Introduction Professional traders use pivot points as support/resistance levels or as an indicator of a trend. Basically, a pivot point are areas at which the direction of price movement can  possibly  change. What makes pivot points so popular is their objectivity as they are recalculated each time the price moves further. The pivot points indicator implements 5 popular pivot points calculation and drawing: Standard –  The most basic and popular type of the pivots, each point serve as an indica
Description The Hurst exponent is referred to as the “index of dependence” or “index of long-range dependence”. It quantifies the relative tendency of a time series either to regress strongly to the mean or to cluster in a direction. A value H in the range 0.5–1 indicates a time series with long-term positive autocorrelation, meaning both that a high value in the series will probably be followed by another high value and that the values a long time into the future will also tend to be high. A va
Introduction It is common practice for professional trades to hide their stop loss / take profit from their brokers. Either from keeping their strategy to the themselves or from the fear that their broker works against them. Using this indicator, the stop loss / take profit points will be drawn on the product chart using the bid price. So, you can see exactly when the price is hit and close it manually.  Usage Once attached to the chart, the indicator scans the open orders to attach lines for t
With the Market View Indicator , you may monitor in a dedicated panel as many as products as you wish. Just add the indicator to the chart, enter the prodcuts you want to view and the change period to track and that's it. A panel will open up at the bottom of the chart which will show you per product the change in pips, the standard deviation, the return etc.  Personally, I use it to track multiple products I have positions with without having multiple charts opened up, it save me bandwith and t
Breakeven calcualtor is a Metatrader 4 indicator which calculates and displays the breakeven value for the open P&L. The value is updated dynamically based on market movements and changes. If the overall P&L is negative, the breakeven point will be displayed as a red value, otherwise green. Besides the breakeven, the following values are also displayed: Pips sum P&L change per minute Pips change per minute P&L total Swap total Commisions total 2019 Roy Meshulam
Period trend indicator calculates and displays the changes in: Trend Pips Standard Deviation Return (%) in the following periods - M1, M5, M15, M30, H1, H4, W1, MN1, MN3, MN6, Y1 and Year to Date.  By default, the current product is used, but it can any product when you attached the indicator to the chart.  I used extensively to monitor the product changes accross multiple charts wihtout having the need to open them in paralle.  2019 Roy Meshulam
The Chart Overlay indicator displays the price action of different products on the same chart, allowing you to evaluate how different symbols fluctuate relative to each other. You may use it to make trading decisions based on convergence / divergence of the displayed products, i.e. USDCAD - XTIUSD, EURUSD - USDCHF etc.  Usage Find overbought or oversold products Adapts to chart size, zoom and timeframe Automatic price level calculation Customizable colors Click 'c' to open underline product in s
What Is the Coppock Curve? The Coppock Curve is a long-term price momentum indicator used primarily to recognize major downturns and upturns in a stock market index. It is calculated as a 10-period weighted moving average of the sum of the 14-period rate of change and the 11-period rate of change for the index. It is also known as the "Coppock Guide." Example of How to Use the Coppock Curve Apply the Coppock Curve to a weekly/monthly price chart of a stock index or stock index exchange traded f
Filtro:
Nessuna recensione
Rispondi alla recensione