Coppock Curve Indicator

What Is the Coppock Curve?

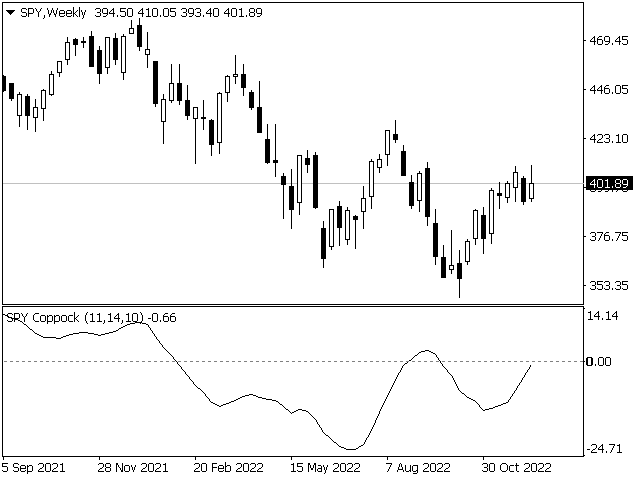
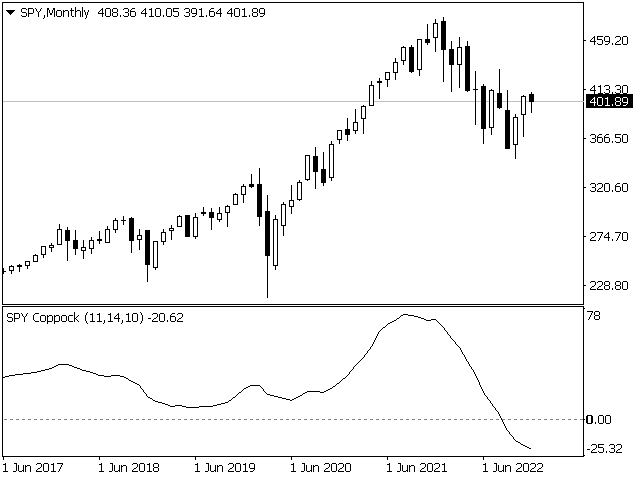
The Coppock Curve is a long-term price momentum indicator used primarily to recognize major downturns and upturns in a stock market index. It is calculated as a 10-period weighted moving average of the sum of the 14-period rate of change and the 11-period rate of change for the index. It is also known as the "Coppock Guide."


Example of How to Use the Coppock Curve

Apply the Coppock Curve to a weekly/monthly price chart of a stock index or stock index exchange traded fund. The general strategy is to buy when the Curve rises above the zero line and consider selling when the Curve falls below zero. For investors who already own the ETF, when the Coppock curve is above zero the indicator is signaling to hold onto the investment. 

The indicator kept investors out of a portion of the 2001 and 2008 stock market declines. However, in 2016, the indicator provided a sell signal near the market bottom and then gave a buy signal a short time after at a higher price.


The Difference Between the Coppock Curve and Rate of Relative Strength Index (RSI)

The relative strength index looks at how the current price compares to prior prices, though it is calculated differently than the rate of change (ROC) indicator used in the Coppock Curve calculation. Therefore, these indicators will provide different trade signals and information.


Limitations of the Coppock Curve

The major drawback of the Coppock Curve is the event of a false signal. False signals occur when the curve quickly moves above and below the zero line. This may cause traders to make purchases, but then the indicator says to sell them again, or vice versa.

Another drawback is curve fitting, a cognitive bias. The Coppock Curve is somewhat arbitrary in its default settings, and many traders adjust those settings to change the shape of the curve to better fit historical price data. Fitting the indicator to provide the best historical signals may not produce better future signals.

The indicator is also looking at 10-, 11-, and 14-month averages. The indicator will lag in flagging major market bottoms and tops.

Prodotti consigliati
By using of this indicator, you can easily set two alerts for each timeframe of each instrument. This is how it works: 1. Add the indicator to the chart. 2. Click on "New Alert" button.  3. Drag the drawn rectangle to your desired price. 4. Then click on "Add" button to active the alert. You can do the same for the second alert. Please: Keep in mind that for each rectangle only the side of the rectangle that is close to the price is important. For a different instrument, drag it from the market
Point61 Indicator
Evgeniy Machok
5 (1)
The Point61 indicator is the result of many years of monitoring of price behavior of currency pairs and metals. It is not a secret, that in times of uncertainty, traders are looking for possible levels of support and resistance - the point, where price should stop its movement. There are 2 possible scenarios at these points: 1. Reverse (correction) to the opposite direction; 2. Breakthrough to continue movement. Very often these points are used to set stop orders - TakeProfit or StopLoss
The Chart Overlay indicator displays the price action of different products on the same chart, allowing you to evaluate how different symbols fluctuate relative to each other. You may use it to make trading decisions based on convergence / divergence of the displayed products, i.e. USDCAD - XTIUSD, EURUSD - USDCHF etc.  Usage Find overbought or oversold products Adapts to chart size, zoom and timeframe Automatic price level calculation Customizable colors Click 'c' to open underline product in s
Introduction It is common practice for professional trades to hide their stop loss / take profit from their brokers. Either from keeping their strategy to the themselves or from the fear that their broker works against them. Using this indicator, the stop loss / take profit points will be drawn on the product chart using the bid price. So, you can see exactly when the price is hit and close it manually.  Usage Once attached to the chart, the indicator scans the open orders to attach lines for t
Trade with Gann on your side!! MASTER CIRCLE 360 CIRCLE CHART, originally created by Gann admitted that this is “The Mother of all charts”. It is one of the last studies that this great trader left for us. The numeric tab le is apparently quite simple like all the tables and is based on square numbers, the SQUARE OF 12 and is by evolution, one of the most important square numbers. Here we can find CYCLE, PRICE AND TIME thanks to angles and grades, to show past and future support and resistance.
Alpha Trend sign has been a very popular trading tool in our company for a long time. It can verify our trading system and clearly indicate trading signals, and the signals will not drift. Main functions: Based on the market display of active areas, indicators can be used to intuitively determine whether the current market trend belongs to a trend market or a volatile market. And enter the market according to the indicator arrows, with green arrows indicating buy and red arrows indicating se
TradePilot
Hossein Khalil Alishir
TradePilot Expert Advisor (EA) for MetaTrader 4 TradePilot is a professional and user-friendly Expert Advisor (EA) for MetaTrader 4 (MT4) . It simplifies automated trading , risk management , and trade execution using a smart trading panel . Perfect for beginners and experienced traders looking for a reliable trade manager EA with automated lot size calculation . Key Advantages User-Friendly Trading Panel: Customizable panel with buttons and hotkeys. Smart Risk Management: Supports percen
PatternMMB
Mikhail Bilan
The PatternMMB trading indicator finds the most common candlestick analysis patterns and provides trading recommendations based on them. The PatternMMB trading indicator is designed to search for candlestick patterns on the price chart and issue trading recommendations depending on the nature of the found candlestick pattern. It is also possible to send sound notifications when all or any of the selected patterns appear, with an explanation of the pattern and its interpretation. In addition, th
Trendiness Index
Libertas LLC
5 (3)
"The trend is your friend" is one of the best known sayings in investing, because capturing large trendy price movements can be extremely profitable. However, trading with the trend is often easier said than done, because many indicators are based on price reversals not trends. These aren't very effective at identifying trendy periods, or predicting whether trends will continue. We developed the Trendiness Index to help address this problem by indicating the strength and direction of price trend
Gann Square of 144
Taras Slobodyanik
5 (6)
The Gann Box (or Gann Square) is a market analysis method based on the "Mathematical formula for market predictions" article by W.D. Gann. This indicator can plot three models of Squares: 90, 52(104), 144. There are six variants of grids and two variants of arcs. You can plot multiple squares on one chart simultaneously Parameters Square — selection of a Gann square model: 90 — square of 90 (or square of nine); 52 (104) — square of 52 (or 104); 144 — universal square of 144; 144 (full) — "full
L'Indice di Forza Relativa(RSI) Scanner Multivaluta MT4 è uno strumento di trading innovativo progettato per i trader che desiderano monitorare efficacemente più coppie di valute contemporaneamente. Utilizzando il potente indicatore RSI, questo scanner fornisce una panoramica completa delle condizioni di mercato, aiutando i trader a identificare potenziali opportunità di trading su vari timeframe. Questo indicatore offre vantaggi significativi presentando segnali cruciali in un formato user-frie
Magic Moving Indicator
Mohammad Taher Halimi Tabrizi
This is a very powerful indicator which is very useful in trend detection the way is used is similar to moving average but giving very reliable results. principle is very easy, that depicts a mobile support and resistance line when the price is below the orange line the trend is bearish and the line act as resistance and as soon as the resistance is broken and price is above the line then the trend becomes bullish and the line changes into the support line. this can be used in any time frames. i
Dynamic Oscillator Pro - è un indicatore Crypto_Forex personalizzato avanzato - uno strumento di trading efficiente per MT4! - Nuova generazione di oscillatori - guarda le immagini per vedere come utilizzarlo. - L'oscillatore dinamico ha zone di ipervenduto/ipercomprato adattive. - L'oscillatore è uno strumento ausiliario per trovare punti di ingresso esatti dalle zone di ipervenduto/ipercomprato. - Valori di ipervenduto: sotto la linea verde, valori di ipercomprato: sopra la linea rossa. - È
Infinity Trend Pro
Yaroslav Varankin
1 (1)
This is a trend indicator without redrawing Developed instead of the binary options strategy (by the color of the Martingale candlestick) Also works well in forex trading When to open trades (binary options) A signal will appear in the place with a candle signaling the current candle It is recommended to open a deal for one candle of the current timeframe M1 and M5 When a blue dot appears, open a deal up When a red dot appears, open a trade down. How to open trades on Forex. When a signal is rec
This multicurrency indicator is the Lite version of the Cosmic Diviner Reversal Zone Pro indicator. The indicator is based on original formulas for analyzing the volatility and price movement strength. This allows determining the overbought and oversold states of instruments with great flexibility, as well as setting custom levels for opening buy or sell orders when the overbought or oversold values of the instruments reach a user-defined percentage. A huge advantage of Reversal Zone Lite is the
PZ Harmonacci Patterns
PZ TRADING SLU
3.17 (6)
Trade smarter, not harder: Empower your trading with Harmonacci Patterns This is arguably the most complete harmonic price formation auto-recognition indicator you can find for the MetaTrader Platform. It detects 19 different patterns, takes fibonacci projections as seriously as you do, displays the Potential Reversal Zone (PRZ) and finds suitable stop-loss and take-profit levels. [ Installation Guide | Update Guide | Troubleshooting | FAQ | All Products  ] It detects 19 different harmonic pric
The Th3Eng PipFinite indicator is based on a very excellent analysis of the right trend direction with perfect custom algorithms. It show the true direction and the best point to start trading. With StopLoss point and Three Take Profit points. Also it show the right pivot of the price and small points to order to replace the dynamic support and resistance channel, Which surrounds the price. And Finally it draws a very helpful Box on the left side on the chart includes (take profits and Stop loss
Price reach indicator. It also serves as the perfect term for supports and resistance. I use it in two experts. The basic tool for professional trading. The indicator analyzes the last 500 bar and uses this to determine the levels ( but it doesn't predict the future ) . Personally, I use it on TF H1.  It is very simple. Four lines on chart and that's all. Only two input parameters.  Thousands of indicators. Why this? Is good ? No! Is very good. Please test the indicator prior to purchasing.
Heiken Ashi Pro
Nguyen Hang Hai Ha
5 (1)
Heiken Ashi Pro is a more advanced version than the default Heiken Ashi version of Metatrader 4. Features: Automatic change width when zooming ON / OFF button to display candles or not Options for changing colors The Heikin-Ashi technique is used by technical traders to identify a given trend more easily. Because the Heikin-Ashi technique smooths price information over two periods, it makes trends, price patterns, and reversal points easier to spot. Candles on a traditional candlestick chart fre
Distinctive
Tatiana Savkevych
Distinctive is a forex trending arrow indicator for identifying potential entry points. I like it, first of all, because it has a simple mechanism of work, adaptation to all time periods and trading tactics. Created on the basis of a regression channel with filters. Plotting the Lawrence indicator signals on a price function chart using a mathematical approach. How it works - when the price breaks out in the overbought / oversold zone (channel levels), a buy or sell signal is generated. Everyt
POC Delta Order Blocks   is a rule-based order block and volume-delta indicator designed to help traders clearly understand   where real trading activity happened and how price reacts around those zones . Instead of drawing generic candle-based blocks, this indicator uses a   Point of Control (POC)   approach to identify the most actively traded price level between a swing high/low and a confirmed Break of Structure (BOS). The order block is then anchored to the   earliest valid candle that inte
Naturu MT4
Ivan Stefanov
“Naturu” è un indicatore manuale che utilizza la simmetria della natura come algoritmo. Conquista il mercato con una strategia semplice e saggezza nascosta! Quando carichi l’indicatore, vedrai due linee: Top e Bottom. Clicca una volta su una linea per attivarla. Per spostarla, basta cliccare sulla candela dove vuoi posizionarla. Definisci un punto alto e un punto basso, e l’indicatore calcola automaticamente: Una zona magenta che mostra dove gli interessi di tori e orsi sono più vicini, ossia l’
The indicator provides a superior alternative to price action analysis. It enables the identification of normalized patterns, which are then transformed into a graphical representation to forecast future steps within a time series. In the top-left corner, you'll find information regarding the expected prediction accuracy, determined through a complex MSQE calculation. You have the flexibility to adjust the time window, making it easy to validate the indicator's performance. Additionally, you can
Una delle sequenze numeriche è chiamata "Sequenza di incendi boschivi". È stata riconosciuta come una delle nuove sequenze più belle. La sua caratteristica principale è che questa sequenza evita andamenti lineari, anche quelli più brevi. È questa proprietà che ha costituito la base di questo indicatore. Quando si analizza una serie temporale finanziaria, questo indicatore cerca di rifiutare tutte le possibili opzioni di tendenza. E solo se fallisce, riconosce la presenza di una tendenza e dà il
Heiken Ashi candle chart is an improved version of The Japanese candle chart, which can effectively filter the market "noise" of the Japanese candle chart. It is favored by many traders for its simplicity and intuition. For trend traders, the HA candle chart is a magic tool. Unlike the traditional Japanese candle chart, Heikenashi does not reflect the opening price, high price, low price and closing price of the market. Instead, Heikenashi calculates the value of a single K line in the dominant
Trend Catcher for MT4 – Il Tuo Alleato Avanzato nel Trading di Precisione Trend Catcher for MT4 è un indicatore innovativo progettato per offrire ai trader strumenti avanzati per l’analisi dei mercati finanziari, combinando precisione, affidabilità e facilità d’uso. Basato su algoritmi sofisticati, questo indicatore interpreta i movimenti dei prezzi e la volatilità di mercato per generare segnali chiari e tempestivi, ideali per individuare l’inizio di un trend, possibili inversioni e momenti str
Indicatore Crypto_Forex "DeMarker FLAT Detector" - è un efficace strumento ausiliario per il trading! Nessuna rielaborazione. Ti offro di aggiornare i tuoi metodi di trading con questo fantastico indicatore per MT4. - L'indicatore mostra le aree di prezzo piatte sul grafico. Dispone del parametro "Sensibilità piatta", responsabile del rilevamento di zone piatte. - "DeMarker FLAT Detector" può essere utilizzato per confermare le entrate di Price Action o in combinazione con altri indicatori. -
Laguerre SuperTrend Clouds adds an Adaptive Laguerre averaging algorithm and alerts to the widely popular SuperTrend indicator. As the name suggests, Laguerre SuperTrend Clouds (LSC) is a trending indicator which works best in trendy (not choppy) markets. The SuperTrend is an extremely popular indicator for intraday and daily trading, and can be used on any timeframe. Incorporating Laguerre's equation to this can facilitate more robust trend detection and smoother filters. The LSC uses the impro
Market Overview MT4
Mehran Sepah Mansoor
5 (1)
Ottimizzate le vostre decisioni di trading con il nostro indicatore di forza e sentimento del mercato e non fate più trading controcorrente! Meticolosamente progettato per i trader seri che apprezzano informazioni accurate e tempestive, il nostro indicatore fornisce una visione a volo d'uccello delle 28 coppie principali in modo molto semplice. Questo strumento è in grado di classificare le coppie di valute in base alla popolarità, alla forza del trend rialzista o ribassista e alla percentuale
Trend Hunter
Andrey Tatarinov
4.75 (20)
Trend Hunter è un indicatore di tendenza per lavorare sul mercato Forex. Una caratteristica dell'indicatore è che segue con sicurezza la tendenza senza modificare il segnale se il prezzo perfora leggermente la linea di tendenza. L'indicatore non si ridisegna, il segnale per entrare nel mercato appare dopo la chiusura della barra. Trend Hunter è un indicatore equo. Passa il mouse sul segnale dell'indicatore per visualizzare il potenziale profitto del segnale. Per il trading con uno StopLoss br
Gli utenti di questo prodotto hanno anche acquistato
Neuro Poseidon MT4
Daria Rezueva
4.96 (24)
Neuro Poseidon is a new indicator by Daria Rezueva. It combines precise trading signals with adaptive TP/SL levels - creating best possible trades as a result! Message me and get  Neuro Poseidon Assistant  as a gift to automize your trading process! What makes it stand out? 1. Proven profitability on all assets and timeframes 2. Only confirmed BUY and SELL signals present on the chart 3. Adaptive TP & SL levels generated by the software for each trade 4. Easy to understand - suitable for all
M1 Sniper
Oleg Rodin
5 (23)
M1 SNIPER è un sistema di indicatori di trading facile da usare. Si tratta di un indicatore a freccia progettato per l'intervallo temporale M1. L'indicatore può essere utilizzato come sistema autonomo per lo scalping sull'intervallo temporale M1 e come parte del tuo sistema di trading esistente. Sebbene questo sistema di trading sia stato progettato specificamente per il trading sull'intervallo temporale M1, può comunque essere utilizzato anche con altri intervalli temporali. Inizialmente ho pro
Gann Made Easy
Oleg Rodin
4.84 (164)
Gann Made Easy è un sistema di trading Forex professionale e facile da usare che si basa sui migliori principi del trading utilizzando la teoria di mr. WD Gann. L'indicatore fornisce segnali ACQUISTA e VENDI accurati, inclusi i livelli di Stop Loss e Take Profit. Puoi fare trading anche in movimento utilizzando le notifiche PUSH. CONTATTAMI DOPO L'ACQUISTO PER RICEVERE GRATUITAMENTE LE ISTRUZIONI DI TRADING E OTTIMI INDICATORI EXTRA! Probabilmente hai già sentito parlare molte volte dei metodi d
Scalper Inside PRO
Alexey Minkov
4.74 (68)
Scalper Inside PRO Scalper Inside PRO is an intraday trend and scalping indicator for MetaTrader 4 that uses an exclusive algorithm to quickly detect market direction and key target levels. It automatically calculates entry, exit and multiple profit targets, and shows detailed performance statistics so you can see how different instruments and strategies performed. This helps you choose the most suitable trading instruments for the current market conditions. Additionally, you can easily integrat
PRO Renko System
Oleg Rodin
5 (30)
PRO Renko System è un sistema di trading altamente accurato appositamente progettato per il trading di grafici RENKO. Questo è un sistema universale che può essere applicato a vari strumenti di trading. Il sistema neutralizza efficacemente il cosiddetto rumore di mercato che consente di accedere a segnali di inversione accurati. L'indicatore è molto facile da usare e ha un solo parametro responsabile della generazione del segnale. Puoi facilmente adattare lo strumento a qualsiasi strumento di
Dynamic Forex28 Navigator
Bernhard Schweigert
4.43 (7)
Dynamic Forex28 Navigator - Lo strumento di trading Forex di nuova generazione. ATTUALMENTE SCONTATO DEL 49%. Dynamic Forex28 Navigator è l'evoluzione dei nostri indicatori popolari di lunga data, che combinano la potenza di tre in uno: Advanced Currency Strength28 Indicator (695 recensioni) + Advanced Currency IMPULSE con ALERT (520 recensioni) + CS28 Combo Signals (Bonus). Dettagli sull'indicatore https://www.mql5.com/en/blogs/post/758844 Cosa offre l'indicatore di forza di nuova generazione?
Trend Catcher ind
Ramil Minniakhmetov
INDICATORE TREND CATCHER L'indicatore Trend Catcher analizza i movimenti dei prezzi di mercato, utilizzando una combinazione di indicatori di analisi del trend proprietari dell'autore e personalizzati. Identifica la vera direzione del mercato filtrando il rumore a breve termine e concentrandosi sulla forza del momentum sottostante, sull'espansione della volatilità e sul comportamento della struttura dei prezzi. Utilizza inoltre una combinazione di indicatori personalizzati di smoothing e filtr
Trend Lines PRO
Roman Podpora
5 (1)
LINEE DI TENDENZA PRO       Aiuta a capire dove il mercato sta realmente cambiando direzione. L'indicatore mostra reali inversioni di tendenza e punti in cui i principali attori rientrano. Vedi  Linee BOS   Cambiamenti di tendenza e livelli chiave su timeframe più ampi, senza impostazioni complesse o rumore inutile. I segnali non vengono ridisegnati e rimangono sul grafico dopo la chiusura della barra. VERSIONE MT 5     -      Svela il suo massimo potenziale se abbinato all'indicatore   RFI LEVE
Enigmera
Ivan Stefanov
5 (8)
ENIGMERA: Il cuore del mercato Importante: La demo di MQL5.com funziona nel Strategy Tester e potrebbe non riflettere completamente le funzionalità di Enigmera. Consulta la descrizione, gli screenshot e il video per maggiori dettagli. Non esitare a inviarmi un messaggio se hai domande! Il codice dell'indicatore è stato completamente riscritto. La versione 3.0 aggiunge nuove funzionalità e corregge i bug accumulati dall'inizio dell'indicatore. Introduzione Questo indicatore e sistema di trading
KT Alpha Hunter Arrows MT4
KEENBASE SOFTWARE SOLUTIONS
La maggior parte degli indicatori a frecce ti dà un segnale e poi ti lascia capire da solo tutto il resto. KT Alpha Hunter Arrows ti offre un piano di trading completo. Ogni freccia di segnale viene visualizzata con un piano già tracciato: linea di ingresso, stop loss, quattro livelli di take profit e un verdetto edge in tempo reale che ti indica se quel simbolo e quel timeframe meritano di essere tradati in quel momento. Il pacchetto include un Trade Manager EA che gestisce l’esecuzione dopo il
Questo indicatore è un indicatore per l'analisi automatica delle onde perfetto per il trading pratico! Caso... Nota:   non sono abituato a usare nomi occidentali per la classificazione delle onde a causa dell'influenza della convenzione di denominazione di Tang Lun (Tang Zhong Shuo Zen), ho chiamato l'onda base come   penna   e la banda dell'onda secondaria come   segmento   At allo stesso tempo, il segmento ha la direzione del trend. La denominazione   è principalmente segmento di trend   (que
Genesis Matrix Pro is a professional multi-timeframe trend detection indicator designed to help traders identify high-quality market alignment with clarity and structure. It combines 12 different technical indicators into one visual alignment matrix, allowing traders to quickly see when market conditions are bullish, bearish, or neutral. A signal is generated only when the selected strategies are aligned, helping reduce noise and improve decision-making. PLEASE CONTACT ME AFTER PURCHASE TO GET
Questo prodotto è stato aggiornato per il mercato 2026 e ottimizzato per le ultime build di MT5. AVVISO DI AGGIORNAMENTO PREZZO: Smart Trend Trading System è attualmente disponibile a $99 . Il prezzo aumenterà a $199 dopo i prossimi 30 acquisti . OFFERTA SPECIALE: Dopo aver acquistato Smart Trend Trading System, inviami un messaggio privato per ricevere Smart Universal EA GRATIS e trasformare i tuoi segnali Smart Trend in operazioni automatiche. Smart Trend Trading System è un sistema di tradin
MTF Supply Demand Zones
Georgios Kalomoiropoulos
4.82 (22)
Nuova generazione di zone di domanda e offerta automatizzate. Algoritmo nuovo e innovativo che funziona su qualsiasi grafico. Tutte le zone vengono create dinamicamente in base all'azione dei prezzi del mercato. DUE TIPI DI AVVISI --> 1) QUANDO IL PREZZO RAGGIUNGE UNA ZONA 2) QUANDO SI FORMA UNA NUOVA ZONA Non ottieni un altro indicatore inutile. Ottieni una strategia di trading completa con risultati comprovati.     Nuove caratteristiche:     Avvisi quando il prezzo raggiunge la zona di
PZ Trend Trading
PZ TRADING SLU
4.8 (5)
Capture every opportunity: your go-to indicator for profitable trend trading Trend Trading is an indicator designed to profit as much as possible from trends taking place in the market, by timing pullbacks and breakouts. It finds trading opportunities by analyzing what the price is doing during established trends. [ Installation Guide | Update Guide | Troubleshooting | FAQ | All Products ] Trade financial markets with confidence and efficiency Profit from established trends without getting whips
Step into the world of Forex trading with confidence, clarity, and precision using   Gold Indicator   a next-generation tool engineered to take your trading performance to the next level. Whether you’re a seasoned professional or just beginning your journey in the currency markets, Gold Indicator equips you with powerful insights and help you trade smarter, not harder. Built on the proven synergy of three advanced indicators, Gold Indicator focuses exclusively on medium and long-term trends eli
MetaBands M4
Vahidreza Heidar Gholami
3.5 (6)
MetaBands uses powerful and unique algorithms to draw channels and detect trends so that it can provide traders with potential points for entering and exiting trades. It’s a channel indicator plus a powerful trend indicator. It includes different types of channels which can be merged to create new channels simply by using the input parameters. MetaBands uses all types of alerts to notify users about market events. Features Supports most of the channel algorithms Powerful trend detection algorith
Current event:  https://c.mql5.com/1/326/A2SR2025_NoMusic.gif R. Cos'è l'A2SR ?   * È un indicatore tecnico leader (nessuna riverniciatura, nessun ritardo). -- Guida : -- su https://www.mql5.com/en/blogs/post/734748/page4#comment_16532516 -- e https://www.mql5.com/en/users/yohana/blog A2SR ha una tecnica speciale per determinare i livelli di supporto (domanda) e resistenza (offerta). A differenza del modo ordinario che abbiamo visto in rete, A2SR ha un concetto originale nel determinare i li
Versione Swing M30/H1/H4 disponibile Vuoi catturare i grandi movimenti? Gold Signal Swing Pro (M30/H1/H4). Obiettivo: $20-$80+ per trade. https://www.mql5.com/en/market/product/177643 KURAMA GOLD SIGNAL PRO (MT4) — Sistema di Trading XAUUSD Completo con Filtro a 7 Strati, TP/SL Automatico e Punteggio di Qualità NESSUN REPAINT. NESSUN RIDISEGNO. NESSUN RITARDO. Ogni segnale è permanente. Ciò che vedi è ciò che ottieni. BONUS: Acquista la licenza a vit
BTMM State Engine Pro is a MetaTrader 4 indicator for traders who use the Beat The Market Maker approach: Asian session context, kill zone timing, level progression, peak formation detection, and a multi-pair scanner from a single chart. It combines cycle state logic with a built-in scanner dashboard so you do not need the same tool on many charts at once. What it does Draws the Asian session range; session times can follow broker server offset or be set in inputs. Tracks level progression (L
Advanced Supply Demand
Bernhard Schweigert
4.91 (300)
Speciale Trading- SCONTO DEL 40% La soluzione migliore per qualsiasi trader principiante o esperto! Questo indicatore è uno strumento di trading unico, di alta qualità e conveniente, perché abbiamo incorporato una serie di funzionalità proprietarie e una nuova formula. Con questo aggiornamento, potrai visualizzare doppie zone di timeframe. Non solo potrai visualizzare un TF più alto, ma anche entrambi, il TF del grafico e il TF più alto: MOSTRA ZONE ANNIDATE. Tutti i trader che operano con Of
Neo Wave PRO
Nikolay Raykov
Price & Time Market Structure Indicator A professional market structure tool that analyzes waves through both price and time — not price alone. Main Description NeoWave PRO is a professional market structure indicator for MetaTrader 4 designed for traders who want to move beyond traditional one-dimensional wave tools such as ZigZag, swing indicators, and basic high/low systems. Most wave indicators analyze only one thing: Price. But a real market wave is not only a price movement. A true wave de
RFI levels PRO
Roman Podpora
5 (1)
L'indicatore mostra accuratamente i punti di inversione e le zone di ritorno dei prezzi in cui il       Principali attori   . Vedi dove si formano le nuove tendenze e prendi decisioni con la massima precisione, mantenendo il controllo su ogni operazione. VERSION MT5     -     Rivela il suo massimo potenziale se combinato con l'indicatore   TREND LINES PRO Cosa mostra l'indicatore: Strutture di inversione e livelli di inversione con attivazione all'inizio di un nuovo trend. Visualizzazione dei l
Quant Direction
Georgios Kalomoiropoulos
Quant Direction è uno strumento di analisi di mercato 3D. Offre un'analisi di mercato perfettamente oggettiva, basata su algoritmi, calcolando con precisione le deviazioni percentuali su diversi parametri. Sviluppato utilizzando strumenti di modellazione avanzati basati sull'intelligenza artificiale e rigorosamente testato, questo algoritmo analizza il mercato con una precisione senza pari. È possibile analizzare qualsiasi coppia di valute o strumento finanziario sulla piattaforma. Che si pratic
MonsterDash Harmonic Indicator is a harmonic pattern dashboard. It recognizes all major patterns. MonsterDash is a dashboard that displays all detected patterns for all symbols and (almost) all timeframes in sortable and scrollable format. Users can add their own user defined patterns . MonsterDash can open and update charts with the pattern found. Settings MonsterDash's default settings are good enough most of the time. Feel free to fine tune them to your needs. The color settings are for thos
Apollo SR Master è un indicatore di Supporto/Resistenza con caratteristiche speciali che rendono il trading con le zone di Supporto/Resistenza più semplice e affidabile. L'indicatore calcola le zone di Supporto/Resistenza in tempo reale senza alcun ritardo, rilevando i massimi e i minimi dei prezzi locali. Quindi, per confermare la nuova area SR formata, l'indicatore mostra un segnale speciale che segnala che la zona SR può essere presa in considerazione e utilizzata come un vero e proprio segna
ATTUALMENTE SCONTATO DEL 40% La soluzione migliore per ogni principiante o trader esperto! Questo indicatore è uno strumento di trading unico, di alta qualità e conveniente perché abbiamo incorporato una serie di caratteristiche proprietarie e una nuova formula. Con un solo grafico è possibile leggere la forza delle valute per 28 coppie Forex! Immaginate come migliorerà il vostro trading perché sarete in grado di individuare l'esatto punto di innesco di una nuova tendenza o di un'opportunità
Auto Optimized Parabolic RSI: Motore di Momentum 3D Avanzato La maggior parte degli indicatori per trader privati fallisce perché si affida a parametri statici che smettono di funzionare nel momento in cui la volatilità del mercato cambia. Auto Optimized Parabolic RSI risolve il problema dell'"obsolescenza dell'indicatore" ricalcolando continuamente il proprio vantaggio matematico, portando un adattamento quantitativo di livello istituzionale direttamente sul tuo terminale MT5. Il Vantaggio Prin
PZ 123 Pattern
PZ TRADING SLU
1 (1)
Unlock powerful breakout opportunities The 123 Pattern is one of the most popular, powerful and flexible chart patterns. The pattern is made up of three price points: a bottom, a peak or valley, and a Fibonacci retracement between 38.2% and 71.8%. A pattern is considered valid when the price breaks beyond the last peak or valley, moment at which the indicator plots an arrow, rises an alert, and the trade can be placed. [ Installation Guide | Update Guide | Troubleshooting | FAQ | All Products  ]
Market Makers
Mohamed Hassan
5 (4)
After purchase, contact me privately to receive 1 month of free testing with EA Forex Proton! This advanced MT4 trading robot automatically executes signals from any MT4 indicator, including Market Makers. The latest version also includes AI integration, allowing each trade signal to be analyzed using Artificial Intelligence. Live Signal with EA Forex Proton: Click here Market Makers is a powerful price action trading system designed to identify high-probability Buy and Sell opportunities based
Altri dall’autore
Introduction Professional traders use pivot points as support/resistance levels or as an indicator of a trend. Basically, a pivot point are areas at which the direction of price movement can  possibly  change. What makes pivot points so popular is their objectivity as they are recalculated each time the price moves further. The pivot points indicator implements 5 popular pivot points calculation and drawing: Standard –  The most basic and popular type of the pivots, each point serve as an indica
Description The Hurst exponent is referred to as the “index of dependence” or “index of long-range dependence”. It quantifies the relative tendency of a time series either to regress strongly to the mean or to cluster in a direction. A value H in the range 0.5–1 indicates a time series with long-term positive autocorrelation, meaning both that a high value in the series will probably be followed by another high value and that the values a long time into the future will also tend to be high. A va
Introduction It is common practice for professional trades to hide their stop loss / take profit from their brokers. Either from keeping their strategy to the themselves or from the fear that their broker works against them. Using this indicator, the stop loss / take profit points will be drawn on the product chart using the bid price. So, you can see exactly when the price is hit and close it manually.  Usage Once attached to the chart, the indicator scans the open orders to attach lines for t
With the Market View Indicator , you may monitor in a dedicated panel as many as products as you wish. Just add the indicator to the chart, enter the prodcuts you want to view and the change period to track and that's it. A panel will open up at the bottom of the chart which will show you per product the change in pips, the standard deviation, the return etc.  Personally, I use it to track multiple products I have positions with without having multiple charts opened up, it save me bandwith and t
Breakeven calcualtor is a Metatrader 4 indicator which calculates and displays the breakeven value for the open P&L. The value is updated dynamically based on market movements and changes. If the overall P&L is negative, the breakeven point will be displayed as a red value, otherwise green. Besides the breakeven, the following values are also displayed: Pips sum P&L change per minute Pips change per minute P&L total Swap total Commisions total 2019 Roy Meshulam
Period trend indicator calculates and displays the changes in: Trend Pips Standard Deviation Return (%) in the following periods - M1, M5, M15, M30, H1, H4, W1, MN1, MN3, MN6, Y1 and Year to Date.  By default, the current product is used, but it can any product when you attached the indicator to the chart.  I used extensively to monitor the product changes accross multiple charts wihtout having the need to open them in paralle.  2019 Roy Meshulam
In  finance , volatility (symbol σ) is the degree of variation of a trading price series over time as measured by the  standard deviation  of  logarithmic returns . Historic volatility measures a time series of past market prices.  Implied volatility  looks forward in time, being derived from the market price of a market-traded derivative (in particular, an option). In 2000 Yang-Zhang created a volatility measure that handles both opening jumps and drift. It is the sum of the overnight volatilit
The Chart Overlay indicator displays the price action of different products on the same chart, allowing you to evaluate how different symbols fluctuate relative to each other. You may use it to make trading decisions based on convergence / divergence of the displayed products, i.e. USDCAD - XTIUSD, EURUSD - USDCHF etc.  Usage Find overbought or oversold products Adapts to chart size, zoom and timeframe Automatic price level calculation Customizable colors Click 'c' to open underline product in s
Filtro:
Nessuna recensione
Rispondi alla recensione