RSIBSSignals
- Indicatori
-
Shi Yuan Wang
 Sviluppo indicatori personalizzati, Expert Advisor (EA), script e strumenti di trading per MetaTrader 4 e MetaTrader 5, nonché indicatori per TradingView (Pine Script).
Cosa posso fare per te: - Versione: 2.1
RSI Support Resistance Signals
Platform: MetaTrader 5
RSI Support Resistance Signals adds zone coloring and signal labels to the standard RSI. The indicator does not execute trades.
Signals:
-
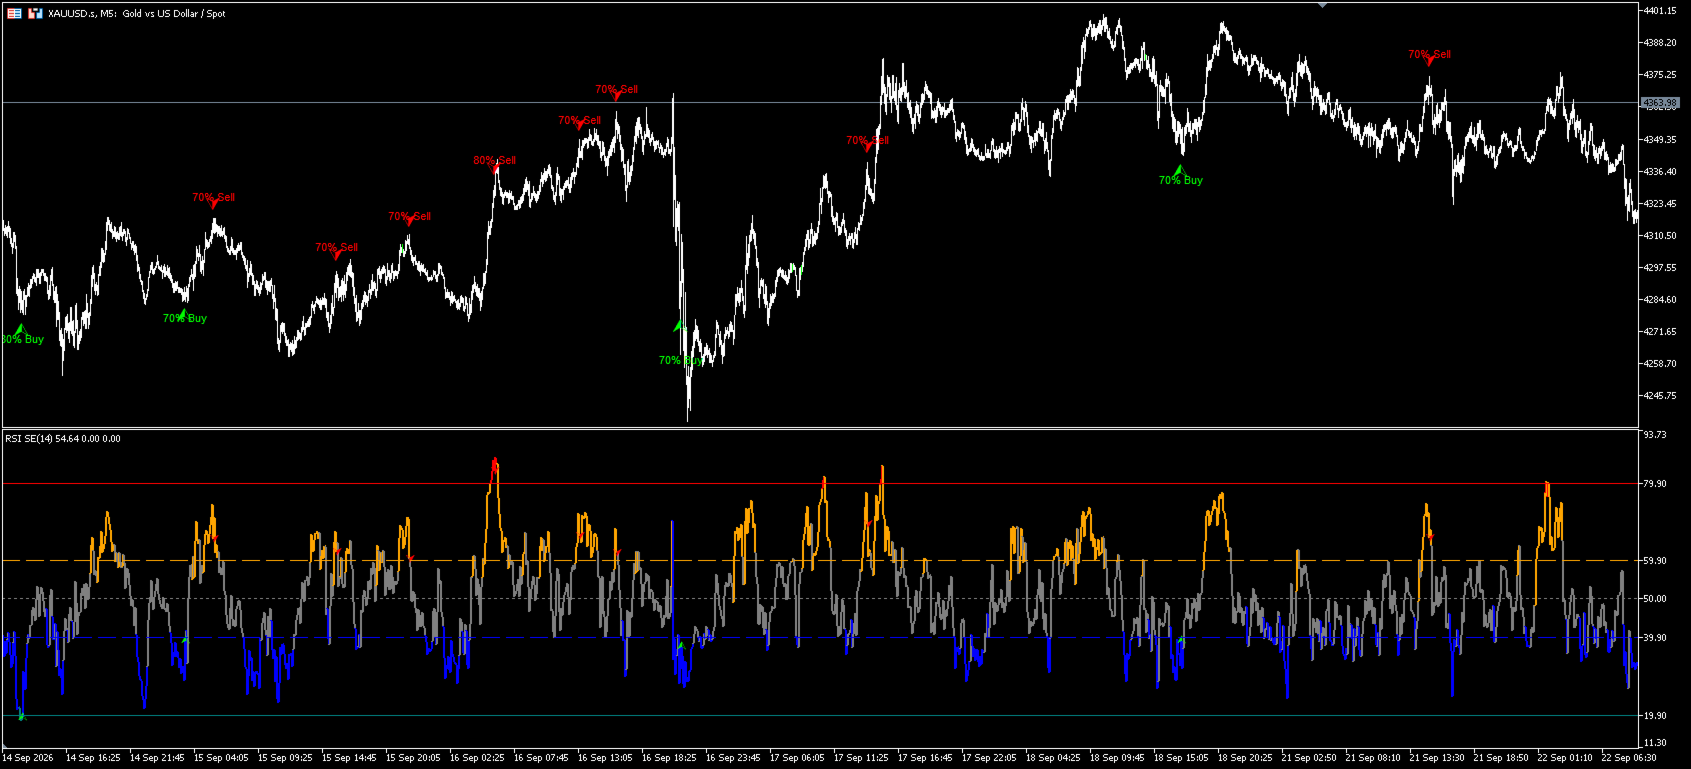
Sell: RSI is in the overbought zone and turns down, or RSI is in the resistance zone and a bearish candle with an upper wick is detected.
-
Buy: RSI is in the oversold zone and turns up, or RSI is in the support zone and a bullish candle with a lower wick is detected.
Each signal can show a user-defined English text label, such as Overbought, Oversold, Resistance, or Support. The label is a visual category only.
Filters:
Optional filters include candle close confirmation, RSI turn confirmation, wick rejection, strong body, minimum ATR as percentage of price, minimum bars between same-type signals, and zone de-duplication. Each filter can be enabled or disabled.
Chart and alerts:
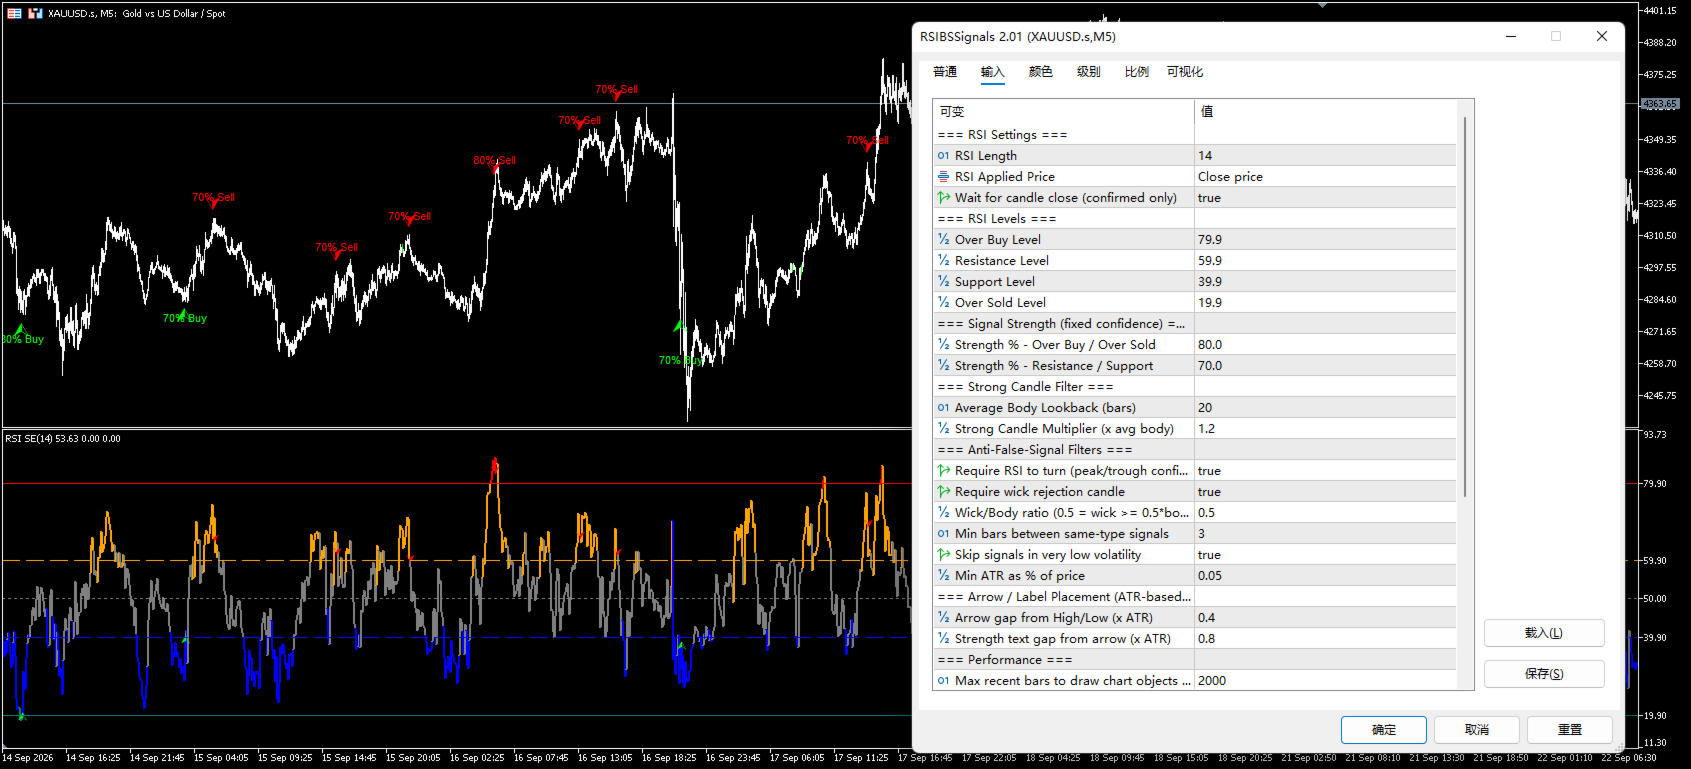
In the subwindow, the RSI line changes color by zone and five horizontal levels are drawn. On the price chart, sell arrows and text are plotted above bars, and buy arrows and text are plotted below bars. Arrow and text distance is based on ATR. Objects are created only for the selected recent bars and are removed automatically. Objects are not created during backtesting or optimization.
Popup and push notifications are supported. Alerts are triggered only on the latest two bars. Historical signals are not sent when the indicator is loaded. The same signal type on the same bar is alerted once.
Inputs:
RSI Length 14; RSI Applied Price Close; Wait for candle close true.
Overbought Level 79.90; Resistance Level 59.90; Support Level 39.90; Oversold Level 19.90.
Average Body Lookback 20; Strong Candle Multiplier 1.2.
Require RSI to turn true; Require wick rejection candle true; Wick/Body ratio 0.5; Min bars between same-type signals 3.
Skip signals in very low volatility true; Min ATR as % of price 0.05.
Arrow gap from High/Low 0.40; Label text gap from arrow 0.80; Max recent bars to draw objects 2000.
Popup alert on signal false; Push notification on signal false.
Colors are user-defined.
Buy and sell signals are written to indicator buffers for Expert Advisors via iCustom. Bars without a signal contain empty values.
Usage:
This indicator is a technical analysis tool. It identifies RSI and price patterns by a defined algorithm and displays signals. It does not provide investment advice and does not guarantee trading results. Use it with independent analysis, key price levels, and risk management.