SweepReversalMap
- Indicatori
-
Shi Yuan Wang
 Sviluppo indicatori personalizzati, Expert Advisor (EA), script e strumenti di trading per MetaTrader 4 e MetaTrader 5, nonché indicatori per TradingView (Pine Script).
Cosa posso fare per te: - Versione: 1.1
- Attivazioni: 5
SweepReversalMap — Indicatore di mappatura delle zone di inversione dopo sweep di liquidità
Panoramica
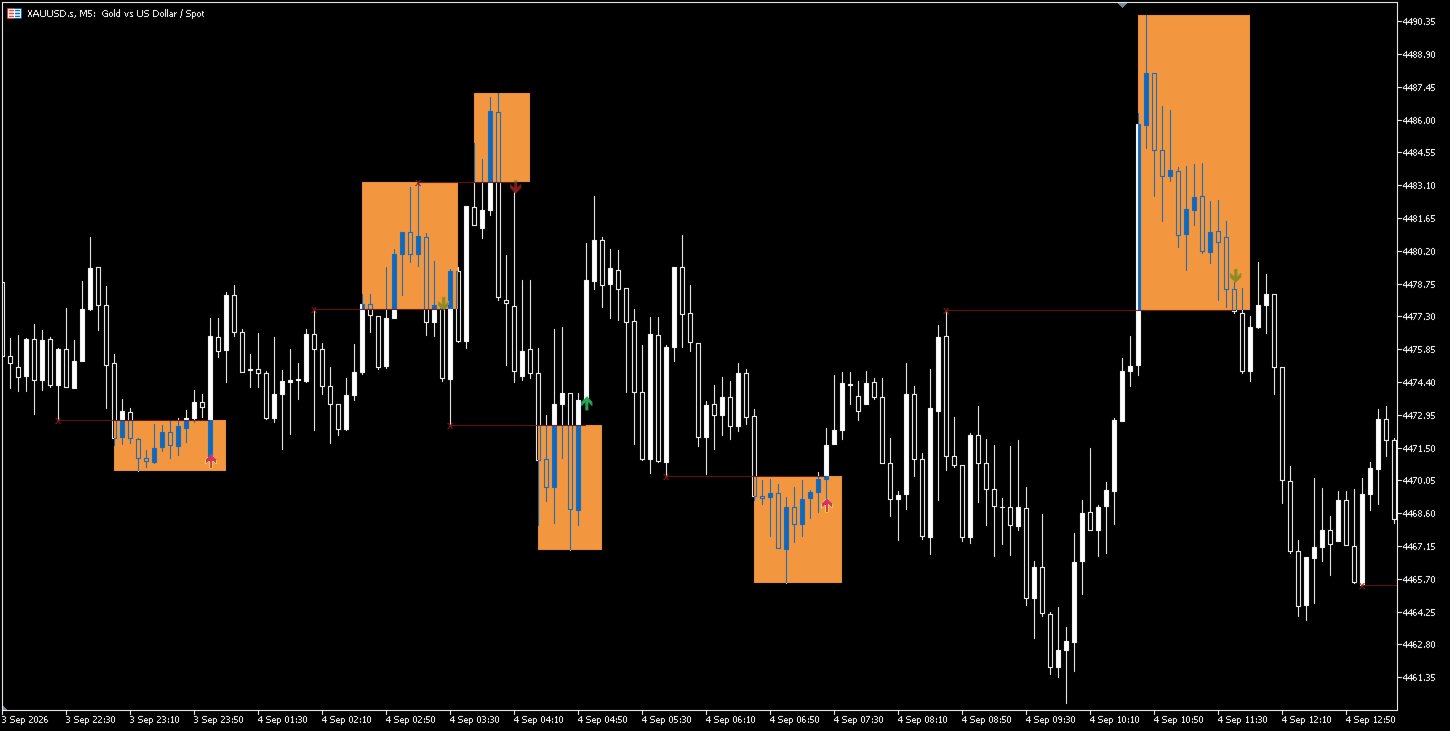
SweepReversalMap è un indicatore personalizzato basato sul Price Action, progettato per identificare eventi di «Liquidity Sweep» (sweep di liquidità) nel mercato e mappare potenziali zone di inversione dopo il reclaim del prezzo. L’indicatore è adatto a qualsiasi strumento e timeframe.
Logica principale
-
Rilevamento dei punti swing: in base allo Swing Length impostato dall’utente, vengono identificati gli swing high / swing low validi più recenti.
-
Determinazione dello sweep: quando il prezzo perfora al rialzo uno swing high (o al ribasso uno swing low) e raggiunge la soglia minima di penetrazione filtrata dall’ATR, viene avviato un pattern di inversione candidato.
-
Conferma del reclaim: quando la chiusura torna all’interno del livello dello sweep, viene considerato reclaim.
-
Conferma della rottura strutturale: la chiusura rompe inoltre il minimo/massimo strutturale locale, e il corpo della candela raggiunge lo spostamento minimo filtrato dall’ATR; il segnale viene confermato.
-
Regola di invalidazione: se non viene confermato entro il numero massimo di barre di conferma, il pattern candidato viene rimosso automaticamente.
Funzioni principali
-
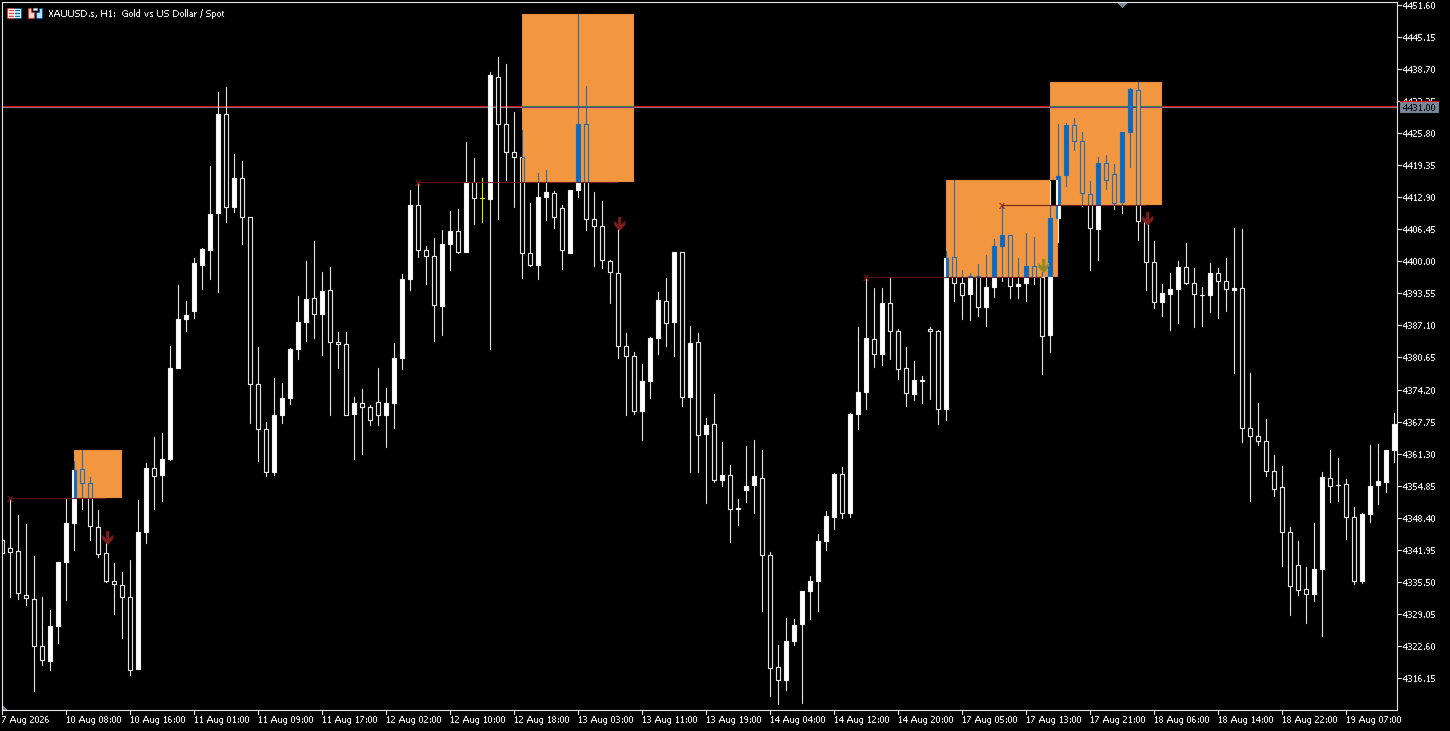
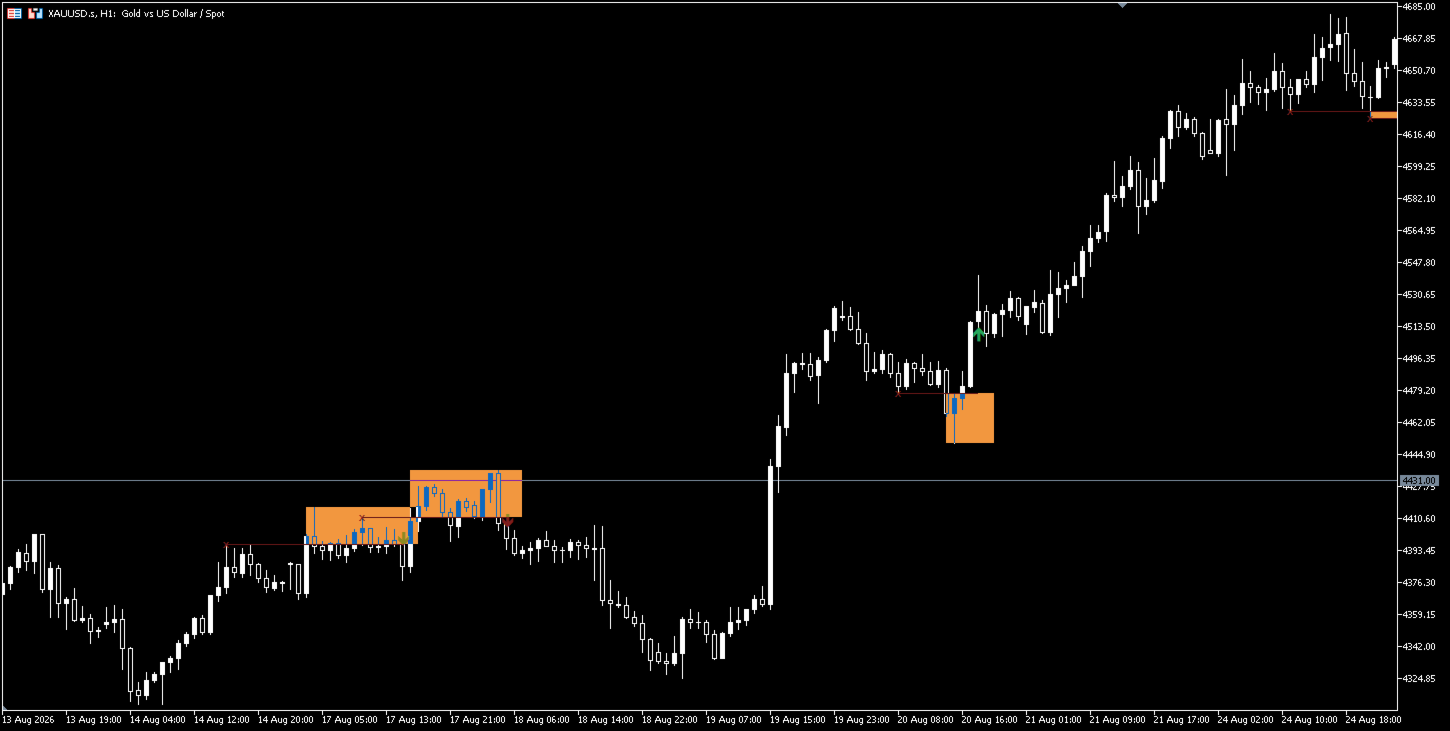
Disegna sul grafico un rettangolo di zona di inversione (Reversal Zone), colore configurabile.
-
Contrassegna i livelli swing oggetto di sweep con una linea (tratteggiata → continua).
-
Segna con «×» i punti swing in cui è avvenuto lo sweep.
-
Consente di mostrare pattern «in sviluppo» (semitrasparenti) o solo quelli confermati.
-
Avviso opzionale (Alert), attivato una sola volta dopo la chiusura della barra del segnale.
-
Fornisce 3 buffer numerici nascosti (Bearish / Bullish / Any Signal), leggibili da EA esterni tramite iCustom.
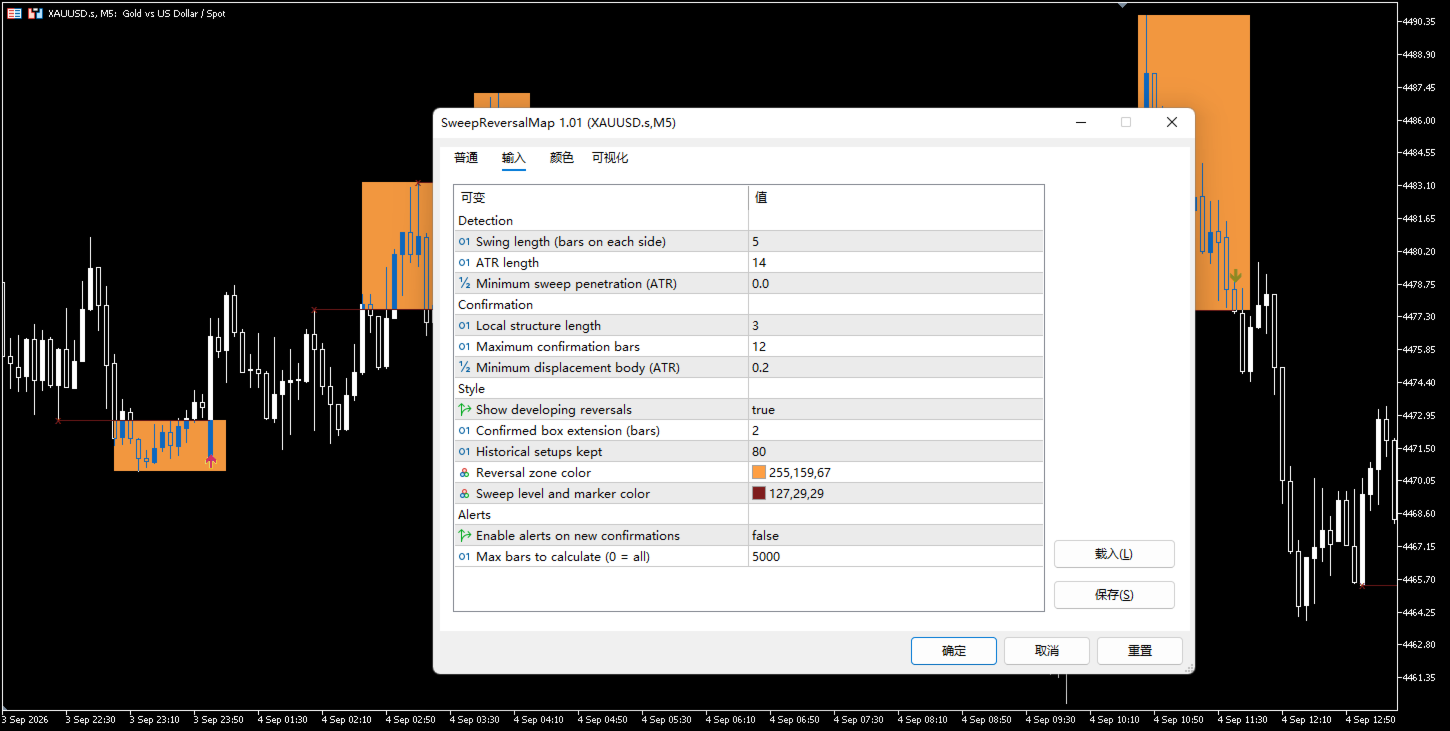
Parametri di input
| Parametro | Descrizione | Predefinito |
|---|---|---|
| Swing Length | Numero di barre a sinistra/destra dello swing | 5 |
| ATR Length | Periodo ATR | 14 |
| Min Penetration | Penetrazione minima dello sweep (multiplo ATR) | 0.0 |
| Structure Length | Lunghezza della struttura locale | 3 |
| Max Confirm Bars | Numero massimo di barre di conferma | 12 |
| Min Displacement | Spostamento minimo del corpo (multiplo ATR) | 0.2 |
| Show Developing | Mostra pattern in sviluppo | true |
| Box Extension | Estensione del box a destra dopo conferma, barre | 2 |
| Max History | Numero di pattern storici conservati | 80 |
| Zone Color | Colore della zona di inversione | Arancione |
| Level Color | Colore di linee / marcatori | Rosso scuro |
| Alerts | Abilita avvisi | false |
| Max History Bars | Numero massimo di barre calcolate (0=tutte) | 5000 |
Istruzioni per l’uso
Questo indicatore è uno strumento di analisi, non costituisce consulenza di trading e non garantisce profitti.
Si consiglia di utilizzarlo insieme ad altri metodi di analisi e strategie di gestione del rischio.
Gli oggetti creati dall’indicatore sul grafico vengono eliminati automaticamente quando l’indicatore viene rimosso.
V: wy911449
Dopo oltre 100 download, passerà a un servizio in abbonamento.