Dailytrendstrength
- Indicatori
-
Shi Yuan Wang
 Sviluppo indicatori personalizzati, Expert Advisor (EA), script e strumenti di trading per MetaTrader 4 e MetaTrader 5, nonché indicatori per TradingView (Pine Script).
Cosa posso fare per te: - Versione: 1.0
Intraday Spark Chart
Overview
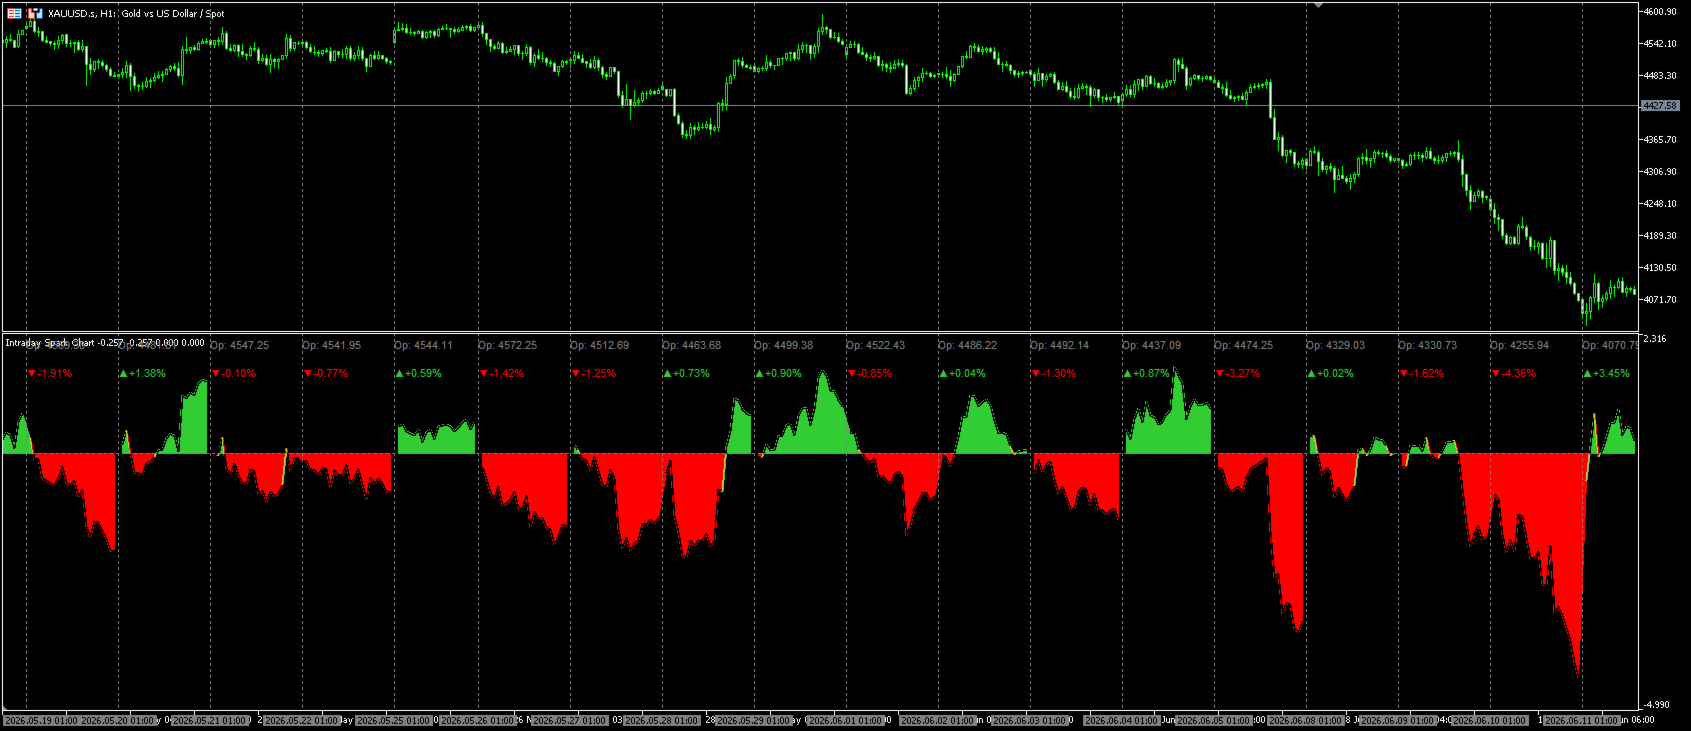
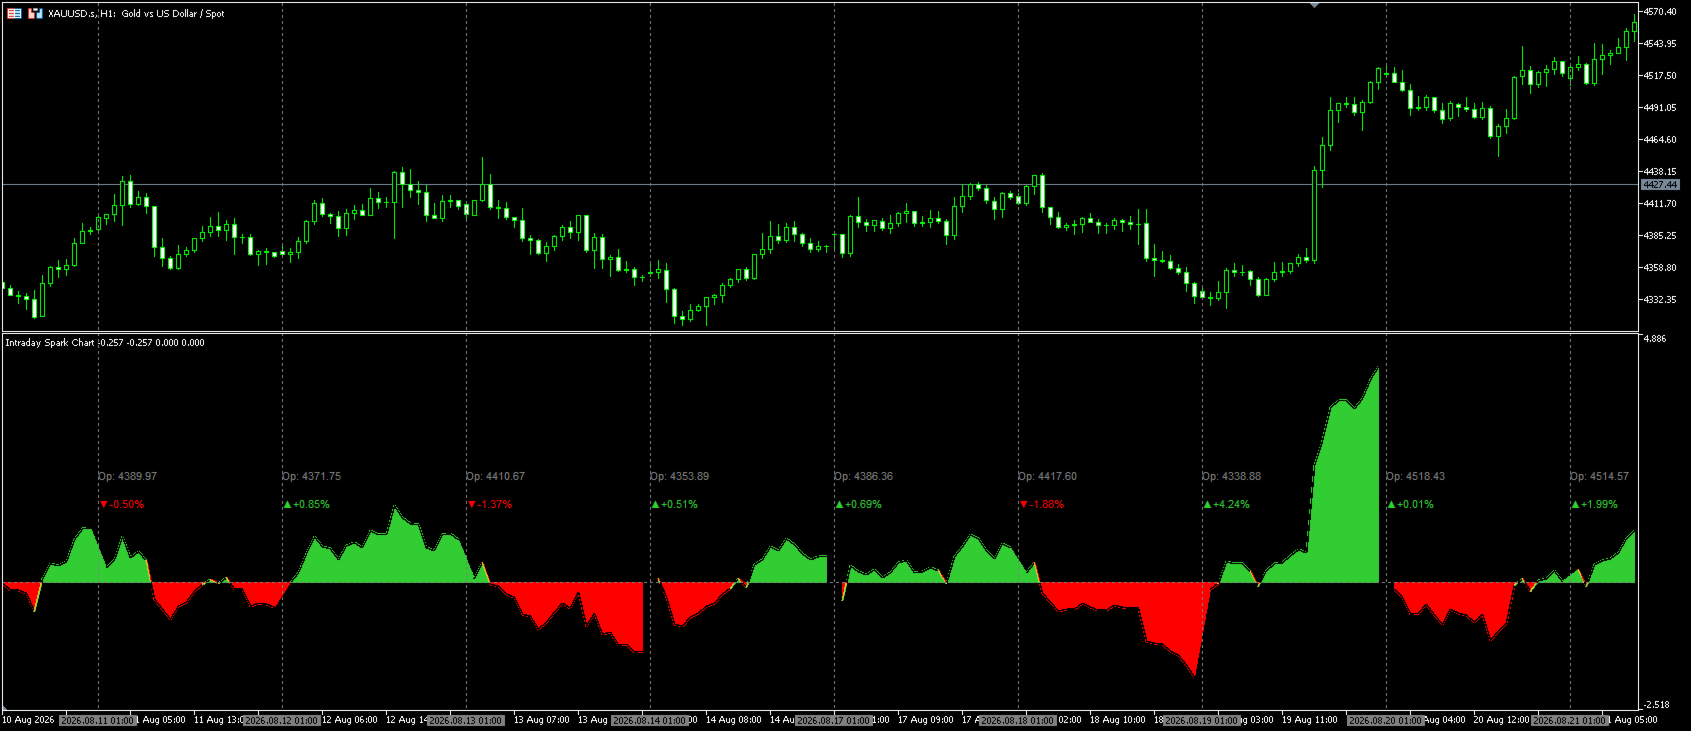
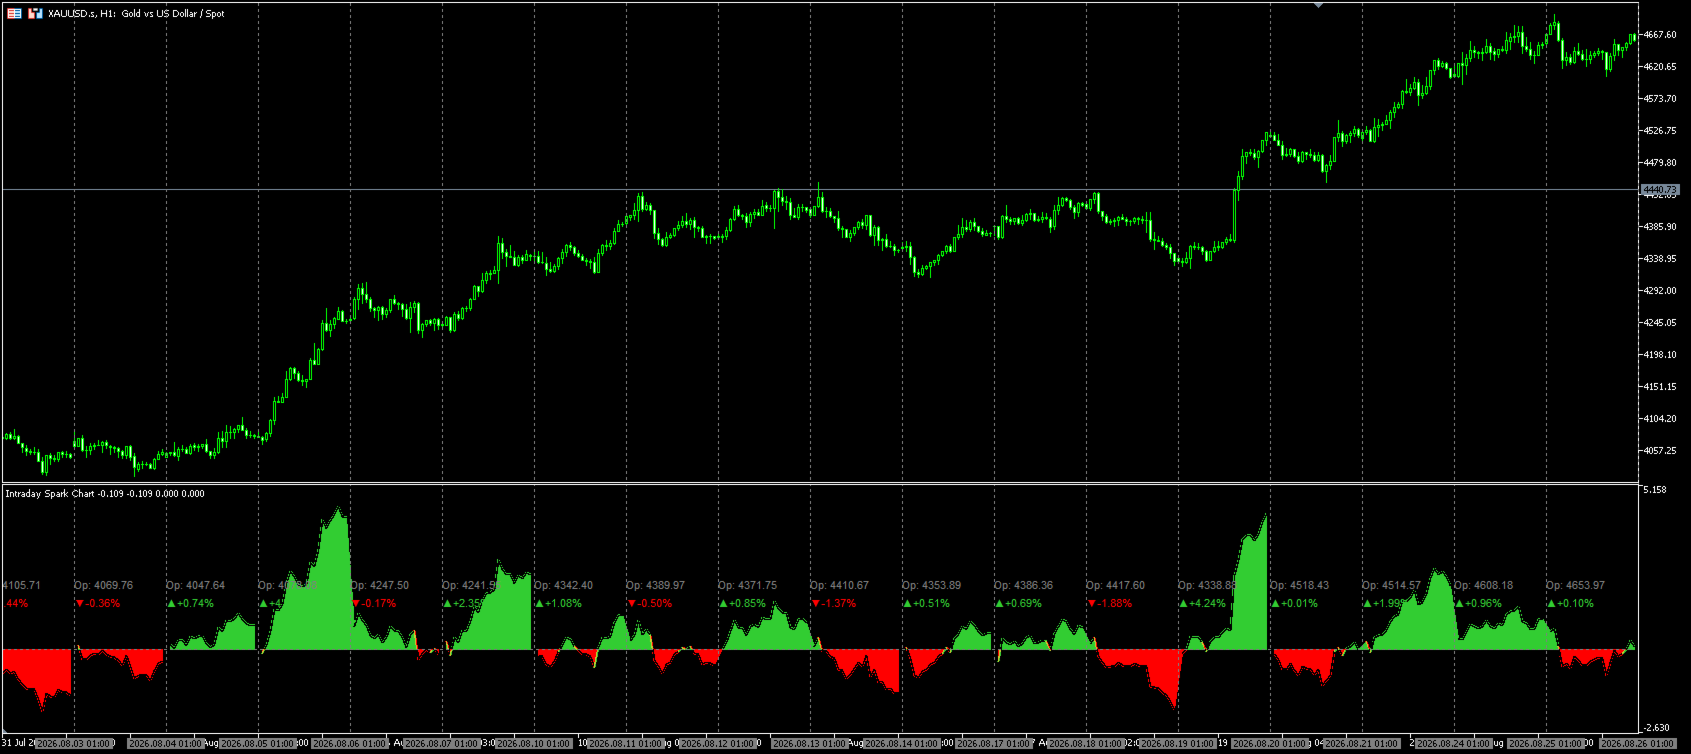
Intraday Spark Chart is an MT5 indicator for intraday analysis. It converts the current price change of a symbol into a percentage of the daily opening price and plots the result in a separate subwindow. Every trading day starts again from the zero line, so each day is drawn as a separate segment and the intraday move of the current day can be observed directly.
The indicator is a data visualization tool. It does not generate trading signals and does not provide investment advice.
What the indicator shows
Every point of the line is calculated as follows: the close price of the intraday bar minus the daily opening price, divided by the daily opening price, expressed as a percentage. The daily opening price is taken from the daily timeframe of the selected symbol.
The following elements are drawn on the chart:
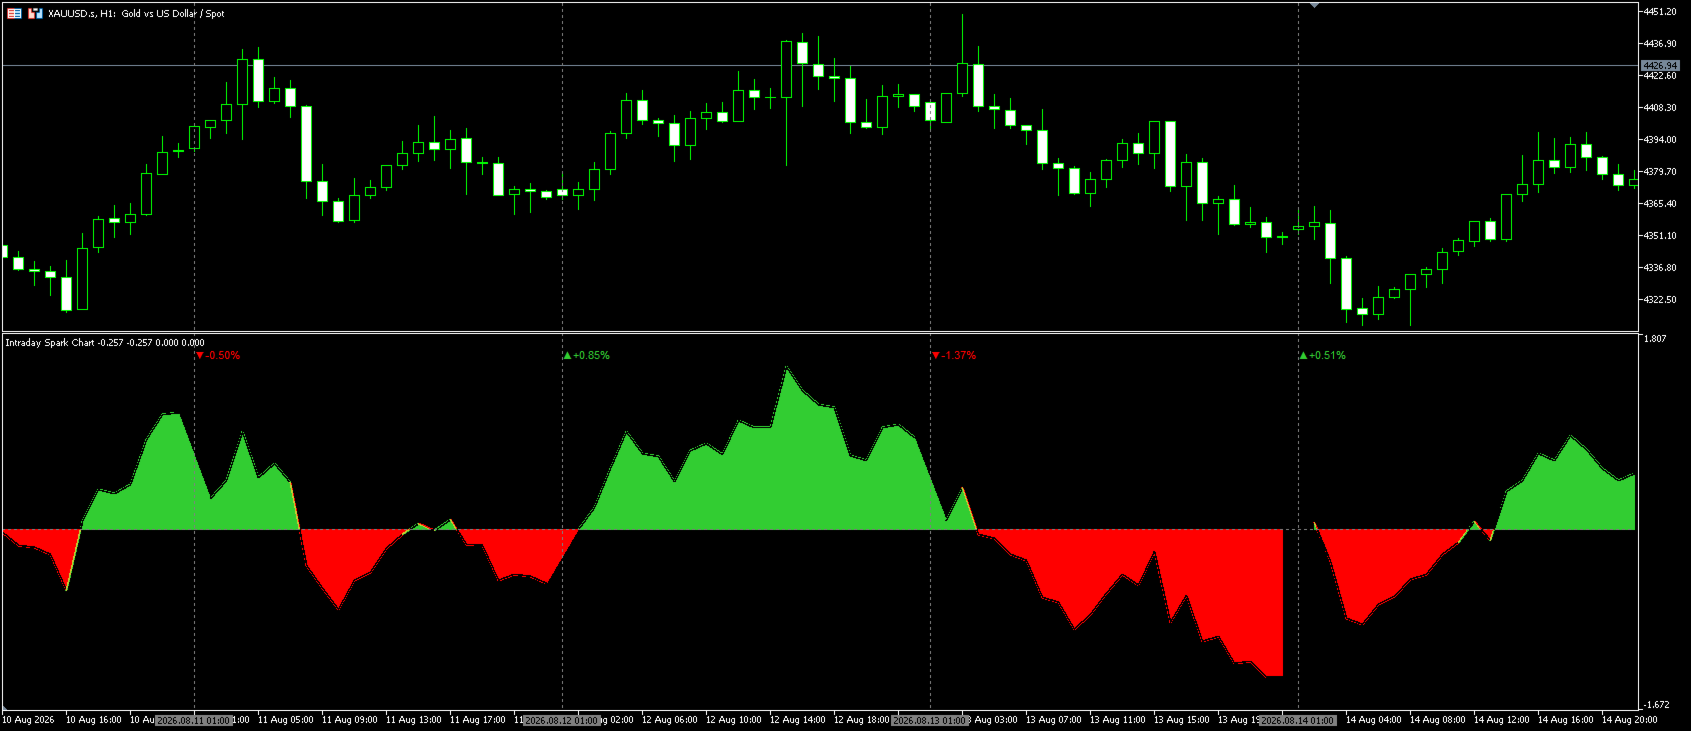
- Percent change line. It is drawn in the positive color when the price is above the daily open and in the negative color when the price is below the daily open.
- Area fill. The area between the zero line and the change line is filled using the same color rule as the line.
- Zero line. A dotted line that represents the level of the daily opening price.
- Day separator. A dotted vertical line drawn at the beginning of each trading day to separate one day from another.
- Daily open label. A text label near the upper part of the subwindow showing the opening price of the day.
- Daily change label. A text label with a direction marker and the running percentage change of the current day. It is updated on every tick and keeps the final value of the previous day once a new day begins.
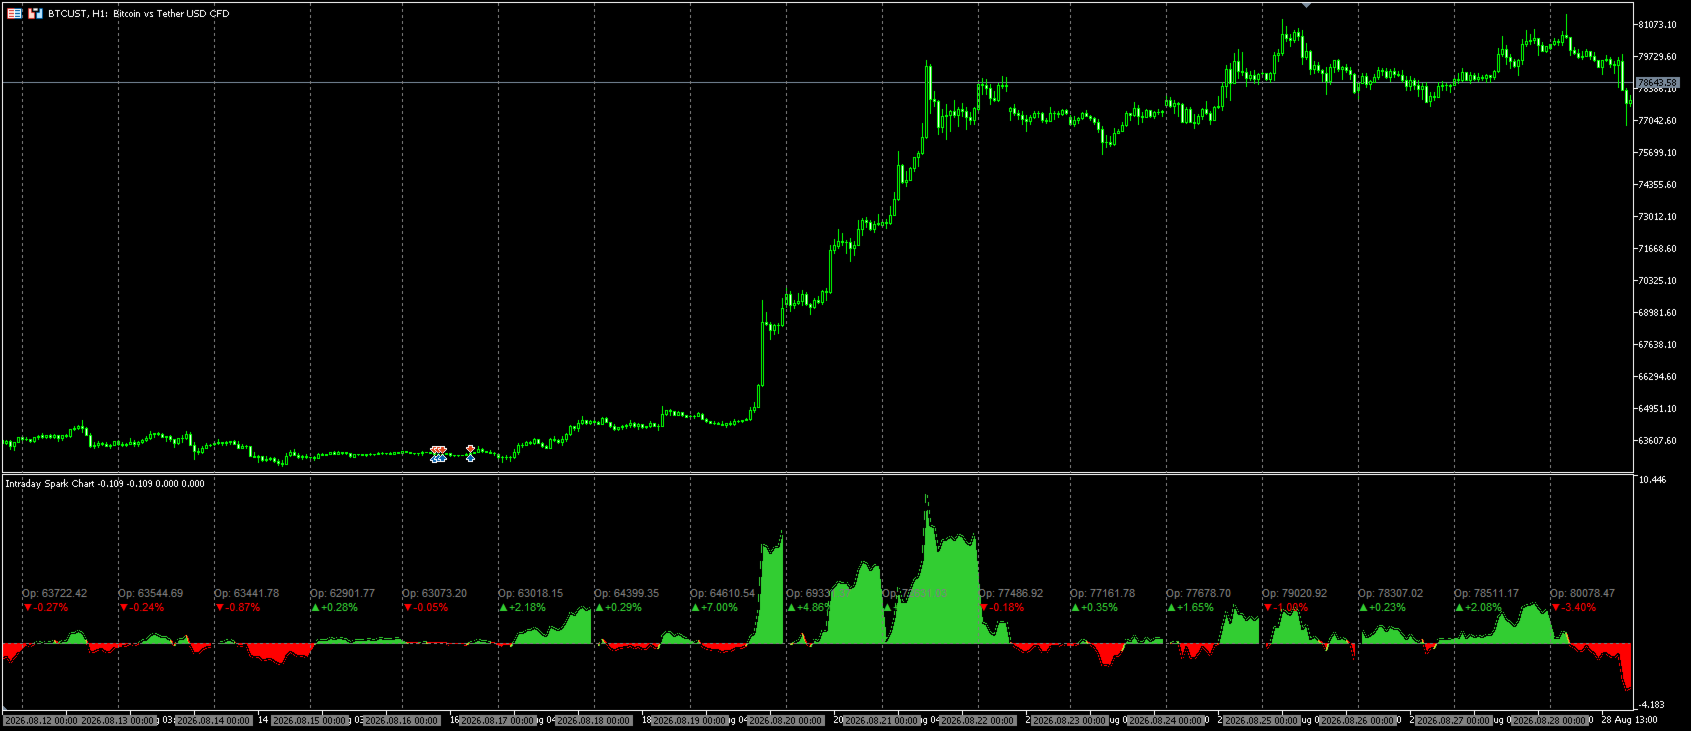
- Ticker label. Shown in the corner of the subwindow when the Asset parameter is set to a symbol other than the chart symbol.
How to read the chart
- A line above the zero line means the current price is higher than the daily open. A line below the zero line means the current price is lower than the daily open.
- The further the line is from the zero line, the larger the deviation from the daily opening price.
- The vertical scale of the subwindow is sized from the average daily range of the symbol over the last 500 daily bars. The height of the line can therefore be compared with the typical daily movement of that symbol, which helps to tell a quiet day from an unusually active one.
- The day separators cut the line into segments, one segment per trading day, so the intraday path of previous days can be reviewed as well.
Typical use cases
- Direction of the current day. Combined with the daily trend or the previous day high and low, the line shows whether the day is developing in one direction or moving sideways.
- Strength of the current day. Comparing the current percentage with the usual daily range of the symbol shows whether the day is unusually volatile.
- Multi symbol comparison. The indicator can be attached to the same chart several times with a different Asset value for each instance, which puts the intraday strength of several symbols side by side.
- Session observation. On timeframes such as M5 or M15, the progress of the price during a session or around a news release is easy to follow.
Input parameters
Parameter | Default | Description |
|---|---|---|
Asset | empty | Symbol to be analyzed. When left empty, the current chart symbol is used. Another symbol name such as EURUSD can be entered instead. |
Positive color | clrLimeGreen | Color of the line and the filled area when the price is above the daily open. |
Negative color | clrRed | Color of the line and the filled area when the price is below the daily open. |
Neutral color | clrGray | Color of the zero line, day separators, daily open labels and the ticker label. |
How to use
- Attach the indicator to any chart. It is displayed in a separate subwindow.
- By default, the current chart symbol is analyzed. Enter a symbol name in the Asset parameter to analyze another symbol.
- Adjust the three colors to personal preference. The color settings apply to the line, the filled area and the labels at the same time.
- The indicator works on timeframes from 1 minute to 4 hours. On higher timeframes the subwindow stays empty and a message suggests switching to a lower timeframe.
Limitations
- Daily history of the selected symbol is required. The line remains empty when daily data is not available.
- The daily opening price is taken from the daily bars on the broker server. Server time zone and daily bar settings differ between brokers, so the position of the day boundary and the value of the daily open vary accordingly.
- Values are based on the close price of each intraday bar, therefore the line shows the values of closed bars.
- Vertical lines and text labels are created by the indicator. They are removed when the indicator is removed or when a full recalculation is triggered.
- This is a visualization and analysis tool. It does not generate trading signals and does not provide investment advice.