MAValuationFluctuations
- Indicatori
-
Shi Yuan Wang
 Sviluppo indicatori personalizzati, Expert Advisor (EA), script e strumenti di trading per MetaTrader 4 e MetaTrader 5, nonché indicatori per TradingView (Pine Script).
Cosa posso fare per te: - Versione: 1.0
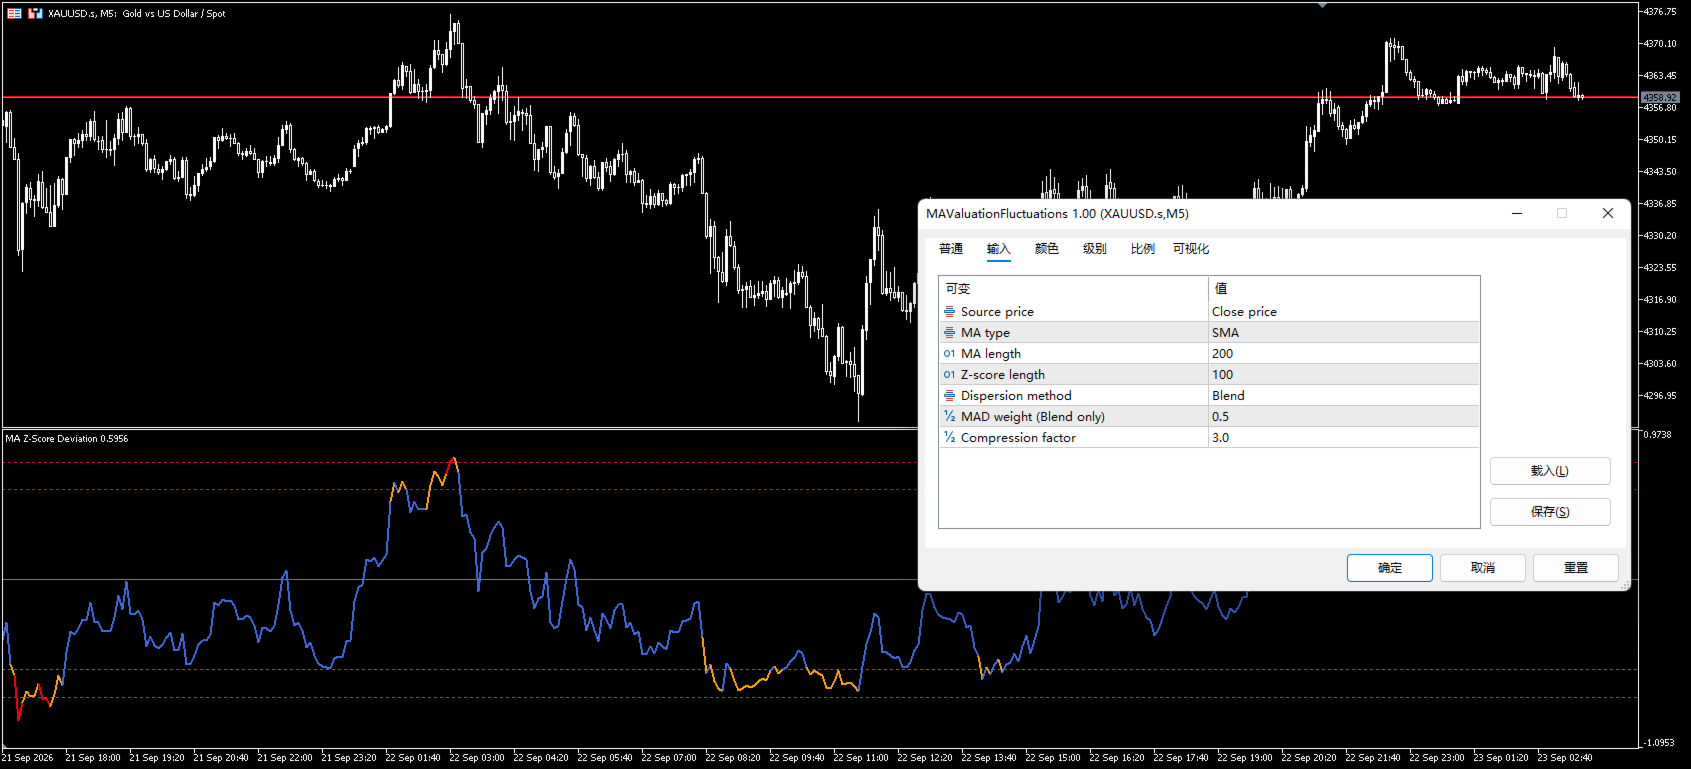
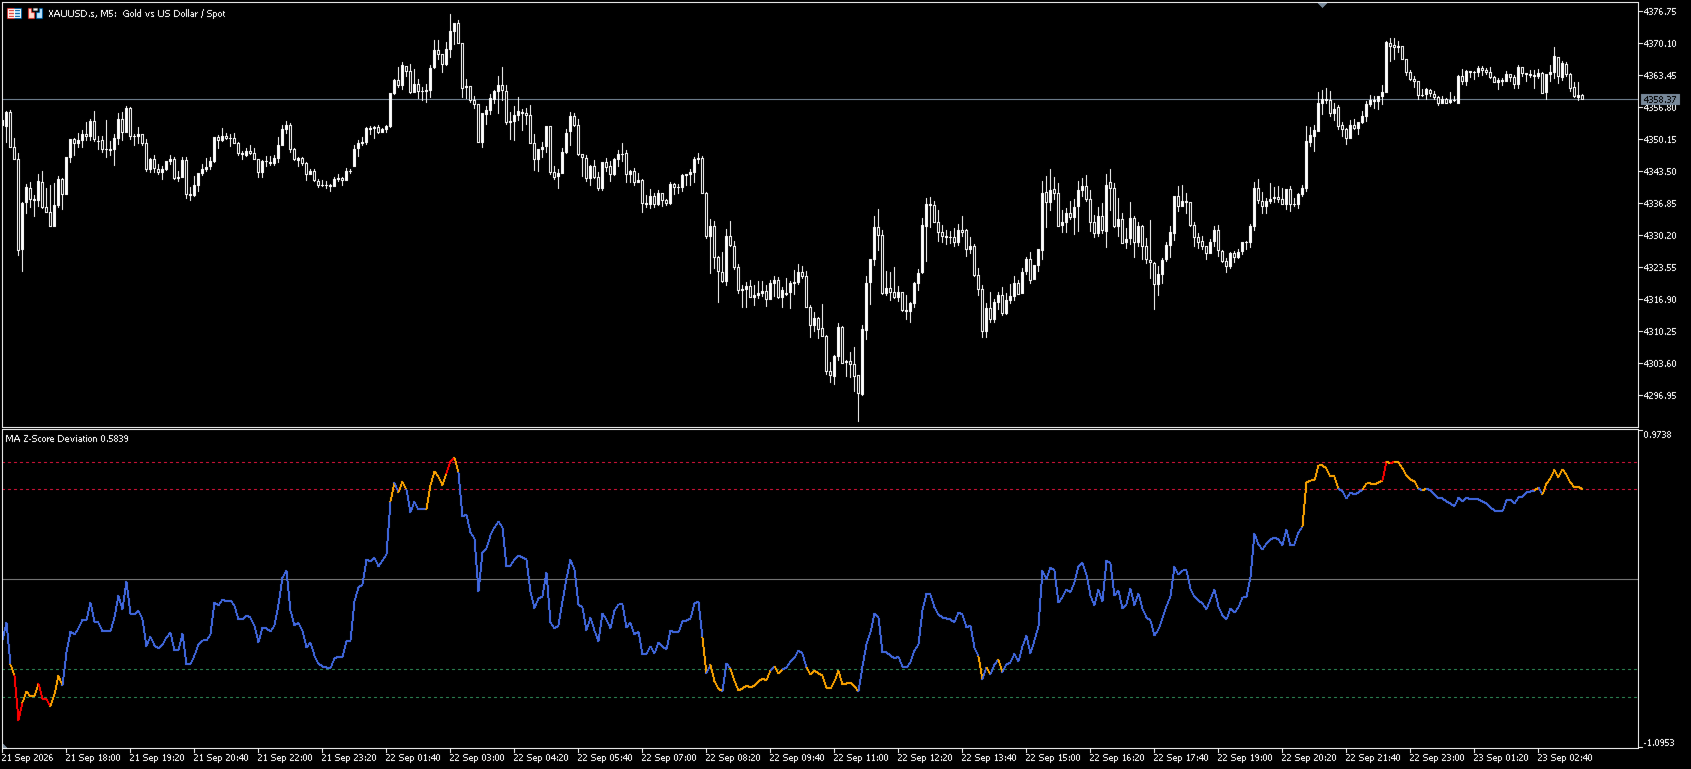
MA Valuation Fluctuations measures how far the current price stands from its moving average. The deviation is expressed in units of dispersion and then compressed by a hyperbolic tangent into a fixed range from -1.0 to +1.0. The indicator is drawn in a separate window and can be used as a context filter next to a trend following or a mean reversion approach.
What the indicator shows
For every bar the indicator compares the selected price with a moving average in logarithmic terms. Because the ratio is used instead of the difference, the reading stays comparable between symbols with different price scales and over long periods of history. The result is normalized by the dispersion of the same deviation window, so the line shows how unusual the current distance from the average is compared with its recent behaviour.
How the value is calculated
- A moving average (SMA, EMA or linear weighted WMA) is built from the selected source price.
- The logarithmic deviation log(price / MA) is calculated for every bar.
- Over the Z-score window the indicator takes the standard deviation, the median absolute deviation scaled by 1.4826, or a weighted blend of both.
- The raw Z-score is the deviation of the current bar divided by that dispersion.
- The plotted value is tanh(raw Z-score / compression factor). The displayed line therefore stays inside the range from -1.0 to +1.0, while the raw Z-score keeps growing and defines the colour.
Reading the plot
The line is blue while the raw Z-score stays between -2 and +2. It turns orange between 2 and 3 dispersion units from the mean, and red beyond 3 units. The horizontal lines mark the zero mean and the levels that correspond to raw readings of 2 and 3, and the shaded bands highlight the same areas. Because the display is compressed, the colour shows the true magnitude while the height shows the bounded value.
Input parameters
- Source price - the price used both for the moving average and for the deviation.
- MA type - SMA, EMA or linear weighted WMA.
- MA period - the length of the moving average.
- Z-score period - the length of the window used for the dispersion estimate.
- Dispersion method - standard deviation, median absolute deviation, or a blend of both.
- MAD weight (blend only) - weight of the median absolute deviation inside the blend, from 0.0 to 1.0.
- Compression factor - denominator inside the tanh function. Smaller values compress the line more strongly, larger values make the line flatter.
Usage notes
- A positive reading means that the price trades above its moving average, a negative reading means that it trades below.
- Readings above 2 or below -2 are relatively rare for the selected window and are drawn in orange; readings beyond 3 are drawn in red.
- The indicator describes the distance between price and average. It does not open or close trades and does not generate orders by itself.
- The default periods (200 and 100) are a starting point only. Shorter periods react faster and produce more frequent extreme readings, longer periods produce a smoother line.
- Median absolute deviation is less sensitive to single outliers than standard deviation. The blend mode offers a compromise between stability and responsiveness.
- The indicator works on any symbol and timeframe. It needs at least MA period + Z-score period + 2 bars of history.