Dashboard X
- Utilità
-
Looi Kah Fung
 I'm an independent algorithmic trading systems developer specializing in MetaTrader 5 Expert Advisor design, based in Malaysia. Under the A1 brand, I build institutional-style automated trading systems from the ground up — strategy logic, risk management, licensing infrastructure, and dashboard
 - Versione: 2.10
Dashboard X — Multi-EA Portfolio Observability Monitor
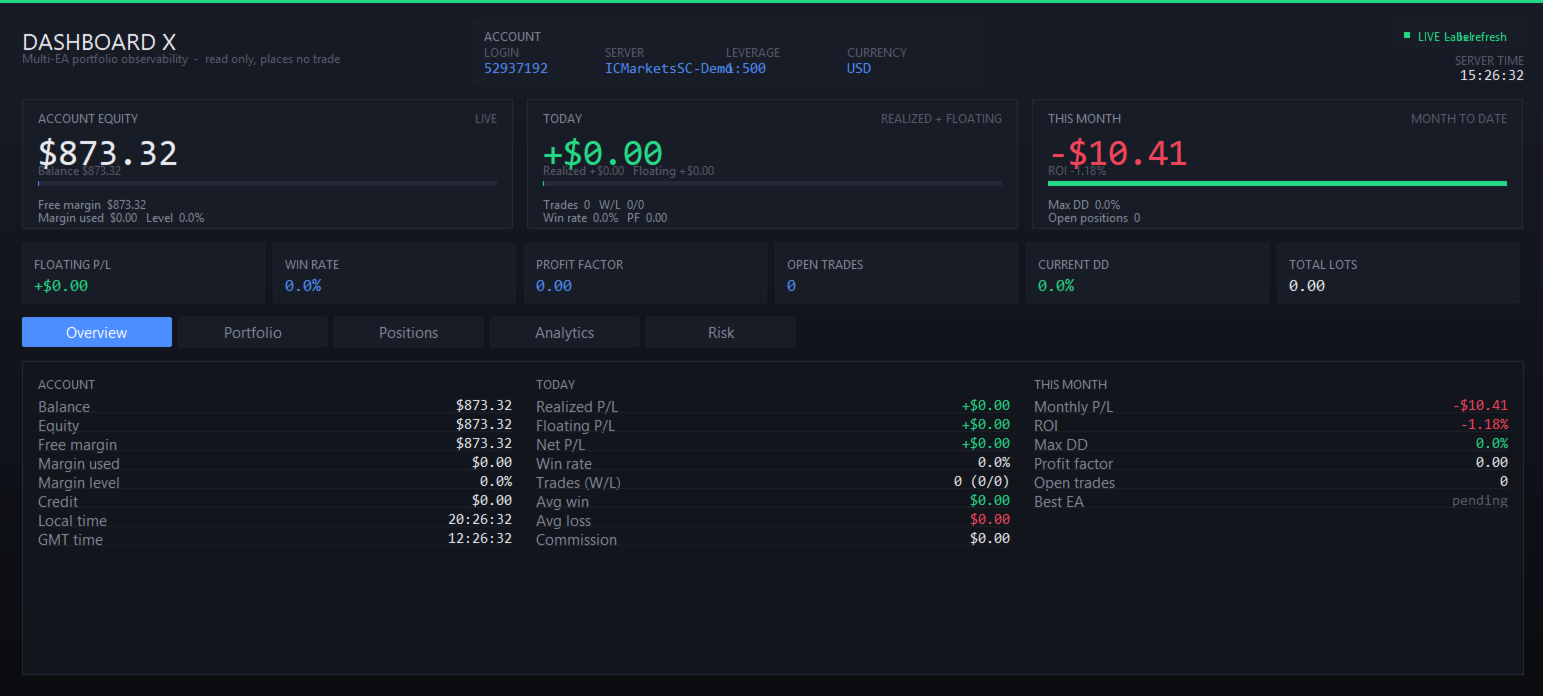
Running several EAs on one account and tired of alt-tabbing between charts to know where you actually stand? Dashboard X turns any chart into a full-screen account command center — real-time balance, equity, today's and monthly P/L, open positions, drawdown, and risk exposure, all in one adaptive view.
This is a monitor, not a trading robot. Dashboard X places no orders, modifies no positions, and closes nothing. It only reads your account state and closed-deal history and draws. Zero OrderSend , zero PositionModify — verified, not just claimed. Safe to run on the same terminal as your live trading EAs; it does no per-tick work at all, so it adds zero latency to anything that actually trades.
Full-screen by design. Unlike a small corner panel, Dashboard X takes over the chart entirely — hides the candles, grid and price scale — and rebuilds itself live as you resize the window, from a compact laptop screen up to a multi-monitor wall. One click restores your normal chart if you remove it.
What you get today:
- Hero metrics — Equity, Today's P/L, and Month-to-date P/L in large type, each with a live progress indicator (margin utilization, win rate, portfolio health)
- Overview tab — full account breakdown (balance, free margin, margin level, leverage) plus today's realized/floating P/L, win rate, trade count, average win/loss, and this month's ROI and max drawdown
- Positions tab — every open position across every EA and symbol on the account, with live P/L, SL/TP, and duration
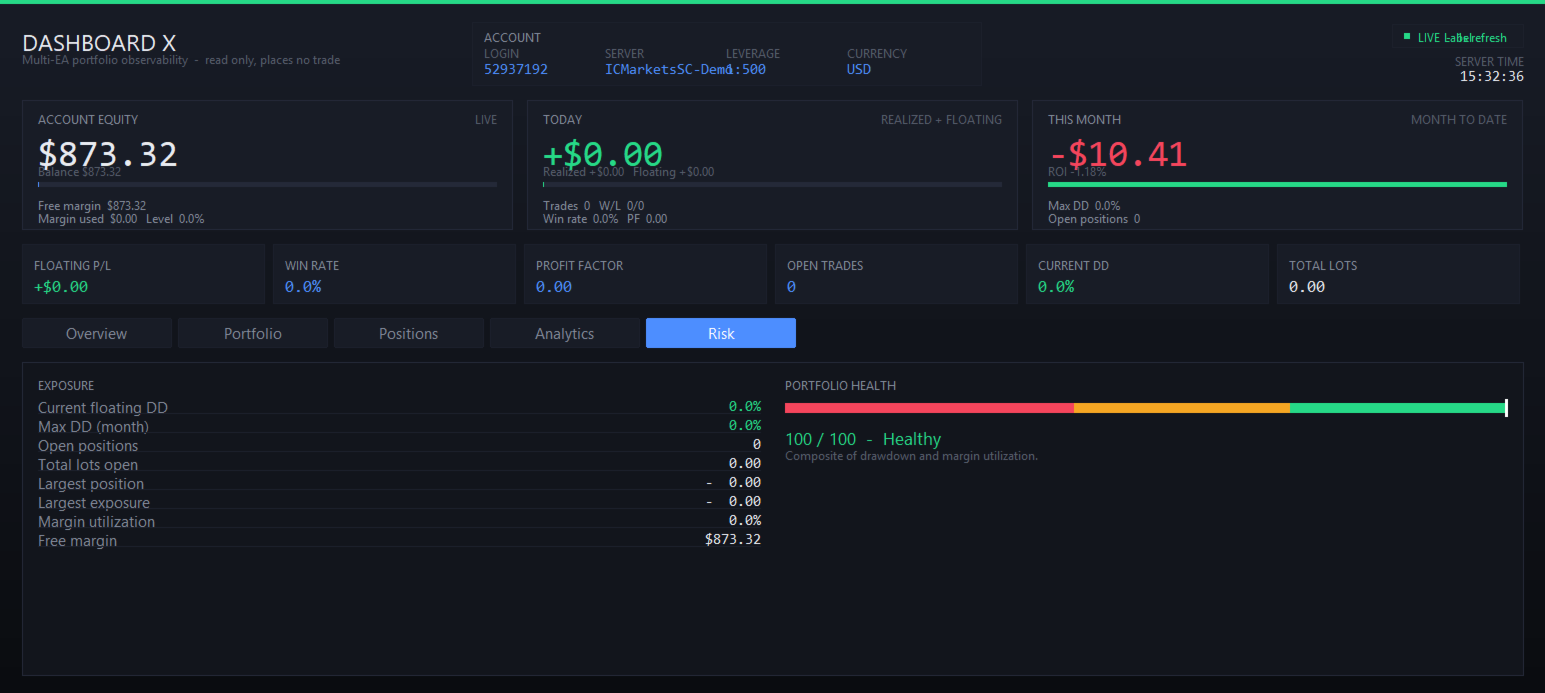
- Risk tab — current and monthly drawdown, largest position, largest symbol exposure, margin utilization, and a composite portfolio health score
- Portfolio tab — open exposure grouped by magic number, so you can see at a glance which EA is carrying the most risk right now
- Persistent drawdown tracking — peak equity and max DD survive terminal restarts
Coming in a future update: realized P/L per EA (today/monthly) on the Portfolio tab, and the Analytics tab (equity curve, profit-by-EA, win/loss split) — both require a closed-history aggregation engine that's still in development. Marked clearly as "pending" in the UI rather than showing fake numbers.
Inputs:
- InpHideChart — hide the price chart underneath (default: on)
- InpShowGradient — panel background gradient (default: on)
- InpDDWarnPct / InpDDDangerPct — drawdown thresholds for the amber/red warning colors
Works on any symbol, any timeframe — the dashboard reads account-wide data, not chart data, so the symbol you attach it to doesn't matter.
Free. Feedback and feature requests welcome in the comments — Analytics and per-EA realized P/L are the next things being built.