Qzones
- Indicatori
- Versione: 4.1

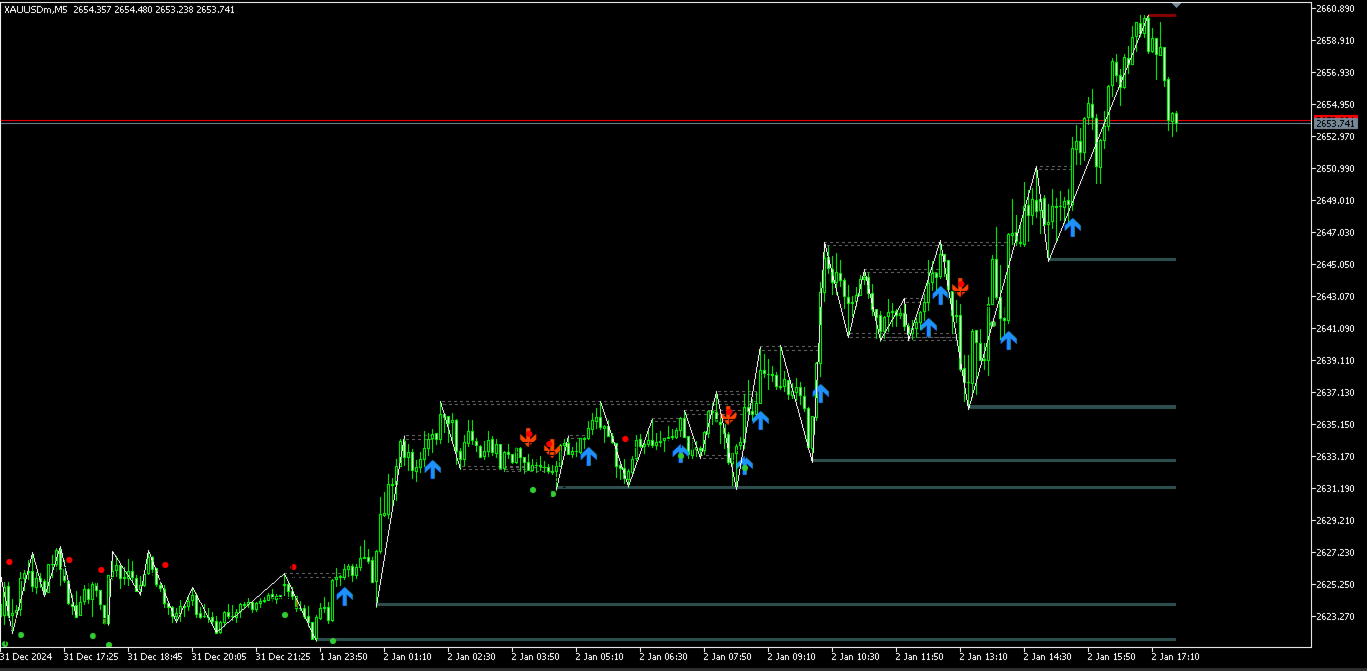
Quantific Structure Zone is a technical indicator designed for Price Action and SMC traders. It maps the market structure and identifies dynamic supply and demand zones on the chart.
Built with a non-repainting algorithm, it provides signals upon confirmed candle closes, making it suitable for live trading and backtesting. The indicator highlights market swings and price levels.
Features
-
Automated Market Structure: Identifies and labels structural swing points with HH (Higher High), HL (Higher Low), LH (Lower High), and LL (Lower Low) connected via structure lines.
-
Dynamic Zones: Draws solid boxes for active Support and Resistance areas. Once a zone is broken by a candle close, it turns into a transparent dotted outline for historical reference.
-
Non-Repainting Signals: Breakout arrows and reversal diamond signals are generated after the candle is fully closed. Signals do not shift, disappear, or repaint.
-
Take Profit Labels: Displays a TP label when a structural market shift occurs to assist with exit management.
-
Performance Optimized: Uses a dual-loop calculation engine and history limits to maintain chart operation.
How to Trade
-
Trend Reversals: Look for the Diamond signal accompanied by a TP label. This indicates a potential structural shift from a bearish trend to a bullish trend, or vice versa.
-
Zone Breakouts: Trade continuation setups when a solid active zone is broken and a Breakout Arrow appears after the candle close.
-
Zone Retests: Use the active solid zones as areas of interest to look for price rejection or lower timeframe entry patterns.
Input Parameters
-
Max History Bars: Limits the number of historical bars calculated to maintain platform performance (Default: 2000).
-
Pivot Strength: The number of left and right bars required to confirm a structural swing high or low (Default: 5).
-
Zone Height Points: The vertical thickness of the generated support and resistance boxes, measured in standard points (Default: 200).
-
Visual Settings: Customizable colors for Active Resistance, Active Support, Broken Zones, Structure Lines, and Signal Arrows.
Recommendations
-
Suitable instruments: XAUUSD, Forex pairs, and Indices.
-
Recommended Timeframes: M15, H1, H4, and Daily.
-
Disclaimer: This indicator is a technical analysis tool. Use it in conjunction with your own market analysis and risk management rules.