HonestGridNet
- Experts
- Versione: 1.80
- Attivazioni: 5

# HonestGridNet — a controlled AUDNZD grid for MetaTrader 5
HonestGridNet is a systematic two-sided grid/averaging Expert Advisor for AUDNZD on MetaTrader 5 netting accounts. It is a grid with a lot multiplier — not a disguised “AI”, “arbitrage”, or “no-loss” robot. The key difference from typical grid systems is that the first-level lot is calculated from a predefined risk limit, MaxLoss, instead of being chosen manually.
MaxLoss scales the strategy. A lower MaxLoss means lower return and lower drawdown; a higher MaxLoss means higher return and deeper equity drawdown. In the research study, the sequence of virtual baskets stayed the same; only position size changed.
---
## Who it is for
HonestGridNet is designed for traders who understand the averaging profile: a high percentage of profitable baskets, step-like balance growth, and frequent floating drawdown on equity. It is for users who evaluate an Expert Advisor on the full history, including drawdowns and stops, not only on a good-looking section of the curve.
This is not a “holy grail without drawdown”. The equity stop is a planned part of the mechanics. If seeing floating loss is psychologically unacceptable, this type of strategy is probably not suitable.
---
## Historical study 2008–2026 — not a guarantee of future performance
The research was performed on AUDNZD using 18.4 years of Dukascopy M1 history, about 6.8 million one-minute bars. Model assumptions: $100,000 initial deposit, 1:500 leverage, and a 2.2-pip spread model on each side. The figures below are historical simulation results, not a promise of performance with your broker or on a live account.
| Risk profile | MaxLoss | Return per year | Max equity DD | Worst month | Profit Factor | Stops in 18 years |
|---|---:|---:|---:|---:|---:|---:|
| Conservative | 10% | ~2.7% | −12.5% | −5.3% | 5.87 | 1 |
| Moderate | 15% | ~4.0% | −18.6% | −7.9% | 5.86 | 1 |
| Balanced | 20% | ~5.3% | −24.6% | −10.5% | 5.86 | 1 |
| Aggressive | 25% | ~6.5% | −30.4% | −13.2% | 5.86 | 1 |
The important point is that MaxLoss is a position-size control. In the study, all four profiles had the same virtual basket sequence: 1,879 closed baskets, the same single stop, and almost the same Profit Factor. You are not choosing a “better version” of the strategy; you are choosing the risk amplitude you can tolerate.
For the first demo test, start with MaxLoss 10% or 15%. The 25% profile is intended only for users who knowingly accept deep equity drawdowns.
---
## How the strategy works
**1. Grid step from daily volatility.** Step = K × ATR(D1, 20). The validated configuration uses K = 1.2. The grid becomes tighter in calmer markets and wider in more volatile markets.
**2. Two virtual baskets.** The EA keeps separate virtual LONG and SHORT books. On a netting account, only their net delta is traded for real. This reduces the number of real trades compared with the virtual model, but it does not remove market risk.
**3. Averaging ladder.** Up to 10 levels per side, with each next level multiplied by 2.3. This is an aggressive geometry, so the system is not protected by “endless averaging”; it is controlled by predefined MaxLoss and an equity stop.
**4. Basket take-profit.** TP = 0.7 of the grid step from the basket average price. Each additional level moves the average closer to the market, which is the mechanism that allows deep baskets to recover on a reversal.
**5. Lot size from risk.** The base lot is calculated so that a full grid to the maximum depth, plus one additional adverse step, corresponds to MaxLoss% of the virtual balance. A margin budget and a hard total-volume ceiling are applied as additional constraints.
**6. Equity stop and LOCK.** If the floating loss of the virtual books reaches MaxLoss, the EA closes the real net position, enters LOCK mode, and does not open new trades until a reset. Optional auto-resume after a defined number of hours is available, but for live trading a manual reset after reviewing the stop is recommended.
**7. Execution protection.** Quotes and tick value are checked before calculations. New opens and additions are blocked when the spread is too wide. If a live or pending order exists on the symbol, the virtual logic is paused until execution settles. The virtual books are persisted in terminal global variables, so the EA can survive a terminal restart without losing its internal accounting.
---
## Why there are no extra filters, basket trailing, or per-order stop losses
Additional “improvements” made the selected configuration worse in the research. We separately tested a non-linear lot multiplier, depth-based TP, a projected-drawdown add brake, a lower multiplier, a shorter ladder, a volatility-shock filter, a session filter, and basket trailing. On AUDNZD 2008–2026, these variants worsened either drawdown, return, or out-of-sample behavior.
For that reason, the public configuration is deliberately simple: risk is controlled by position size, virtual accounting, and the equity stop. This does not make the strategy risk-free, but it makes the risk explicit and measurable.
---
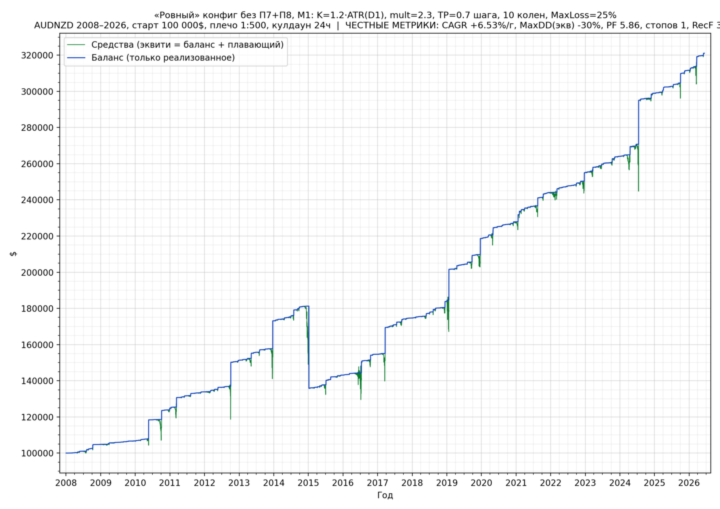
## How to read the tester chart
The blue balance line shows realized results only. It grows in steps because profits are booked by baskets. The green equity line shows balance plus floating P/L from open baskets. Downward spikes are floating drawdowns, not realized losses, but they are still real risk.
For a grid system, it is normal for equity to spend much of its time below balance. In the study, the system spent about 99% of the time in equity drawdown. This is a property of averaging, not an EA malfunction.
---
## Installation and use
1. A MetaTrader 5 netting account is required.
2. Symbol: AUDNZD. Some brokers use suffixes such as AUDNZD.m or AUDNZDx; use the main tradable AUDNZD symbol.
3. The chart timeframe is not critical: the logic is tick-based and the grid step uses D1 ATR.
4. The EA must own the whole symbol. Do not run manual trades, other EAs, or external pending orders on AUDNZD while this EA is active.
5. Deploy the EA and change geometry parameters (`InpKStep`, `InpLotMultiplier`, `InpMaxLevels`, `InpTPFrac`, `InpManualBaseLot`) only when the symbol is flat.
6. The main risk setting is `InpMaxLossPct`. Changing the geometry is not recommended; the published figures refer to the baseline configuration.
7. The comfortable deposit for auto-sizing depends on your broker, leverage, and minimum lot. A practical reference for the full ladder is from about $10,000 at 1:500. For smaller deposits, `InpManualBaseLot` can be used; the EA prints the recommended minimum deposit in the journal and on the panel.
---
## Strategy Tester settings
Use only **Every tick based on real ticks**. Coarse bar-based modes distort the order of touches inside a bar, and for a grid system this is critical.
In the research, the same configuration on M5 bars produced PF 1.69 instead of 5.86. This is not an alternative quality estimate; it shows that rough tester modes are not suitable for making decisions about this strategy.
Before using a live account, run at least 4–8 weeks of demo/forward testing with your broker. Results are sensitive to spread, swap, tick quality, execution, and VPS/terminal uptime.
---
## Risks and limitations
- The validation is AUDNZD-only. This is not a universal multi-symbol robot.
- A stop can happen again. One stop in 18 years is a historical frequency, not a guarantee.
- A price gap can make the actual loss worse than MaxLoss.
- Swaps and commissions are not included in the research model. Their impact depends on your broker.
- The study used a constant 2.2-pip spread model per side. Real spread changes, especially at night and around news.
- The EA depends on tick-by-tick execution. A VPS or terminal interruption at the moment of a TP touch can change the result.
- Future performance may be lower than the historical backtest.
- This is a diversification tool, not the foundation of an entire portfolio.
---
## FAQ
**Is this a martingale?**
It is a grid/averaging system with a lot multiplier. The difference is that the starting lot is calculated from a predefined MaxLoss instead of being chosen arbitrarily.
**Can I use other pairs?**
The public validation was performed only on AUDNZD. Using other symbols is the user’s own risk.
**Why is there no normal SL on each order?**
On a netting account, the EA manages virtual baskets and a real net position. Risk is controlled by the system-level equity stop, not by a stop loss on each individual order.
**Which parameter should users mainly change?**
The main control is `InpMaxLossPct`. The geometry is the research baseline; changing it creates different statistics.
---
## Bottom line
HonestGridNet is a grid that does not pretend to be something else. It shows a typical averaging profile: step-like balance growth, a saw-tooth equity curve, rare deep drawdowns, and a predefined risk limit per cycle. Risk is not hidden in endless averaging: it is explicitly set by MaxLoss and controlled by the equity stop and LOCK. However, gaps, execution quality, swaps, and market regime changes can make live results worse than the historical model.
**Disclaimer.** All figures are historical testing results and are not a promise or guarantee of future returns. Trading involves risk, including substantial drawdowns and losses larger than MaxLoss during price gaps. This material is not personal investment advice. Test on a demo account first and risk only capital you can afford to lose.
HonestGridNet is a systematic two-sided grid/averaging Expert Advisor for AUDNZD on MetaTrader 5 netting accounts. It is a grid with a lot multiplier — not a disguised “AI”, “arbitrage”, or “no-loss” robot. The key difference from typical grid systems is that the first-level lot is calculated from a predefined risk limit, MaxLoss, instead of being chosen manually.
MaxLoss scales the strategy. A lower MaxLoss means lower return and lower drawdown; a higher MaxLoss means higher return and deeper equity drawdown. In the research study, the sequence of virtual baskets stayed the same; only position size changed.
---
## Who it is for
HonestGridNet is designed for traders who understand the averaging profile: a high percentage of profitable baskets, step-like balance growth, and frequent floating drawdown on equity. It is for users who evaluate an Expert Advisor on the full history, including drawdowns and stops, not only on a good-looking section of the curve.
This is not a “holy grail without drawdown”. The equity stop is a planned part of the mechanics. If seeing floating loss is psychologically unacceptable, this type of strategy is probably not suitable.
---
## Historical study 2008–2026 — not a guarantee of future performance
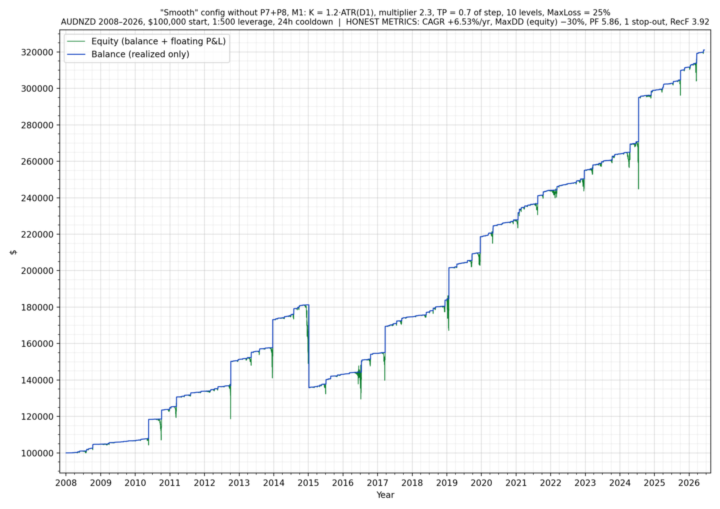
The research was performed on AUDNZD using 18.4 years of Dukascopy M1 history, about 6.8 million one-minute bars. Model assumptions: $100,000 initial deposit, 1:500 leverage, and a 2.2-pip spread model on each side. The figures below are historical simulation results, not a promise of performance with your broker or on a live account.
| Risk profile | MaxLoss | Return per year | Max equity DD | Worst month | Profit Factor | Stops in 18 years |
|---|---:|---:|---:|---:|---:|---:|
| Conservative | 10% | ~2.7% | −12.5% | −5.3% | 5.87 | 1 |
| Moderate | 15% | ~4.0% | −18.6% | −7.9% | 5.86 | 1 |
| Balanced | 20% | ~5.3% | −24.6% | −10.5% | 5.86 | 1 |
| Aggressive | 25% | ~6.5% | −30.4% | −13.2% | 5.86 | 1 |
The important point is that MaxLoss is a position-size control. In the study, all four profiles had the same virtual basket sequence: 1,879 closed baskets, the same single stop, and almost the same Profit Factor. You are not choosing a “better version” of the strategy; you are choosing the risk amplitude you can tolerate.
For the first demo test, start with MaxLoss 10% or 15%. The 25% profile is intended only for users who knowingly accept deep equity drawdowns.
---
## How the strategy works
**1. Grid step from daily volatility.** Step = K × ATR(D1, 20). The validated configuration uses K = 1.2. The grid becomes tighter in calmer markets and wider in more volatile markets.
**2. Two virtual baskets.** The EA keeps separate virtual LONG and SHORT books. On a netting account, only their net delta is traded for real. This reduces the number of real trades compared with the virtual model, but it does not remove market risk.
**3. Averaging ladder.** Up to 10 levels per side, with each next level multiplied by 2.3. This is an aggressive geometry, so the system is not protected by “endless averaging”; it is controlled by predefined MaxLoss and an equity stop.
**4. Basket take-profit.** TP = 0.7 of the grid step from the basket average price. Each additional level moves the average closer to the market, which is the mechanism that allows deep baskets to recover on a reversal.
**5. Lot size from risk.** The base lot is calculated so that a full grid to the maximum depth, plus one additional adverse step, corresponds to MaxLoss% of the virtual balance. A margin budget and a hard total-volume ceiling are applied as additional constraints.
**6. Equity stop and LOCK.** If the floating loss of the virtual books reaches MaxLoss, the EA closes the real net position, enters LOCK mode, and does not open new trades until a reset. Optional auto-resume after a defined number of hours is available, but for live trading a manual reset after reviewing the stop is recommended.
**7. Execution protection.** Quotes and tick value are checked before calculations. New opens and additions are blocked when the spread is too wide. If a live or pending order exists on the symbol, the virtual logic is paused until execution settles. The virtual books are persisted in terminal global variables, so the EA can survive a terminal restart without losing its internal accounting.
---
## Why there are no extra filters, basket trailing, or per-order stop losses
Additional “improvements” made the selected configuration worse in the research. We separately tested a non-linear lot multiplier, depth-based TP, a projected-drawdown add brake, a lower multiplier, a shorter ladder, a volatility-shock filter, a session filter, and basket trailing. On AUDNZD 2008–2026, these variants worsened either drawdown, return, or out-of-sample behavior.
For that reason, the public configuration is deliberately simple: risk is controlled by position size, virtual accounting, and the equity stop. This does not make the strategy risk-free, but it makes the risk explicit and measurable.
---
## How to read the tester chart
The blue balance line shows realized results only. It grows in steps because profits are booked by baskets. The green equity line shows balance plus floating P/L from open baskets. Downward spikes are floating drawdowns, not realized losses, but they are still real risk.
For a grid system, it is normal for equity to spend much of its time below balance. In the study, the system spent about 99% of the time in equity drawdown. This is a property of averaging, not an EA malfunction.
---
## Installation and use
1. A MetaTrader 5 netting account is required.
2. Symbol: AUDNZD. Some brokers use suffixes such as AUDNZD.m or AUDNZDx; use the main tradable AUDNZD symbol.
3. The chart timeframe is not critical: the logic is tick-based and the grid step uses D1 ATR.
4. The EA must own the whole symbol. Do not run manual trades, other EAs, or external pending orders on AUDNZD while this EA is active.
5. Deploy the EA and change geometry parameters (`InpKStep`, `InpLotMultiplier`, `InpMaxLevels`, `InpTPFrac`, `InpManualBaseLot`) only when the symbol is flat.
6. The main risk setting is `InpMaxLossPct`. Changing the geometry is not recommended; the published figures refer to the baseline configuration.
7. The comfortable deposit for auto-sizing depends on your broker, leverage, and minimum lot. A practical reference for the full ladder is from about $10,000 at 1:500. For smaller deposits, `InpManualBaseLot` can be used; the EA prints the recommended minimum deposit in the journal and on the panel.
---
## Strategy Tester settings
Use only **Every tick based on real ticks**. Coarse bar-based modes distort the order of touches inside a bar, and for a grid system this is critical.
In the research, the same configuration on M5 bars produced PF 1.69 instead of 5.86. This is not an alternative quality estimate; it shows that rough tester modes are not suitable for making decisions about this strategy.
Before using a live account, run at least 4–8 weeks of demo/forward testing with your broker. Results are sensitive to spread, swap, tick quality, execution, and VPS/terminal uptime.
---
## Risks and limitations
- The validation is AUDNZD-only. This is not a universal multi-symbol robot.
- A stop can happen again. One stop in 18 years is a historical frequency, not a guarantee.
- A price gap can make the actual loss worse than MaxLoss.
- Swaps and commissions are not included in the research model. Their impact depends on your broker.
- The study used a constant 2.2-pip spread model per side. Real spread changes, especially at night and around news.
- The EA depends on tick-by-tick execution. A VPS or terminal interruption at the moment of a TP touch can change the result.
- Future performance may be lower than the historical backtest.
- This is a diversification tool, not the foundation of an entire portfolio.
---
## FAQ
**Is this a martingale?**
It is a grid/averaging system with a lot multiplier. The difference is that the starting lot is calculated from a predefined MaxLoss instead of being chosen arbitrarily.
**Can I use other pairs?**
The public validation was performed only on AUDNZD. Using other symbols is the user’s own risk.
**Why is there no normal SL on each order?**
On a netting account, the EA manages virtual baskets and a real net position. Risk is controlled by the system-level equity stop, not by a stop loss on each individual order.
**Which parameter should users mainly change?**
The main control is `InpMaxLossPct`. The geometry is the research baseline; changing it creates different statistics.
---
## Bottom line
HonestGridNet is a grid that does not pretend to be something else. It shows a typical averaging profile: step-like balance growth, a saw-tooth equity curve, rare deep drawdowns, and a predefined risk limit per cycle. Risk is not hidden in endless averaging: it is explicitly set by MaxLoss and controlled by the equity stop and LOCK. However, gaps, execution quality, swaps, and market regime changes can make live results worse than the historical model.
**Disclaimer.** All figures are historical testing results and are not a promise or guarantee of future returns. Trading involves risk, including substantial drawdowns and losses larger than MaxLoss during price gaps. This material is not personal investment advice. Test on a demo account first and risk only capital you can afford to lose.