Sub Algo

Sub Algo is a revolutionary indicator for MQL4/MQL5 that transforms how algorithmic strategies are built and executed.

Instead of writing endless if–else conditions, Sub Algo provides a complete visual configuration system with:

  • 6 independent logical operations

  • Adaptive thresholding

  • Automatic Buy/Sell symmetry

  • Simple dropdown menus and input parameters

This is not a library.
This is a ready-to-use professional indicator that converts any combination of technical indicators into precise logical trading signals directly on your chart.

🚀 What Makes Sub Algo Unique?

Sub Algo is the world’s first MQL4/MQL5 indicator implementing a full 6-stage data processing pipeline inside a single chart window.

It allows you to:

✅ Configure complex multi-indicator conditions without coding
✅ Generate perfectly symmetric BUY and SELL signals automatically
✅ Detect divergences, crossovers, extreme zones, and momentum shifts simultaneously
✅ Process up to 4 independent indicator buffers in parallel
✅ Apply 5 logical connectors (AND / OR / XOR / NAND / NOR)

⚙️ Complete Operation Reference

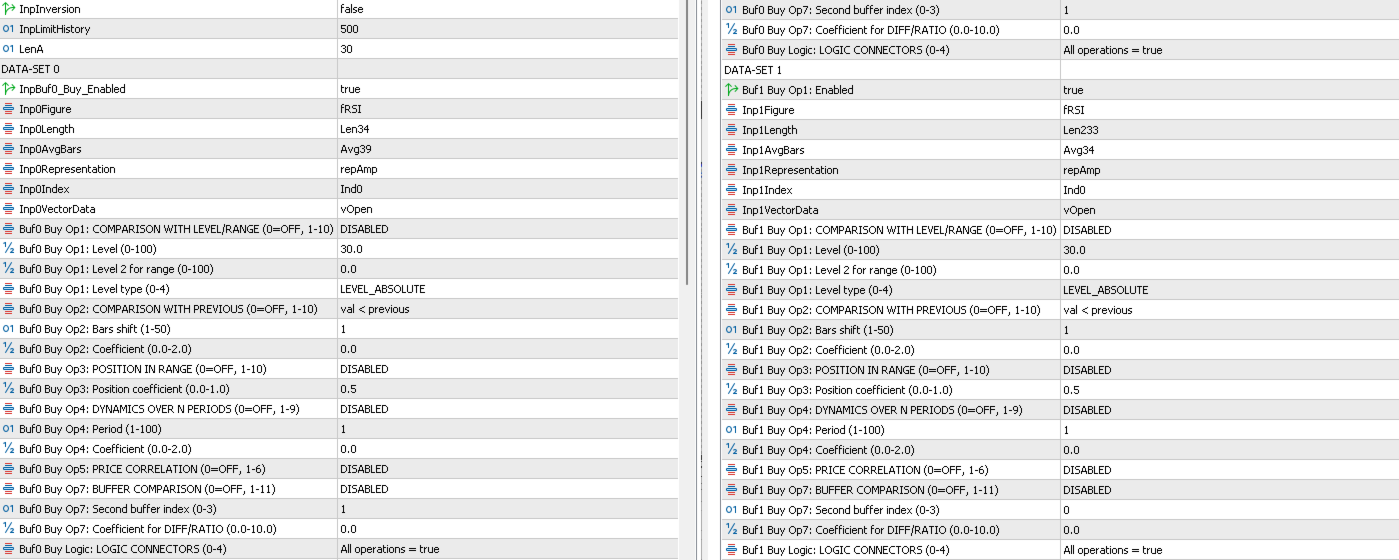
🔹 OPERATION 1 — Compare with Level

Check indicator position relative to horizontal or adaptive levels.

Switch Function
OP1_DISABLED Operation OFF
OP1_GREATER Value > Level
OP1_LESS Value < Level
OP1_GREATER_EQUAL Value ≥ Level
OP1_LESS_EQUAL Value ≤ Level
OP1_CROSS_ABOVE Cross FROM BELOW
OP1_CROSS_BELOW Cross FROM ABOVE

Level Types:

  • LEVEL_ABSOLUTE — Fixed numeric value

  • LEVEL_PERCENTILE — Percentage of range (0–100%)

  • LEVEL_AUTO — Range median

  • LEVEL_DYNAMIC — Volatility-adaptive level

🔹 OPERATION 2 — Compare with Previous

Momentum and acceleration detection.

Switch Function
OP2_DISABLED Operation OFF
OP2_GREATER Current > Previous
OP2_LESS Current < Previous
OP2_GREATER_EQUAL Current ≥ Previous
OP2_LESS_EQUAL Current ≤ Previous
OP2_EQUAL Current = Previous
OP2_NOT_EQUAL Current ≠ Previous
OP2_ACCELERATION Change > (range × coefficient)
OP2_DECELERATION Change < (range × coefficient)

🔹 OPERATION 3 — Position in Range

Locate value inside historical min–max channel.

Switch Function
OP3_DISABLED Operation OFF
OP3_ABOVE_COEFF Above custom percentile
OP3_BELOW_COEFF Below custom percentile
OP3_EXTREME_HIGH Top 10% of range
OP3_EXTREME_LOW Bottom 10% of range
OP3_MID_ABOVE Above 50% midline
OP3_MID_BELOW Below 50% midline
OP3_QUARTILE_1 0–25% (deep value)
OP3_QUARTILE_2 25–50% (lower mid)
OP3_QUARTILE_3 50–75% (upper mid)
OP3_QUARTILE_4 75–100% (peak momentum)

🔹 OPERATION 4 — Dynamics over N Periods

Trend confirmation and extremum detection.

Switch Function
OP4_DISABLED Operation OFF
OP4_INCREASING 3-bar uptrend
OP4_DECREASING 3-bar downtrend
OP4_HIGHER_THAN_N Higher than N bars ago
OP4_LOWER_THAN_N Lower than N bars ago
OP4_HIGHEST_N New N-period high
OP4_LOWEST_N New N-period low

🔹 OPERATION 5 — Price Correlation

Validate indicator against price action.

Switch Function
OP5_DISABLED Operation OFF
OP5_BULLISH Value ↑, Price ↑
OP5_BEARISH Value ↓, Price ↓
OP5_DIVERGENCE_BUY Price ↓, Value ↑
OP5_DIVERGENCE_SELL Price ↑, Value ↓

🔹 OPERATION 6 — Buffer Comparison

Inter-indicator analysis between two buffers.

Switch Function
OP6_DISABLED Operation OFF
OP6_GREATER Buffer0 > Buffer1
OP6_LESS Buffer0 < Buffer1
OP6_GREATER_EQUAL Buffer0 ≥ Buffer1
OP6_LESS_EQUAL Buffer0 ≤ Buffer1
OP6_CROSS_ABOVE Buffer0 crosses ABOVE Buffer1
OP6_CROSS_BELOW Buffer0 crosses BELOW Buffer1
OP6_DIFF_GREATER (Buffer0 − Buffer1) > Coefficient
OP6_DIFF_LESS (Buffer0 − Buffer1) < Coefficient

🔹 LOGIC CONNECTORS

How operations combine to form the final signal.

Switch Rule
LOGIC_AND ALL operations TRUE
LOGIC_OR At least ONE TRUE
LOGIC_XOR EXACTLY ONE TRUE
LOGIC_NAND NOT ALL TRUE
LOGIC_NOR NONE TRUE
🔄 Automatic Symmetry Engine — Zero Coding

Sub Algo’s most powerful feature:

You configure only BUY conditions.
SELL conditions are generated automatically using perfect mathematical inversion:

✓ GREATER ↔ LESS
✓ CROSS_ABOVE ↔ CROSS_BELOW
✓ 70% ↔ 30%
✓ QUARTILE_1 ↔ QUARTILE_4
✓ DIVERGENCE_BUY ↔ DIVERGENCE_SELL
✓ BULLISH ↔ BEARISH

Result: Perfectly balanced long/short systems in seconds.

📊 How Sub Algo Works
  1. Select your indicators — Up to 4 independent data sources (RSI, MACD, Stochastic, custom buffers, etc.)

  2. Configure operations — 40+ logical conditions across 6 categories

  3. Set logic connector — AND / OR / XOR / NAND / NOR

  4. Sub Algo executes — Real-time signal processing directly on chart

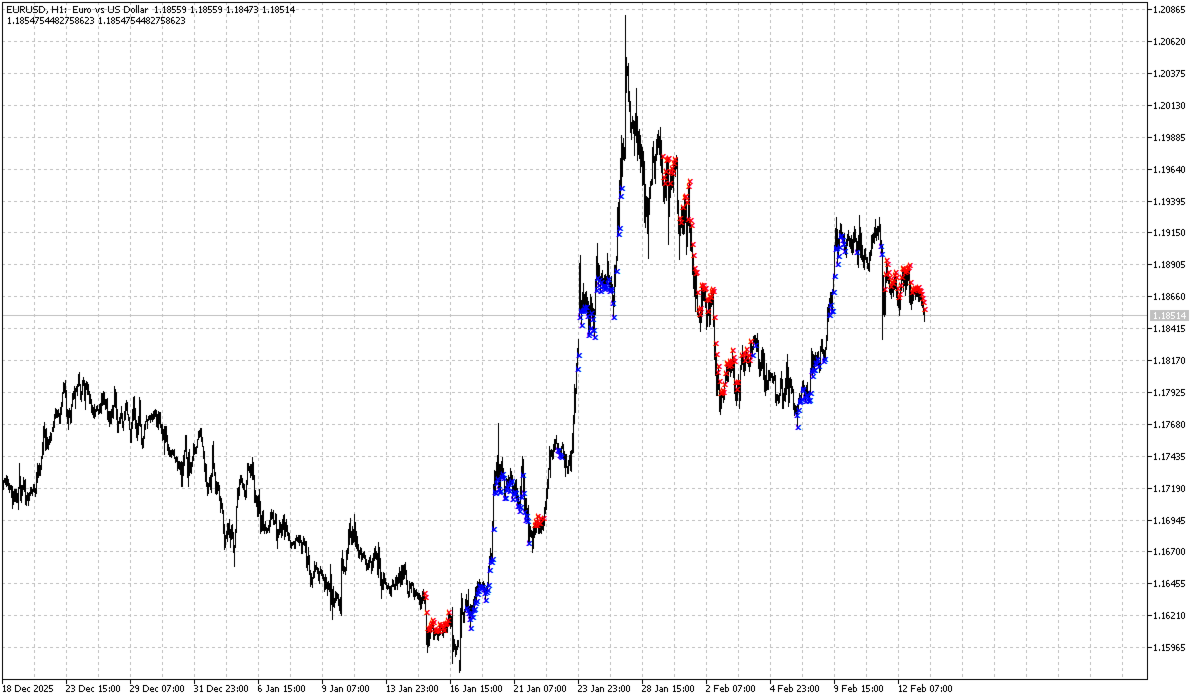
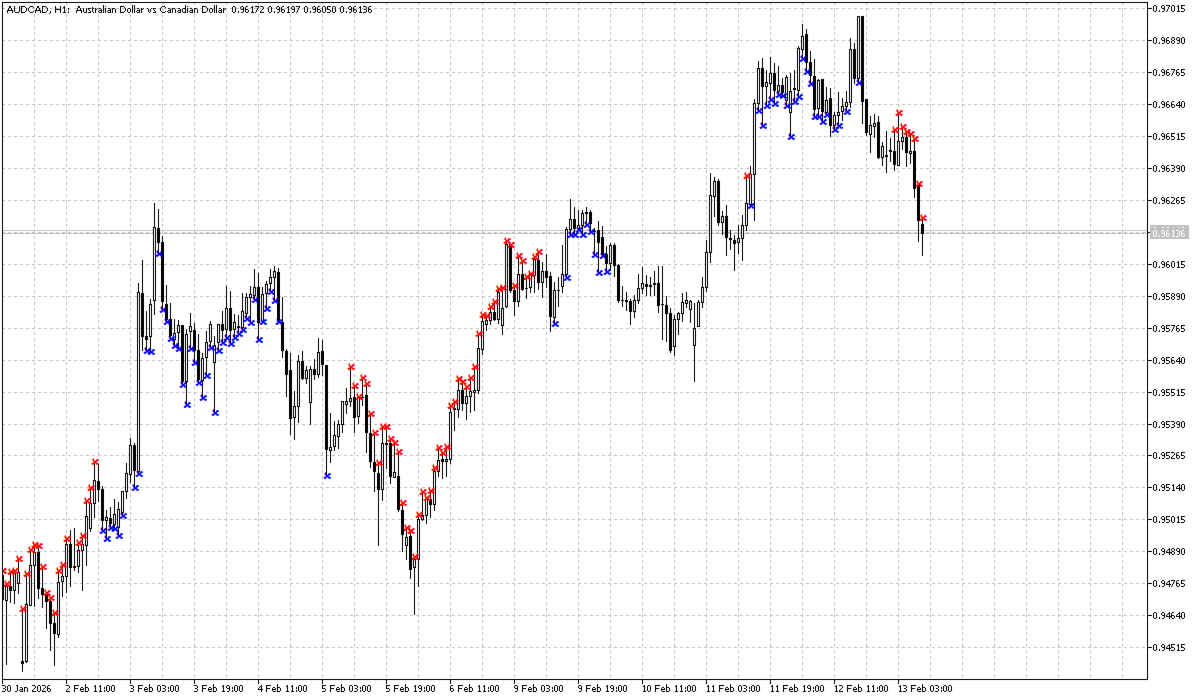
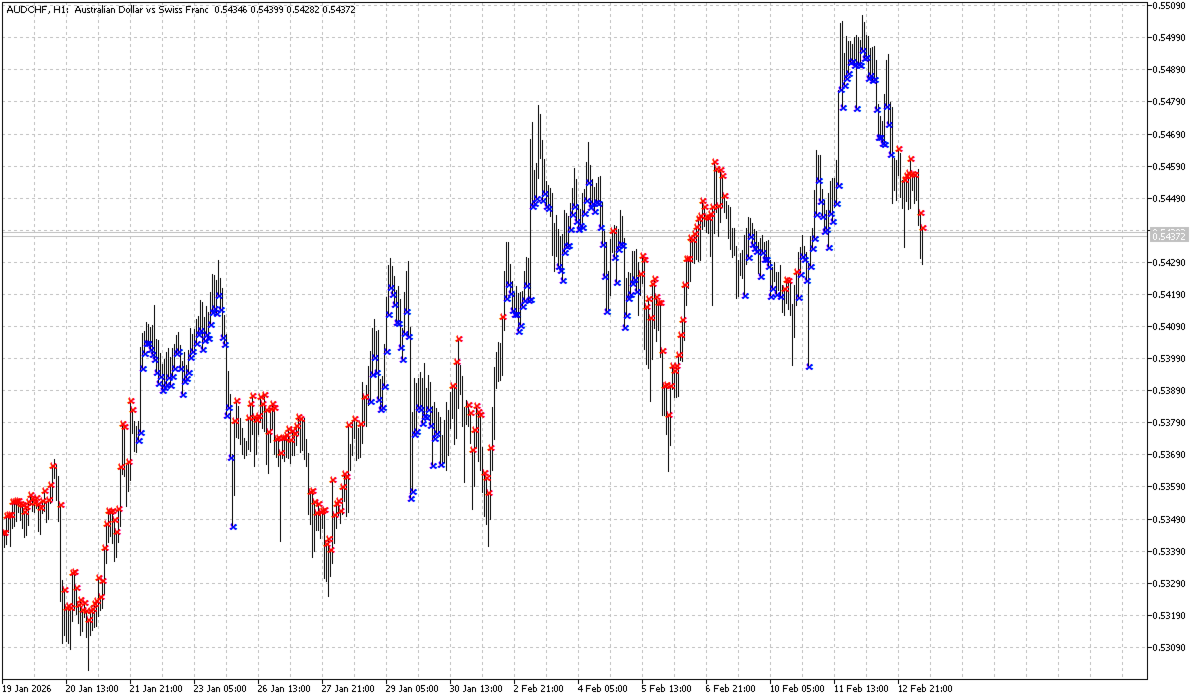
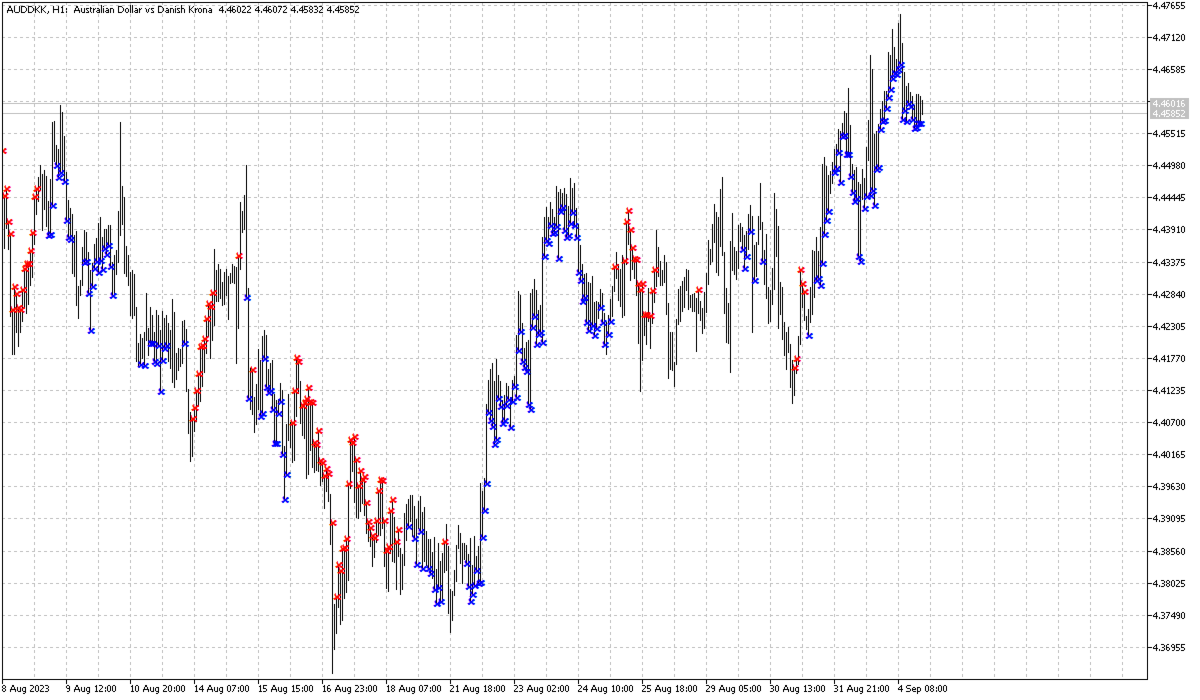
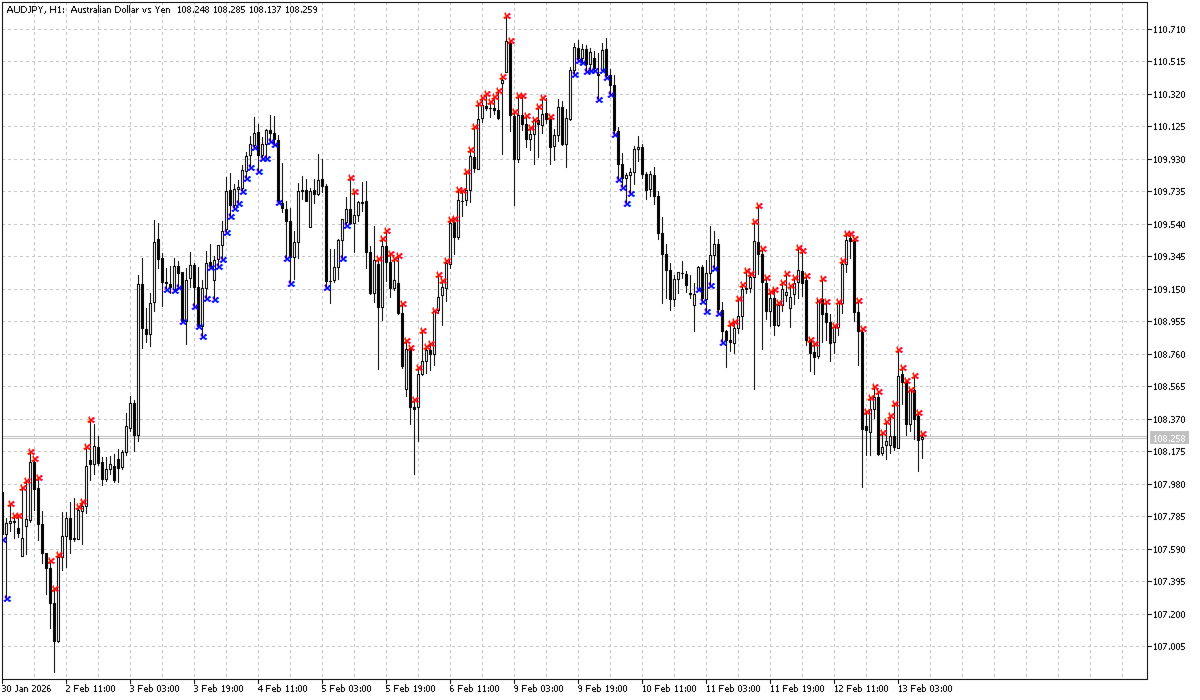
  5. Get arrows — Blue BUY and Red SELL signals with zero latency

🎯 Perfect For
  • Neural network traders — Clean binary feature vectors

  • Systematic strategists — Complex logic without programming

  • Divergence traders — Automatic classic & hidden divergence detection

  • Multi-indicator users — Combine RSI, MACD, Bollinger Bands into one signal

  • Hedge funds & prop firms — Rapid strategy prototyping

✅ Why Professional Traders Choose Sub Algo
Without Sub Algo With Sub Algo
100+ lines of code per condition 5 dropdown selections
Manual SELL duplication Automatic symmetry
Hours of debugging Seconds of configuration
Hardcoded levels Adaptive percentiles
Single-indicator logic 4-buffer correlation

Sub Algo is not a framework.
It’s not a library.

It’s the final signal processor you’ve been waiting for.


Prodotti consigliati
Versione MT4: https://www.mql5.com/en/market/product/157433 Versione MT5: https://www.mql5.com/en/market/product/167286 Volume Imbalance è uno strumento di visualizzazione leggero con Profilo Volume + Squilibrio Delta, progettato per aiutarti a individuare zone di prezzo ad alta attività, pressione direzionale e aree di prezzo "vuote" all'interno di un intervallo di retrospettiva configurabile. A differenza del classico profilo volume che mostra solo il volume totale, questo indicatore suddiv
Quantum Diana
Abdulrahman Saad
Quantum Diana – Smart Trend Trading Redefined Quantum Diana is a powerful trend-following trading EA engineered to capture strong market momentum with precision. It identifies emerging trends early using advanced price structure and volatility analysis. The system filters out market noise and avoids low-probability sideways conditions. With multi-timeframe confirmation, Quantum Diana ensures high-quality trade entries. Its adaptive risk management dynamically adjusts stop-loss and position sizin
Algo Trading Indicaor MT5 The ATC ALGO indicator has been developed to work on the MetaTrader 5 platform. It has the same specifications and zones as the MetaTrader 4 version. There may be slight lag, which we believe is due to differences in MetaTrader 5 programming. We will work on improving it, God willing. MT5 Version                    https://www.mql5.com/en/market/product/170028 MT4 Version                    https://www.mql5.com/en/market/product/88034 With this indicator , you’ll have
Fundamental Signals Indicator MT5
Kyra Nickaline Watson-gordon
Fundamental Signals Indicator is a Non-Repaint Indicator with a powerful calculation engine that can predict market movement over 3000 pips (30000 points). The indicator does not analyze the market fundamentally, it is named fundamental because it can predict trends with large movements, no complicated inputs and low risk. Also Indicator can alert on market trend changes. Using Indicator : The Indicator is very simple and without complicated input parameters. (No need to optimize anything.)T
CChart
Rong Bin Su
Overview In the fast-paced world of forex and financial markets, quick reactions and precise decision-making are crucial. However, the standard MetaTrader 5 terminal only supports a minimum of 1-minute charts, limiting traders' sensitivity to market fluctuations. To address this issue, we introduce the Second-Level Chart Candlestick Indicator , allowing you to effortlessly view and analyze market dynamics from 1 second to 30 seconds on a sub-chart. Key Features Support for Multiple Second-Level
Uno dei pochi indicatori che calcola i livelli esclusivamente in base al prezzo. L’indicatore non è influenzato dai timeframe, dai trend o dai cicli di mercato. Uno degli indicatori più logici mai creati. L’indicatore FIFTY è ora disponibile in una versione automatica, che elimina la necessità di tracciare manualmente i livelli. Questa versione disegna automaticamente sul grafico i livelli giornalieri, settimanali, mensili e annuali, garantendo precisione e risparmio di tempo. Inoltre, sono pres
Visual Polar Bear Indicator
AL MOOSAWI ABDULLAH JAFFER BAQER
Unlock the Market's True Direction with the Visual Polar Bear Indicator Are you tired of relying on single-instrument indicators that only show a fraction of the market's story? Do you want a powerful, visual tool that cuts through the noise and gives you a clear, comprehensive view of currency strength and weakness? Introducing the Visual Polar Bear Indicator , a sophisticated multi-asset cluster indicator designed to give you a decisive edge in the forex market. For just $30, you can transfor
Defense Line
Silvio Marcos Garcia
Indicator that determines very accurately "future" where BUYERS and SELLERS will defend their positions. DOES NOT use moving averages, Fibonacci or any other underlying indicators. SIMPLE AND EFFICIENT !! In these defense regions "DEFENSE LINE" is the best region for decision making to buy / sell. 1- Place the indicator on the chart 2 - Move the Vertical lines to the period to be analyzed 3 - The Defense Line will be drawn automatically 4 - To erase the Defense Line, press the "R" key
AO Trade
Ka Lok Louis Wong
Il sistema di trading AO è specificamente progettato per il trading di tendenza, utilizzando i tempi di asta o di notizie come punti di riferimento per confrontarli con altri tempi di ordine specifici al fine di anticipare le tendenze di mercato. **Tutti i parametri temporali utilizzati nell'EA si basano sull'orario del tuo terminale. I diversi broker possono operare in fusi orari GMT differenti, il che può variare ulteriormente a causa degli aggiustamenti legati all'ora legale.** **Assicurati
The Expert Advisor analyzes tick micro-signals and determines the direction to open a position. Micro-signals are identified by predetermined codes, which in the optimization are recorded in the settings of the bot. When a bot sees the corresponding micro-signal, it reacts to it by opening a position and its accompaniment! The bot has good predictability. You can check the work of the bot on the simulation of real history, how to configure the tester will be shown in the screenshot. Also, we sh
Blue Orbit
Farel
4.86 (7)
Blue Orbit Il prezzo di oggi è 190 . Quando 10 copie sono vendute, il nuovo prezzo sarà 249 . Non perdere il posto anticipato. Attualmente venduto: 9 . Entra in una nuova era del trading automatico con Blue Orbit —un EA progettato per interpretare le naturali “dinamiche di flusso” del mercato. Progettato per la precisione, questo sistema si concentra sulla lettura dei cambiamenti di momentum in tempo reale, rilevando le zone di esaurimento e eseguendo ingressi dove l'esaurimento del trend incon
Trend Monitor VZ MT5
Sergey Ermolov
5 (1)
Versione MT4   |   Indicatore Valable ZigZag   |  FAQ La teoria delle onde di Elliott   è un'interpretazione dei processi dei mercati finanziari che si basa sul modello visivo delle onde sui grafici dei prezzi. Secondo questa teoria, possiamo sapere esattamente quale tendenza sta prevalendo sul mercato, ascendente o discendente .   L'indicatore Valable ZigZag   mostra   la struttura a onde del mercato   e indica la direzione del trend principale al momento sul timeframe corrente. Per comodità,
Market structures, Market balance, Range breakouts This tools helps to identify areas of market ranges, structures and plots colored boxes on breakout of those areas. User is given the option to receive alerts and notifications on the formation of the blocks. The tool has the ability to become an essential part of a technical trading system or even pure price action trading. Usage:- An essential tool for price action or technical traders.  More information in the blog
TSI Trend Analyzer
Joao Paulo Ferreira Fortes
4.67 (6)
In which direction should I trade today? For “TREND followers”, we need to determine the TREND . This indicator determines the Trend based on the price High, Low and Close of every bar, for a given period and timeframe. Calculating and plotting the Trend UP and Trend DOWN lines. If the:   “Trend UP” line (Green) is above the “Trend DOWN” line (Red), then it is a BULLISH Trend (see "Screenshots" tab). “Trend DOWN” line (Red) is above the “Trend UP” line (Green), then it is a BEARISH Trend (see "
FREE
Clarity Pulse Detector
Camila Bernardez Camero
Clarity Pulse Detector Clarity Pulse Detector analizza le barre chiuse e le barre di volume associate per identificare vere inversioni di tendenza senza fare affidamento sui dati futuri. L’indicatore calcola la forza dell’impulso basandosi sui parametri SSP (Signal Strength Parameter) configurabili e confronta massimi e minimi recenti per individuare i punti di rottura. Quando viene rilevata un’inversione valida, l’indicatore mostra un cerchio verde sotto una barra rialzista come segnale di a
Key level wedge MT5
Presley Annais Tatenda Meck
The   Key level wedge MT5   indicator automatically draws rising wedge pattern and falling wedge pattern for you on the chart. This pattern is really good when used as a confirmation entry at key support & resistance, supply & demand and reversal zones. Advantages  The   Key level wedge MT5   block DOES NOT RE-PAINT, giving you confidence when a signal appears and also helps when looking back.  The   Key level wedge MT5   includes an on/off button on the chart to easily keep the charts clean
The new update makes this indicator a complete tool for studying, analyzing and operating probabilistic patterns. It includes: On-chart Multi-asset percentage monitor. Configurable martingales. Twenty-one pre-configured patterns, including Mhi patterns and C3. An advanced pattern editor to store up to 5 custom patterns. Backtest mode to test results with loss reports. Trend filter. Hit operational filter. Martingale Cycles option. Various types of strategies and alerts. Confluence between patter
Horizontal Volumes Indicator - using a histogram, displays the volume of transactions at a certain price without reference to time. At the same time, the histogram appears directly in the terminal window, and each column of the volume is easily correlated with the quote value of the currency pair. The indicator practically does not require changing the settings, and if desired, any trader can figure them out. The volume of transactions is of great importance in exchange trading, usually an inc
X Sensors Pro è un indicatore professionale di profilo di volume che visualizza la distribuzione del volume di trading attraverso i livelli di prezzo durante un periodo selezionato. L'indicatore identifica automaticamente gli estremi locali (HH e LL), calcola il Punto di Controllo (POC) — il livello con volume massimo, e costruisce livelli di supporto e resistenza basati sull'intervallo identificato. Caratteristiche principali: Visualizzazione del profilo di volume come istogrammi colorati Ril
It's very simple - there are no settings. It is required to specify only the colors and the size of the arrows. It is also very easy to understand the readings of this indicator. An up arrow is a buy signal, and a down arrow is a sell signal. Try to test it in the strategy tester - you'll like it !!! //////////////////////////////////////////////// /////////////////////////////////// I hope this indicator will be very useful to you in successful trading. Good luck.
Order Block Detector
Cao Minh Quang
5 (2)
Automatically detect bullish or bearish order blocks to optimize your trade entries with our powerful indicator. Ideal for traders following ICT (The Inner Circle Trader). Works with any asset type, including cryptocurrencies, stocks, and forex. Displays order blocks on multiple timeframes, from M2 to W1. Alerts you when an order block is detected, migrated, or a higher timeframe order block is created/migrated. Perfect for both scalping and swing trading. Enhanced by strong VSA (Volume Spread A
The Smart Liquidity Profile is color-coded based on the importance of the traded activity at specific price levels, allowing traders to identify significant price levels such as support and resistance levels, supply and demand zones, liquidity gaps, consolidation zones, Buy-Side/Sell-Side Liquidity and so on.  Smart Liquidity Profile allows users to choose from a number of different time periods including 'Auto,' 'Fixed Range,' 'Swing High,' 'Swing Low,' 'Session,' 'Day,' 'Week,' 'Month,' 'Quart
Smart FVG Stats
- Md Rashidul Hasan
The  Smart FVG Statistics Indicator  is a powerful MetaTrader 5 tool designed to automatically identify, track, and analyze Fair Value Gaps (FVGs) on your charts. Love it? Hate it? Let me know in a review! Feature requests and ideas for new tools are highly appreciated. :) Try "The AUDCAD Trader": https://www.mql5.com/en/market/product/151841 Key Features Advanced  Fair Value Gap  Detection Automatic Identification : Automatically scans for both bullish and bearish FVGs across specified histo
FREE
Quantified Trendline Strength (QTS) Overview Quantified Trendline Strength is a technical analysis tool that automatically detects and evaluates trendlines based on price swing structures. It provides a visual and quantitative way to understand how significant each trendline may be, allowing traders to make more structured observations of market behavior. Indicator Type Category: Trend / Level Detection Display: Chart window (overlay indicator) Purpose: Identify and evaluate trendlines, support
CounterTrend 5
Antony Augustine
The indicator shows buy and sell signals.  The " CounterTrend 5 " is designed to recognize profitable counter trend patterns from your chart. Features: The CounterTrend 5 is a Counter-Trend Trading with Simple Range Exhaustion System. Signals based on the daily trading range. The indicator calculates the trading range for the last few days and compare the price movements on short time intervals and generating short term reversal points.  This is a leading indicator. It works on any instruments.
Binary Flow
Teresinha Moraes Correia
L’indicatore fornisce semplicemente un gran numero di vittorie consecutive emettendo segnali nei quali puoi determinare l’orario di inizio e di fine nelle impostazioni, indicando quando i segnali devono iniziare e smettere di essere emessi, permettendo così di utilizzarlo in programmi di automazione per eseguire operazioni automatiche. ️ Può essere utilizzato su più timeframe, consigliato su 1 minuto, 5 minuti, 15 minuti. Modalità di negoziazione > Per la stessa candela in cui si verifica
Hydra Trend Rider is a non-repainting, multi-timeframe trend indicator that delivers precise buy/sell signals and real-time alerts for high-probability trade setups. With its color-coded trend line, customizable dashboard, and mobile notifications, it's perfect for traders seeking clarity, confidence, and consistency in trend trading. Setup & Guide:  Download  MT4 Version here. To learn how to use the Indicator: Indicator Manual & Guide -   Read Here Follow our MQL5 channel for daily market ins
G Channels – Efficient Adaptive Channel Indicator Introduction Channel indicators are widely used in technical analysis, offering valuable insights into price movements, trend identification, and volatility. Most channel-based indicators, such as Bollinger Bands and Keltner Channels, rely on a central tendency estimator (e.g., a moving average) combined with a volatility component to define upper and lower bands. The G Channels indicator takes this concept further by leveraging a highly efficie
Tyr AI
Nestor Alejandro Chiariello
Ciao trader, ho progettato questo strumento con risultati reali in modo rigoroso, strumento basato su diverse delle mie precedenti strategie, adattandolo al mercato Forex, Tyr AI, con il potere del Dio dell'ordine, un sistema neurale di apprendimento automatico basato sull'intelligenza artificiale per effettuare un'analisi approfondita del mercato dello scalping un solido EA per gestire bene il mercato ufficiale EURUSD, analizzando il mercato per effettuare voci a livelli professionali senza co
Adaptive Volatility Range [AVR] -  is a powerful tool for identifying key trend reversals. AVR -   accurately displays the Average True Volatility Range taking into account the Volume Weighted Average price. The indicator allows you to adapt to absolutely any market volatility by calculating the average volatility over a certain period of time - this provides a stable indicator of positive transactions. Thanks to this , Adaptive Volatility Range   has a high   Winrate of 95% There are two ways t
Gli utenti di questo prodotto hanno anche acquistato
Azimuth Pro
Ottaviano De Cicco
5 (6)
LAUNCH PROMO Azimuth Pro price is initially set at 299$ for the first 100 buyers. Final price will be 499$ . THE DIFFERENCE BETWEEN RETAIL AND INSTITUTIONAL ENTRIES ISN'T THE INDICATOR — IT'S THE LOCATION. Most traders enter at arbitrary price levels, chasing momentum or reacting to lagging signals. Institutions wait for price to reach structured levels where supply and demand actually shift. Azimuth Pro maps these levels automatically: swing-anchored VWAP, multi-timeframe structure lines, an
CGE Trading Suite
Carl Gustav Johan Ekstrom
5 (1)
CGE Trading Suite delivers the analytical edge typically reserved for professional trading desks. The platform integrates a full suite of analytical tools into one seamless workflow: dynamic grid mapping, liquidity behavior analysis, ECM, trend lines, MIDAS, trade cycles, and directional channel projections. Together, these provide a unified view of market structure and momentum. Directional clarity is further enhanced by the capital flow index, which measures currency basket strength to identif
RelicusRoad Pro: Sistema Operativo Quantitativo di Mercato 70% DI SCONTO ACCESSO A VITA (TEMPO LIMITATO) - UNISCITI A 2.000+ TRADER Perché la maggior parte dei trader fallisce anche con indicatori "perfetti"? Perché operano su Singoli Concetti isolati. Un segnale senza contesto è una scommessa. Per vincere serve CONFLUENZA . RelicusRoad Pro non è un semplice indicatore. È un Ecosistema Quantitativo completo . Mappa la "Fair Value Road", distinguendo tra rumore e rotture strutturali. Smetti di in
OmniSync Projection
Antonio-alin Teculescu
5 (1)
Chronos Fractal Engine is an innovative price projection indicator for MetaTrader 5, designed to transform your technical analysis by intelligently identifying and projecting historical price patterns. Built upon an advanced correlation algorithm and the fractal principles of the market, this powerful tool visualizes potential future price movements, giving you a unique edge in your trading decisions. What is Chronos Fractal Engine? At its core, the Chronos Fractal Engine employs a sophisticat
ARICoins
Temirlan Kdyrkhan
ARICoin is a powerful trading companion designed to generate high-probability entry signals with dynamic TP/SL/DP levels based on volatility. Built-in performance tracking shows win/loss stats, PP1/PP2 hits, and success rates all updated live. Key Features: Buy/Sell signals with adaptive volatility bands Real-time TP/SL/DP levels based on ATR Built-in MA Filter with optional ATR/StdDev volatility Performance stats panel (Success, Profit/Loss, PP1/PP2) Alerts via popup, sound, push, or email Cust
ARIPoint
Temirlan Kdyrkhan
ARIPoint is a powerful trading companion designed to generate high-probability entry signals with dynamic TP/SL/DP levels based on volatility. Built-in performance tracking shows win/loss stats, PP1/PP2 hits, and success rates all updated live. Key Features: Buy/Sell signals with adaptive volatility bands Real-time TP/SL/DP levels based on ATR Built-in MA Filter with optional ATR/StdDev volatility Performance stats panel (Success, Profit/Loss, PP1/PP2) Alerts via popup, sound, push, or email Cu
Il Sistema globale di analisi dello stato di mercato China Tianji è un indicatore MT5 per l’analisi dello stato del mercato utilizzabile su qualsiasi simbolo e su qualsiasi timeframe. Aiuta il trader a capire se il mercato attuale è più vicino a una fase laterale o a una tendenza, e a riconoscere quali aree di prezzo meritano maggiore attenzione e quali possono sembrare interessanti ma restano comunque più rischiose. Il Sistema globale di analisi dello stato di mercato China Tianji è un sistema
AriX
Temirlan Kdyrkhan
1 (4)
AriX Indicator for MT5 A powerful trend-following and signal-evaluation tool AriX is a custom MT5 indicator that combines Moving Averages and ATR-based risk/reward logic to generate clear buy/sell signals. It visualizes dynamic SL/TP levels, evaluates past trade outcomes, and displays win/loss statistics in a clean on-chart panel. Key features include: Buy/Sell signals based on MA crossovers ATR-based SL/TP1/TP2/TP3 levels with visual lines and labels Signal outcome tracking with real-time stat
Meravith MT5
Ivan Stefanov
5 (1)
Strumento per market maker. Meravith: Analizzerà tutti i timeframe e mostrerà il trend attualmente in corso. Evidenzierà le zone di liquidità (equilibrio dei volumi) dove i volumi rialzisti e ribassisti sono uguali. Mostrerà tutti i livelli di liquidità dei diversi timeframe direttamente sul grafico. Genererà e presenterà un’analisi di mercato testuale a scopo di riferimento. Calcolerà obiettivi, livelli di supporto e punti di stop-loss in base al trend attuale. Calcolerà il rapporto rischio/ren
Innanzitutto, vale la pena sottolineare che questo Strumento di Trading è un Indicatore Non-Ridipingente, Non-Ridisegnante e Non-Laggante, il che lo rende ideale per il trading professionale. Corso online, manuale utente e demo. L'Indicatore Smart Price Action Concepts è uno strumento molto potente sia per i nuovi che per i trader esperti. Racchiude più di 20 utili indicatori in uno solo, combinando idee di trading avanzate come l'Analisi del Trader del Circolo Interno e le Strategie di Tradin
Ace Trend
Mikhail Sergeev
5 (3)
Ti presentiamo un indicatore rivoluzionario che cambia le regole del gioco nel mondo del trading di tendenza. L'indicatore è progettato per ripensare le prestazioni e portare la tua esperienza di trading a livelli senza precedenti. Il nostro indicatore vanta una combinazione unica di funzionalità all'avanguardia che lo distinguono dalla concorrenza. La tecnologia avanzata "Real Pricing Factors" offre una sostenibilità senza pari anche nelle condizioni di mercato più difficili e volatili. Dì addi
L'indicatore " Dynamic Scalper System MT5 " è progettato per il metodo di scalping, ovvero per il trading all'interno di onde di trend. Testato sulle principali coppie di valute e sull'oro, è compatibile con altri strumenti di trading. Fornisce segnali per l'apertura di posizioni a breve termine lungo il trend, con ulteriore supporto al movimento dei prezzi. Il principio dell'indicatore. Le frecce grandi determinano la direzione del trend. Un algoritmo per generare segnali per lo scalping sott
Introduction to X3 Chart Pattern Scanner X3 Cherart Pattern Scanner is the non-repainting and non-lagging indicator detecting X3 chart patterns including Harmonic pattern, Elliott Wave pattern, X3 patterns, and Japanese Candlestick patterns. Historical patterns match with signal patterns. Hence, you can readily develop the solid trading strategy in your chart. More importantly, this superb pattern scanner can detect the optimal pattern of its kind. In addition, you can switch on and off individu
Gem SIGNAL
Shengzu Zhong
GEM Signal Pro GEM Signal Pro è un indicatore trend-following per MetaTrader 5, progettato per i trader che desiderano segnali più chiari, configurazioni operative più strutturate e una gestione del rischio più pratica direttamente sul grafico. Invece di mostrare solo una semplice freccia, GEM Signal Pro aiuta a presentare l’intera idea di trading in modo più chiaro e leggibile. Quando le condizioni sono confermate, l’indicatore può mostrare sul grafico il prezzo di ingresso, lo stop loss e gli
ARIScalping
Temirlan Kdyrkhan
ARIScalp is a powerful trading companion designed to generate high-probability entry signals with dynamic TP/SL/DP levels based on volatility. Built-in performance tracking shows win/loss stats, PP1/PP2 hits, and success rates all updated live. Key Features: Buy/Sell signals with adaptive volatility bands Real-time TP/SL/DP levels based on ATR Built-in MA Filter with optional ATR/StdDev volatility Performance stats panel (Success, Profit/Loss, PP1/PP2) Alerts via popup, sound, push, or email Cus
L’indicatore evidenzia le zone in cui viene dichiarato interesse sul mercato , per poi mostrare la zona di accumulo degli ordini . Funziona come un book degli ordini su larga scala . Questo è l’indicatore per i grandi capitali . Le sue prestazioni sono eccezionali. Qualsiasi interesse ci sia nel mercato, lo vedrai chiaramente . (Questa è una versione completamente riscritta e automatizzata – non è più necessaria un’analisi manuale.) La velocità di transazione è un indicatore concettualmente nuo
TrendMaestro5
Stefano Frisetti
Attenzione alle truffe, questo indicatore e' distribuito esclusivamente su MQL5.com nota: questo indicatore e' per METATRADER5, se vuoi la versione per  METATRADER4 questo e' il link:   https://www.mql5.com/it/market/product/108106 TRENDMAESTRO ver 2.5 TRENDMAESTRO   riconosce un nuovo TREND sul nascere, non sbaglia mai. La sicurezza di identificare un nuovo TREND non ha prezzo. DESCRIZIONE TRENDMAESTRO identifica un nuovo TREND sul nascere, questo indicatore prende in esame la volatilita' i
Weis Wave with Alert MT5
Trade The Volume Waves Single Member P.C.
4.94 (17)
Rental/Lifetime Package Options and Privileges  Rent Monthly Six Months   Yearly/Lifetime Weis Wave with Speed with Alert+Speed Index x x x Manual  x x x Quick Set up Video x x x Blog x x x Lifetime Updates x x x Setup and Training Material x x Discord Access Channel "The SI traders"          x Rectangle Break Alert Tool      x How to trade with it:    http://www.tradethevolumewaves.com   ** If you purchase please contact me to setup your  : Training Room and  complete manual access.  Wei
Rtc ML Ai Predictor
Muhammad Faisal Sagala
Rtc ML Ai | Predictor CORE MACHINE LEARNING ENGINE Adaptive ML Market Predictor – Multi-Bar Trend & Candle Forecast What This Indicator Does This indicator is a  real-time market prediction engine  designed to analyze price behavior and estimate  future market tendencies . Unlike conventional indicators, this system  does not rely on static parameters or historical curve-fitting , but adapts its internal state dynamically during live market operation. Instead of using static rules, the indic
SunSignal ML — AI Gold Signals with Multi-Timeframe Confluence SunSignal ML is an advanced AI-powered signal indicator purpose-built for XAUUSD gold trading. It combines a proprietary adaptive trend algorithm with six machine learning models trained on confirmed price pivots to produce high-confidence entry signals with multi-timeframe validation. The indicator runs efficiently on M1, M5 and M15 timeframes and is designed for traders who want precision entries guided by data rather than guesswor
Matreshka
Dimitr Trifonov
5 (2)
Matreshka self-testing and self-optimizing indicator: 1. Is an interpretation of the Elliott Wave Analysis Theory. 2. Based on the principle of the indicator type ZigZag, and the waves are based on the principle of interpretation of the theory of DeMark. 3. Filters waves in length and height. 4. Draws up to six levels of ZigZag at the same time, tracking waves of different orders. 5. Marks Pulsed and Recoil Waves. 6. Draws arrows to open positions 7. Draws three channels. 8. Notes support and re
Elliott Wave Trend was designed for the scientific wave counting. This tool focuses to get rid of the vagueness of the classic Elliott Wave Counting using the guideline from the template and pattern approach. In doing so, firstly Elliott Wave Trend offers the template for your wave counting. Secondly, it offers Wave Structural Score to assist to identify accurate wave formation. It offers both impulse wave Structural Score and corrective wave Structure Score. Structural Score is the rating to sh
Presentazione dell'Indicatore Astronomico per   MT4 / MT5 : Il tuo compagno di trading celeste definitivo Sei pronto a elevare la tua esperienza di trading a livelli celesti? Non cercare oltre, il nostro rivoluzionario Indicatore Astronomico per MT4 è qui. Questo strumento innovativo va oltre gli indicatori di trading tradizionali, sfruttando algoritmi complessi per offrirti intuizioni astronomiche senza pari e calcoli di precisione. Un universo di informazioni a portata di mano:   Ammira un pan
Moon Cycle
Navdeep Singh Kaur
Indicatore tecnico che utilizza l'algoritmo astronomico di Jean Meeus per visualizzare le fasi lunari sui grafici di trading. Presenta una linea curva continua che rappresenta il ciclo lunare con precisione scientifica equivalente agli osservatori professionali. Compatibile con qualsiasi simbolo e timeframe su MT5, inclusi forex, commodities, indici e azioni. Include pannello informativo che mostra fase lunare attuale, percentuale di illuminazione e livelli di riferimento per analisi tecnica. I
Pointer Trend Switch — precision trend reversal indicator Pointer Trend Switch is a high-precision arrow indicator designed to detect key moments of trend reversal based on asymmetric price behavior within a selected range of bars. It identifies localized price impulses by analyzing how far price deviates from the opening level, helping traders find accurate entry points before a trend visibly shifts. This indicator is ideal for scalping, intraday strategies, and swing trading, and performs equa
Prices move for many reasons and these can vary from one operator to another: software, private and institutional traders simultaneously contribute to the formation of the price, making predictive art very difficult. However, there are measurable factors that bind the price to an underlying trend in line with the physical reality that the financial asset represents: these are the macroeconomic indicators. Large investors use this information wisely to set their strategies. Understanding these m
Max Ribbon Mt5
Stefano Frisetti
ATTENZIONE: Questo indicatore è distribuito ESCLUSIVAMENTE su MQL5.com Versione MT4:   https://www.mql5.com/it/market/product/160363 Versione MT5:   https://www.mql5.com/it/market/product/160410 ================================================================================ MAX RIBBON ver 1.00 L'indicatore che ti mostra il TREND in modo chiaro e inequivocabile! ================================================================================ DESCRIZIONE MAX RIBBON è un indicatore di trend
WVAP Scalping
Domantas Juodenis
VWAP Scalping Pro – Advanced VWAP & Market Profile System Professional-Grade VWAP + Market Profile Technology for Precision Trading VWAP Scalping Pro is an advanced analytical tool that integrates Volume-Weighted Average Price (VWAP) analysis with professional Market Profile visualization. It provides traders with institutional-style insights into price structure, volume distribution, and session dynamics — ideal for scalping, intraday, and swing trading strategies. Key Features Triple VWAP St
Big Player Range
Thalles Nascimento De Carvalho
5 (3)
BigPlayerRange – Il miglior indicatore per MT5 BigPlayerRange è considerato il miglior indicatore per Mini Indice e Mini Dollaro su MetaTrader 5. Questo strumento essenziale evidenzia le zone strategiche di azione dei grandi player, offrendo un’analisi tecnica istituzionale di altissima precisione. Come usare BigPlayerRange: Questo indicatore mostra zone di acquisto (linea verde) e di vendita (linea rossa). Quando il prezzo chiude fuori da queste aree, è probabile un movimento di tendenz
Ottieni l’indicatore AUX GRATUITO, il supporto EA e la guida completa, visita per favore – https://www.mql5.com/en/blogs/post/763955 Individua la tendenza. Leggi il pattern. Cronometra l'ingresso. 3 passaggi in meno di 30 secondi! Opera senza sforzo — nessuna analisi richiesta, il tuo assistente intelligente è pronto a semplificare il tuo flusso di lavoro Basta sovraccarico di grafici. Opera con fiducia utilizzando il rilevamento intelligente del bias. Compatibile con tutte le valute, criptova
Altri dall’autore
Pointer Trend Switch — precision trend reversal indicator Pointer Trend Switch is a high-precision arrow indicator designed to detect key moments of trend reversal based on asymmetric price behavior within a selected range of bars. It identifies localized price impulses by analyzing how far price deviates from the opening level, helping traders find accurate entry points before a trend visibly shifts. This indicator is ideal for scalping, intraday strategies, and swing trading, and performs equa
The Compare Graphs indicator is an analysis tool that allows traders to compare two or more graphs on the same chart window. This indicator is commonly used in trading platforms such as MetaTrader and provides a clearer comparison of different financial instruments or time frames. Functions of the Compare Graphs indicator may include: Selecting Charts: The trader can select the charts he wants to compare, such as price charts of different currency pairs or indicators on the same chart. Setting
The   Angle Prices   indicator is a tool that calculates the price angle based on price analysis, interpreting the time vector in the form of price points on the price chart. In other words, the X axis and Y axis are represented as price points, so you can actually calculate the angle with two axes of the same dimension. This allows traders to obtain information about the direction of price movement and possible entry or exit points for trades. Let's look at the main characteristics and interpr
The " Fortune Long " bot works using pending orders and reacts to a channel breakdown with the direction of work in the channel; it is necessary to correctly calculate the levels of entry, stop loss, take profit, and the level of deviation of the pending order from the price. The bot needs to be optimized for 2 years with a forward period of 1/2. Once optimization is complete, select the best settings and save them. Work for 6 months. The bot automatically calculates all levels and the entry le
In the world of trading, one of the main concerns is finding a reliable trading system. Meet the TrendEdge Channel indicator - your reliable companion in this search. Developed based on complex mathematical calculations, this indicator predicts the most likely short-term price movements. TrendEdge Channel is designed specifically to identify trends in price movements. Thanks to it, you can quickly determine not only the direction of the trend, but also the levels of interaction between buyers
With the growth of information technology and the increasing number of participants in financial markets, traditional analysis tools are becoming less effective. Conventional technical indicators, such as the moving average or stochastic, in their pure form are unable to accurately determine the direction of the trend or its reversal. Is it possible to find an indicator that remains effective for 14 years without changing its parameters, and at the same time adapts to market changes? Yes, such
Misio
Sabina Fik
Misio - can be used as an independent trading system. The indicator determines the market trend, ignoring sharp fluctuations and noise around the average price. It displays the trending movement with potential stop points. Simple, clear and effective use. The indicator does not redraw and does not lag. Suitable for all currency pairs and all timeframes. Interpretation: The location of the rate above or below the shadows indicates the presence of a trend. A move into the shadows signals a pos
Trend Divergence Indicator: Your Essential Tool for Market Analysis The Trend Divergence Indicator is a powerful tool designed to assist traders in identifying market trends and pinpointing entry points with precision. By leveraging price divergence, this indicator enhances your trading strategy, offering reliable insights and filtering unnecessary signals. Key Features and Benefits of the Trend Divergence Indicator Accurate Trend Analysis: The Trend Divergence Indicator uses price divergence t
The "BioStar" indicator is an innovative tool for trend analysis on the Forex market. It has unique capabilities and a wide range of settings that will help traders make informed decisions when trading. This indicator is based on the analysis of the market trend and helps to identify the direction of price movement. It uses various mathematical algorithms and statistical methods to determine the strength and stability of the trend in the market. One of the key features of the "BioStar" indica
Core Drift Index: Your Reliable Guide in the World of Trading Core Drift Index is an innovative trend indicator designed for precise detection of market directions and reversal points . This powerful tool enables traders to optimize their investments , minimize risk, and maximize profit. Key Features and Benefits Intuitive Trend Detection Core Drift Index clearly shows trend direction, helping traders make timely entry and exit decisions. High Probability of Success With its high accuracy
Warp Range Sensor: The Color of Your Trend Warp Range Sensor is a trend direction indicator that visually displays the current market condition by coloring bars red and blue based on trend direction. What Does Warp Range Sensor Do? Identifies the Current Trend Direction Blue bars indicate an uptrend Red bars signal a downtrend Universal Application Compatible with all currency pairs and timeframes , from short-term scalping to long-term trading. Powered by Market Context & Historical Data W
Pointer Trend Switch — precision trend reversal indicator Pointer Trend Switch is a high-precision arrow indicator designed to detect key moments of trend reversal based on asymmetric price behavior within a selected range of bars. It identifies localized price impulses by analyzing how far price deviates from the opening level, helping traders find accurate entry points before a trend visibly shifts. This indicator is ideal for scalping, intraday strategies, and swing trading, and performs equa
TrendCore Adaptive FX — Smart Expert Advisor for Confident and Adaptive Forex Trading TrendCore Adaptive FX   is a powerful, fully automated trading robot designed for consistent performance in the Forex market. It combines trend-based technical analysis, adaptive lot management, and solid capital protection strategies to ensure robust and efficient trading under real market conditions. Whether you're a professional trader or a long-term investor, this EA offers an intelligent solution to a
FlexiTrade Bot: Trade Smart, Not Blind Ditch the guesswork.   FlexiTrade Bot   is more than just a trading tool — it’s an intelligent trading engine built for traders who value   speed, precision, and adaptability . With real-time market analysis and pattern recognition, FlexiTrade delivers actionable signals with razor-sharp accuracy so you can focus on results, not reaction.   What Sets FlexiTrade Apart? Market Structure Awareness Unlike bots that rely on rigid indicator rules,   FlexiTr
AlphaTrader: Your Intelligent Partner in Forex Trading AlphaTrader   is an advanced trading system that utilizes automated analysis and trading strategies to optimize decision-making in the Forex market. Built using geometric patterns and cutting-edge algorithms, this bot detects pricing patterns, providing precise signals for successful trades.   Why Choose AlphaTrader? AlphaTrader is not just a trading bot; it’s a   full-fledged partner   designed to help you manage your capital as efficien
Acceleration Bias — Price Acceleration Impulse Indicator Acceleration Bias   is a modern analytical tool designed to measure changes in price acceleration and visualize impulse asymmetry using a robust mathematical model. This indicator is intended for traders working with market volatility, impulse phases, and price-movement structure, as well as those who need algorithmic, rule-based analytical support. Purpose and Core Concept Unlike traditional oscillators that analyze only velocity changes
Structural Equilibrium: A New Era of Adaptive Market Analysis As information technology advances and market participation grows, traditional analytical tools often face declining efficiency. Standard technical indicators frequently struggle to interpret the complexities of modern, algorithm-driven market structures. Structural Equilibrium was developed as a high-performance solution featuring a multi-level adaptive smoothing mechanism. This core logic allows the tool to maintain its analytical r
Phase Analytics Pro: Advanced Cyclic Market Analyzer Phase Analytics Pro is a sophisticated technical tool designed for traders who prioritize mathematical precision over lag-heavy traditional indicators. Based on the principles of digital signal processing, this indicator decomposes price action into phase and quadrature components to identify the dominant market cycle. How it works: The algorithm calculates the instantaneous phase of the market, allowing it to distinguish between trending and
Ось відформатований текст без альтернативних назв у дужках: Latency Edge Scalpel Latency Edge Scalpel is a high-frequency, institutional-grade trading solution engineered for high-precision scalping in the decentralized Forex market. This is not a simple grid or martingale bot; it is a sophisticated mathematical tool designed to exploit micro-structural price gaps and momentary volatility imbalances. The Algorithmic Core At its heart, Latency Edge Scalpel operates on a hybrid volatility-filterin
Sub Algo is a revolutionary indicator for MQL4/MQL5 that transforms how algorithmic strategies are built and executed. Instead of writing endless if–else conditions, Sub Algo provides a complete visual configuration system with: 6 independent logical operations Adaptive thresholding Automatic Buy/Sell symmetry Simple dropdown menus and input parameters This is not a library . This is a ready-to-use professional indicator that converts any combination of technical indicators into precise logical
Orynth P&F Chart Overlay – Clean Trend Visualizer Orynth is a professional technical analysis tool that brings the power of Point and Figure (P&F) charting directly onto your standard candlestick chart. It filters out market noise by focusing solely on meaningful price movement, allowing traders to identify clear trends and reversals without the distraction of minor fluctuations. Unlike traditional P&F charts that open in a separate window, Orynth overlays price "boxes" directly on your main cha
The Plasma Trend indicator is a simple technical indication that is used to determine the current trend direction in the market. The Plasma Trend indicator is a powerful tool for determining the direction of the trend in the Forex market. It is based on both standard technical indicators and proprietary mathematical calculations, which provides a more accurate and reliable trend determination. Its implementation in the form of lines of two colors simplifies the visual determination of a change
Cryo
Sabina Fik
5 (1)
Cryo is based on the process of identifying the rate of change in price growth and allows you to find entry and exit points from the market. A fundamental technical indicator that allows you to assess the current market situation in order to enter the market of the selected currency pair in a trend and with minimal risk. The Cryo indicator was created on the basis of the original indicators for searching for extremes, the indicator is well suited for determining a reversal or a large sharp jer
The Angle Prices indicator is a tool that calculates the price angle based on price analysis, interpreting the time vector in the form of price points on the price chart. In other words, the X axis and Y axis are represented as price points, so you can actually calculate the angle with two axes of the same dimension. This allows traders to obtain information about the direction of price movement and possible entry or exit points for trades. Let's look at the main characteristics and interpretat
The " Fortune Long " bot works using pending orders and reacts to a channel breakdown with the direction of work in the channel; it is necessary to correctly calculate the levels of entry, stop loss, take profit, and the level of deviation of the pending order from the price. The bot needs to be optimized for 2 years with a forward period of 1/2. Once optimization is complete, select the best settings and save them. Work for 6 months. The bot automatically calculates all levels and the entry le
PricePulse Pro - Indicator of Simple Solutions! Using this indicator is very easy - just follow the colored arrows on the chart. The indicator algorithm takes into account daily price fluctuations and focuses on measuring the "candlestick" share in the trend. This indicator uses an algorithm that considers price changes based on various parameters such as H/C (high price/close), H/O (high price/open), LC (low price/close), LO (low price/open). This allows for a more detailed analysis of price
The "Trend Orbital" indicator is a tool for tracking trends in the financial asset market. It is based on the analysis of price data and provides a visual interpretation of the current direction of price movement. Options: InpAmplitude: Amplitude - determines the amount of volatility that the indicator takes into account when determining the trend. Group "Arrow": InpCodeUpArrow: Up Arrow Code - Defines the arrow symbol to display an uptrend. InpCodeDnArrow: Down Arrow Code - Defines the arrow
The Market Might indicator, despite its apparent simplicity, is based on complex analytical algorithms that allow you to accurately determine the moments of entry and exit from transactions. The signals generated by this indicator are accurate and timely, appearing directly on the current candle. The main task of the Market Might indicator is to determine the moments of entry and exit from trades. Therefore, it displays only the trend line and entry points, which provides a clear view of the m
This technical analysis indicator allows you to determine with high probability whether a trend or a flat pattern prevails in the market. It can be used both for trading within a channel and for breakout trading, provided that stop losses are used to protect against false signals. The indicator displays the channel in the form of lines located above and below the price, like other similar indicators. The upper and lower lines can also act as resistance and support levels. It quite accurately
Determining the current market trend is a key task for successful trading. It is for this purpose that the Book Scheme indicator was developed, which is an advanced algorithm for visually displaying a trend on a chart. Many traders dreamed of having reliable moving averages that kept up with the market. It was this dream that I turned into reality with the help of my indicator. Book Scheme allows you to predict future values ​​and create accurate signals for entering and exiting the market. T
Filtro:
Nessuna recensione
Rispondi alla recensione