XAMD and MDX Indicator ICT for MT4
- Indicatori
- Mehnoosh Karimi
- Versione: 3.1
- Attivazioni: 10
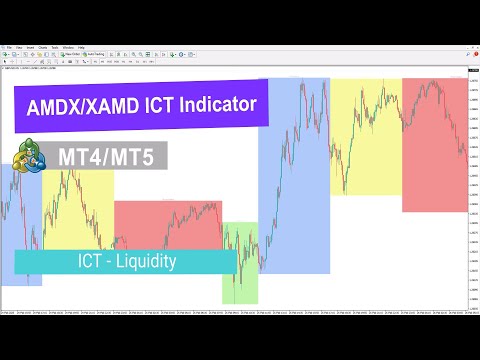
XAMD/AMDX Indicator ICT MT4
The XAMD/AMDX ICT Indicator is a specialized tool for MetaTrader 4, designed to help traders identify potential market trend shifts.
It divides price movement into three distinct phases—Accumulation (Red), Distribution (Blue), and Manipulation (Green)—using a color-coded box system. Unlike the traditional AMD ICT Indicator, this version introduces an additional "X" phase, which signals either trend continuation or a potential reversal.
Indicator Specifications
| Category | ICT - Smart Money - Liquidity |
| Platform | MetaTrader 4 |
| Skill Level | Advanced |
| Indicator Type | Continuation - Reversal |
| Timeframe | Multi-Timeframe |
| Trading Style | Scalping - Intraday Trading |
| Market | Crypto - Forex - Stocks - Commodities |
Indicator Overview
The Continuation or Reversal (X) phase is highlighted with a yellow box. Depending on user settings, this phase may appear at the start or end of a market cycle. The X zone serves as a critical reference for anticipating trend continuation or reversal based on price action and market momentum.
Bullish Trend Example
On a 1-hour EUR/USD chart, bullish momentum develops as price moves through Accumulation, Manipulation, and Distribution phases. When price interacts with the yellow X phase, buying pressure increases, signaling a strong upward move.
In this scenario, the cycle follows the AMDX pattern, where the continuation phase (X) appears first.
Bearish Trend Example
On a 30-minute Ethereum (ETH) chart, price initially consolidates within the Accumulation phase (Red), then moves upward briefly during the Manipulation phase (Green). The market then shifts downward during the Distribution phase (Blue).
The X phase confirms the bearish trend, providing a strategic reference point for initiating sell positions.
XAMD/AMDX Indicator Settings
Key customizable parameters include:
- Session Type – Choose between AMDX or XAMD
- Lookback Days – Set the period for trend evaluation based on historical data
Conclusion
The XAMD/AMDX Cycle Indicator for MetaTrader 4 is a robust tool for detecting liquidity-driven market trends. By breaking price action into Accumulation (Red), Distribution (Blue), and Manipulation (Green) phases, and adding a distinct Continuation/Reversal (X) phase in yellow, traders gain deeper insight into market dynamics.
This extra phase helps anticipate whether a trend is likely to continue or reverse, making it an essential tool for traders using Smart Money strategies.