Time Price SQ9 Degree MT5
- Indicatori
-
Kirill Borovskii
 My name is Kyril Borovsky and I provide professional services to teach methods of W.D.Ganna and give expert advice on trading in the forex market, which allow clients to achieve the planned financial goals. I also offer software based on years of experience and knowledge of the methods of the
 - Versione: 1.0
- Attivazioni: 5
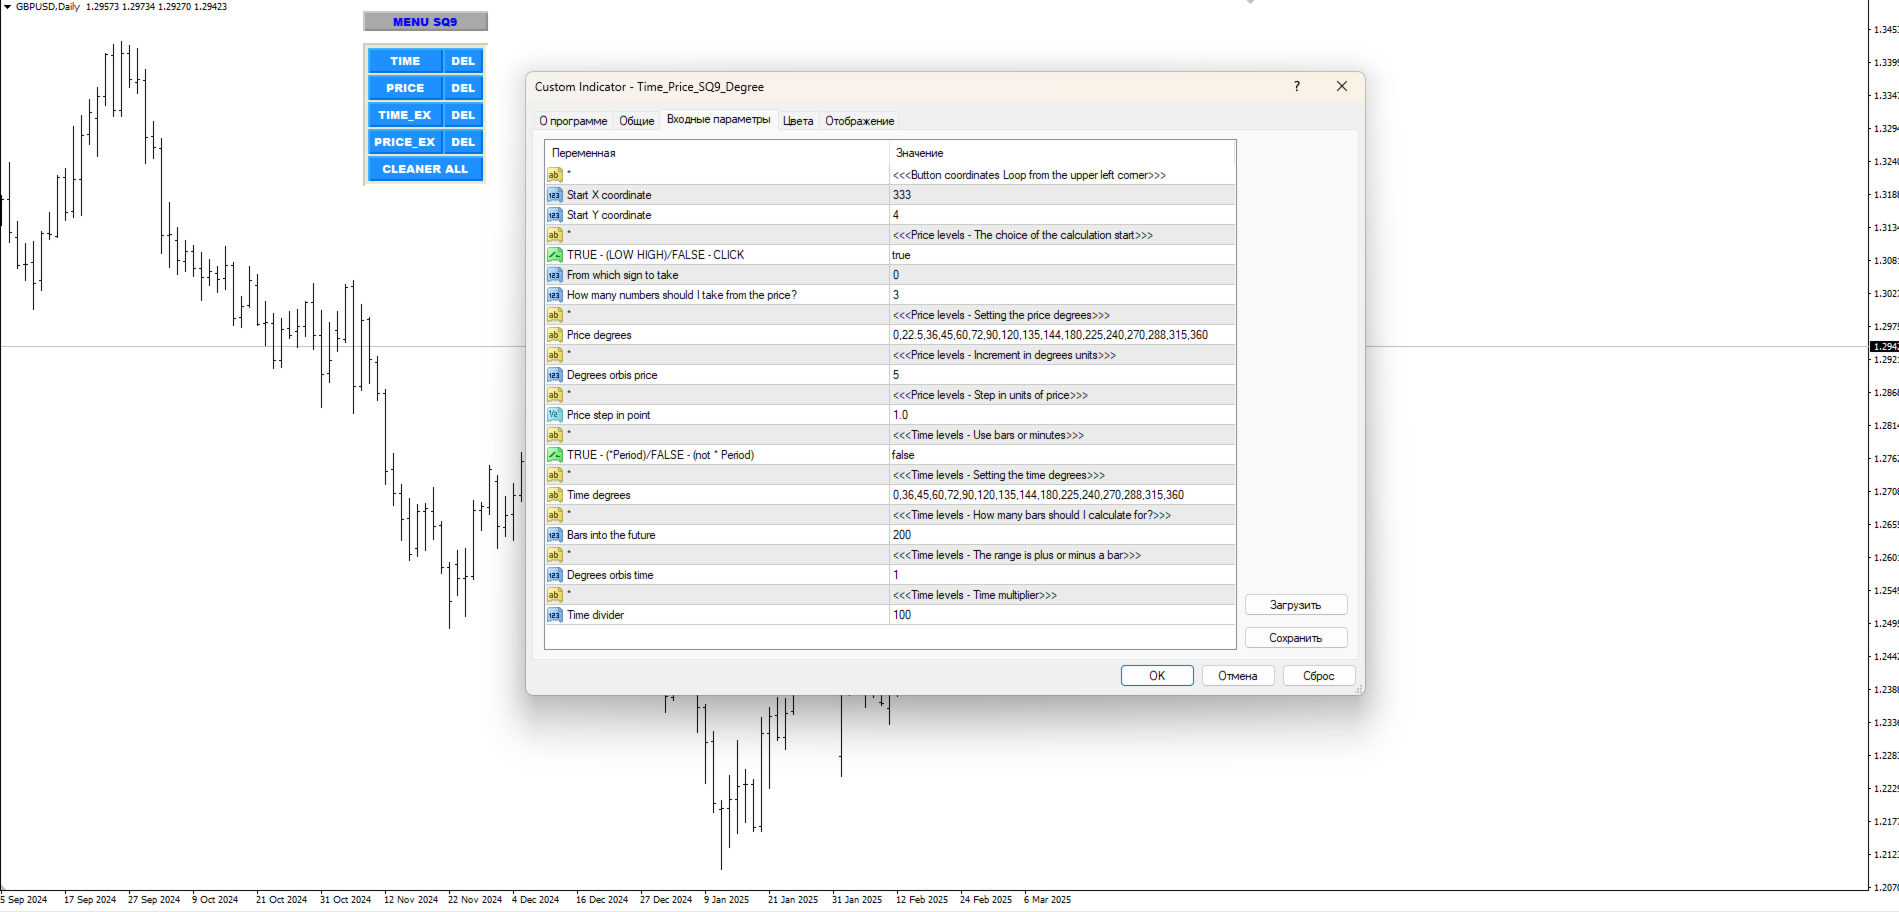
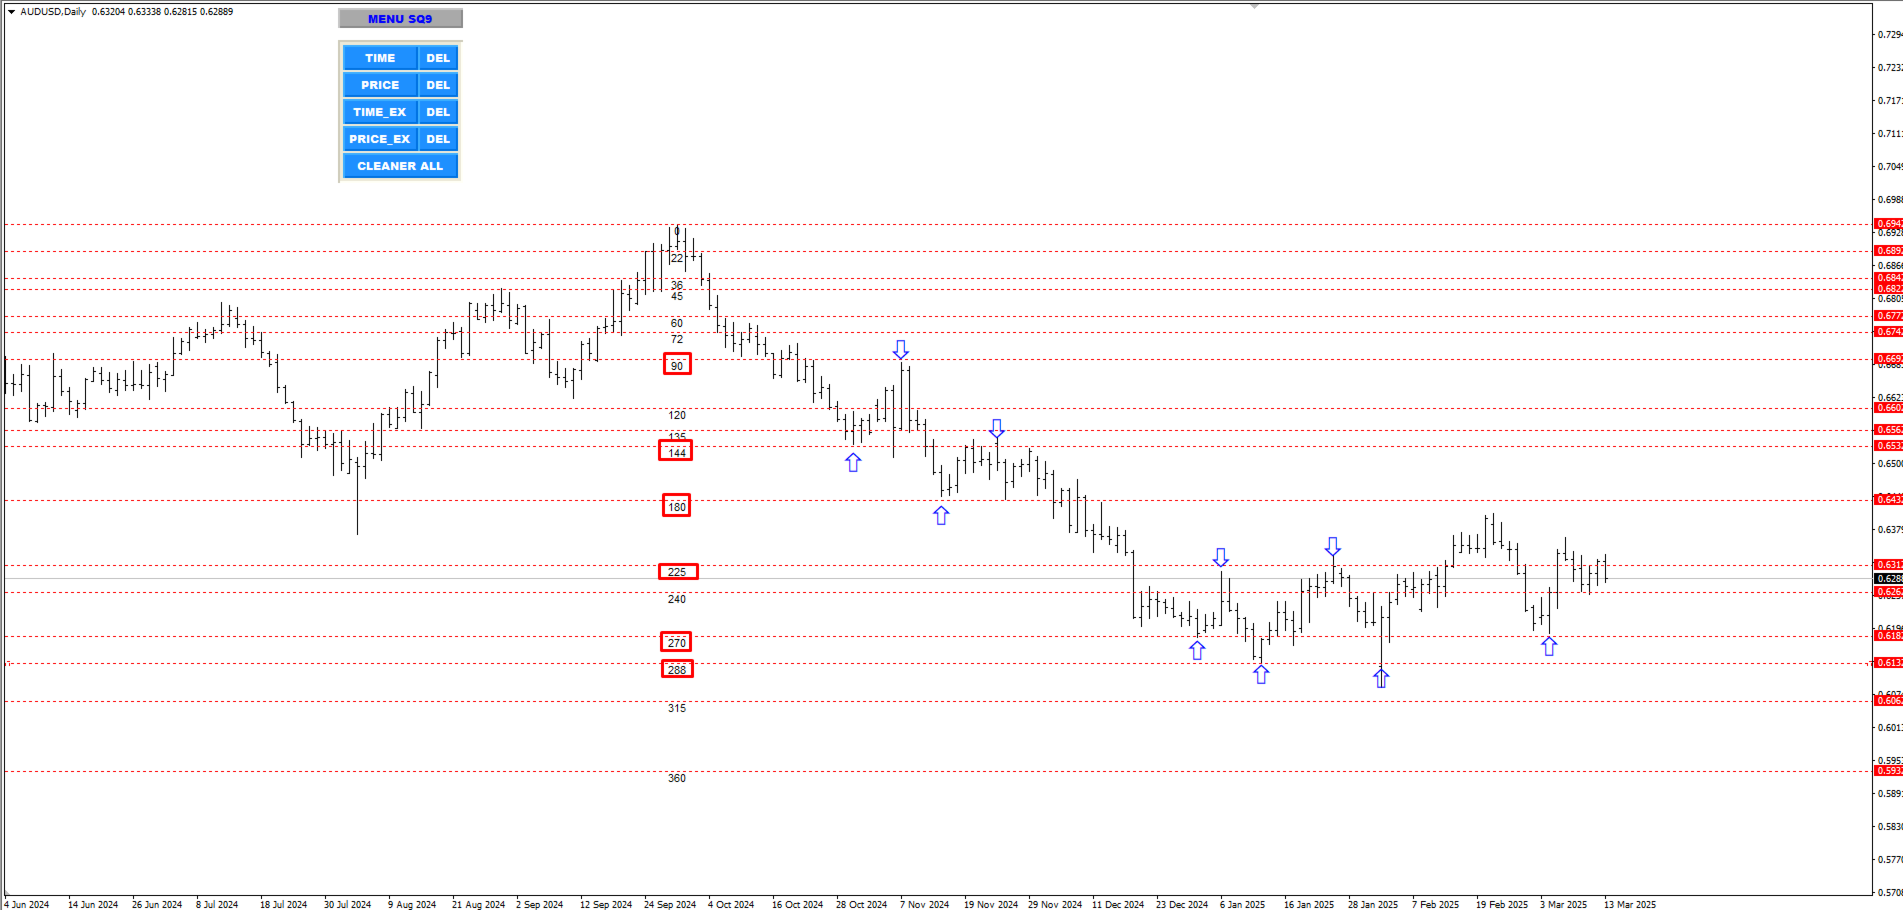
The Time_Price_SQ9_Degree indicator is based on the 9 Gann square. Using this indicator, you can identify strong time and price zones. The indicator displays the levels as a degree value. The degrees can be set in the settings.
After launching, the MENU button appears. If it is highlighted, it can be moved to any point on the graph, and after double-clicking on it, it stops being highlighted and menu buttons appear. To hide the menu, just double-click on the button, it will become highlighted again and the menu will disappear.
Using the indicator is quite simple. It is divided into two methods :
Local calculation.
Calculation in the form of a grid.
The first two buttons in the Time and Price menu are the local calculation. The second two buttons Time_Ex and Price_Ex are the grid calculation. The last Cleaner All button deletes all constructions.
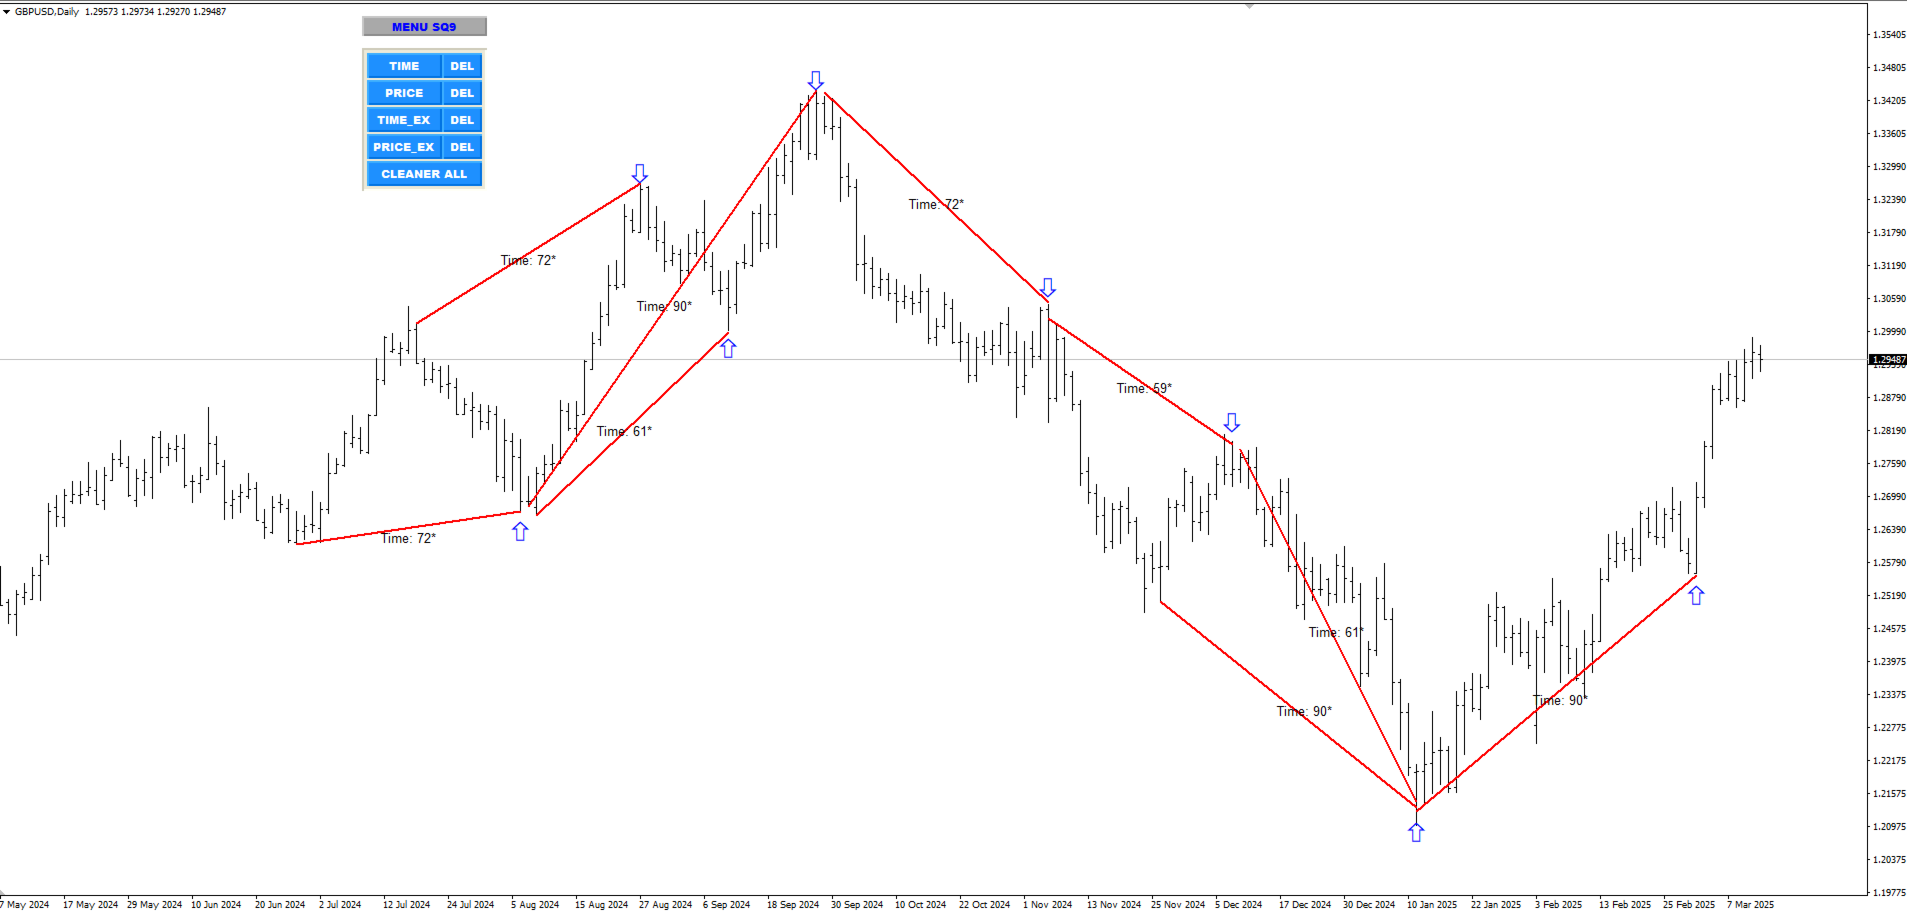
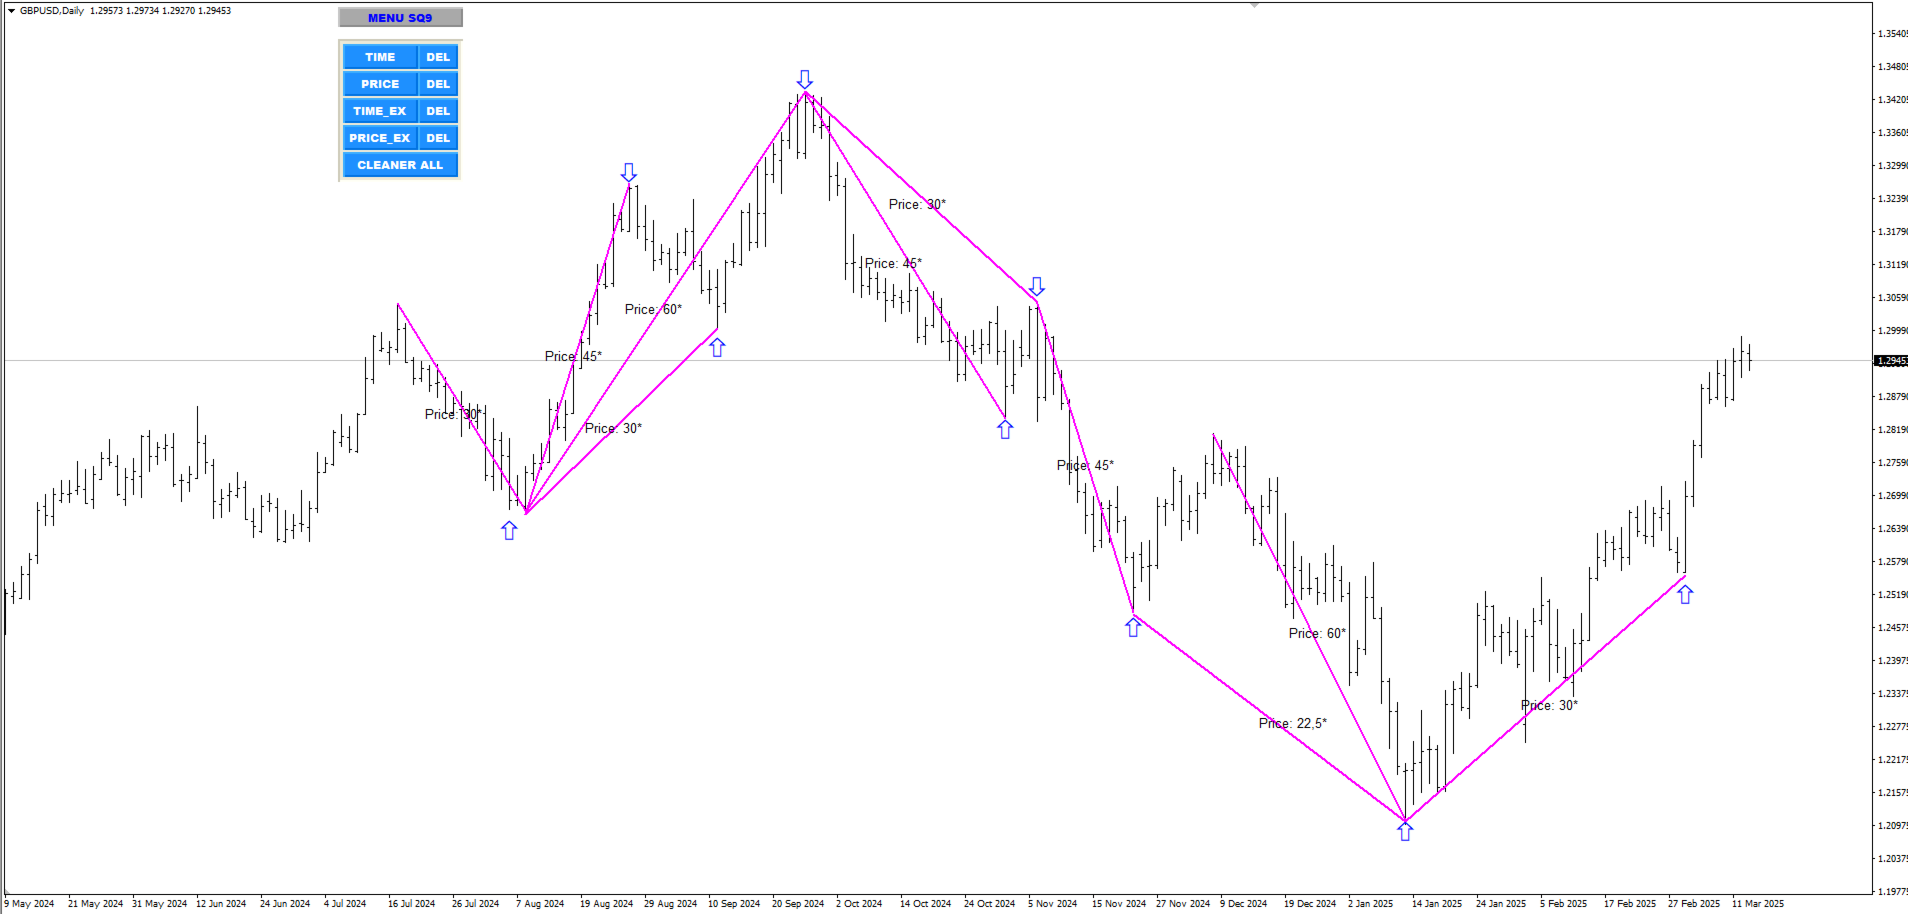
How to make a local calculation of price or time:
Press the Time or Price button (depending on what you are calculating), then click 1 time on the starting extreme from which you start the calculation and 2 times on the second extreme (if you are exploring history) or on the place in the future where you expect to stop. After the second click, a line will appear between these two points and it will be written how many degrees the price has passed in time or price (depending on what you calculated).
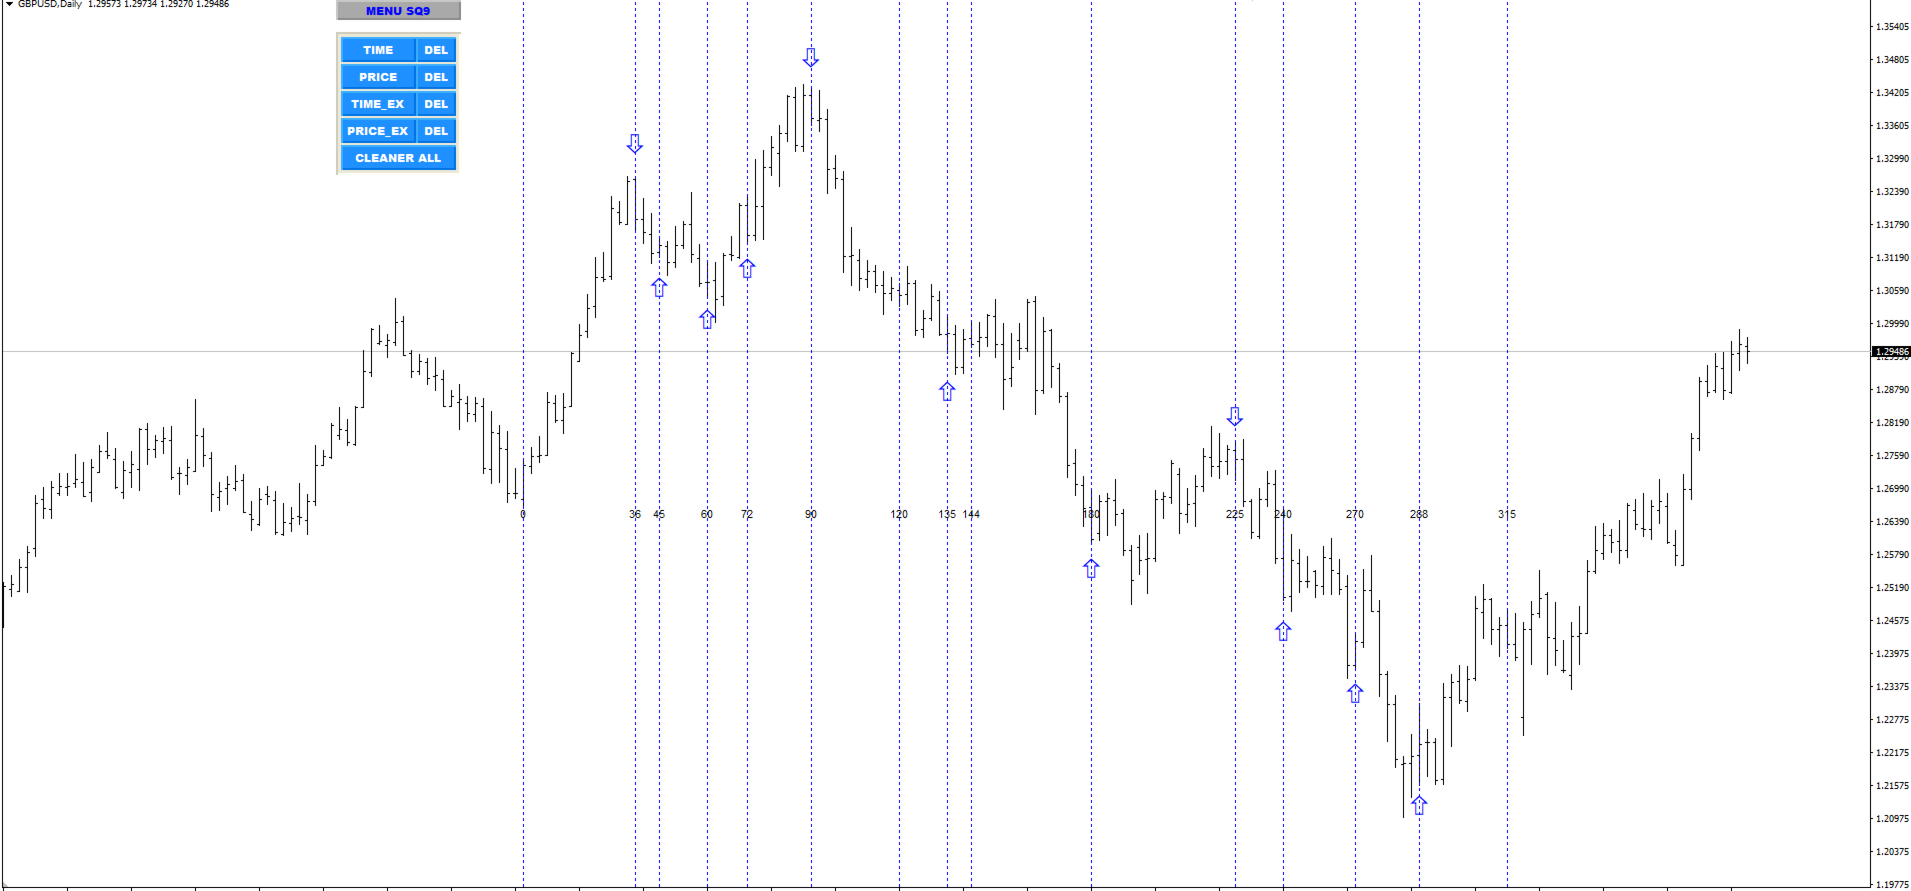
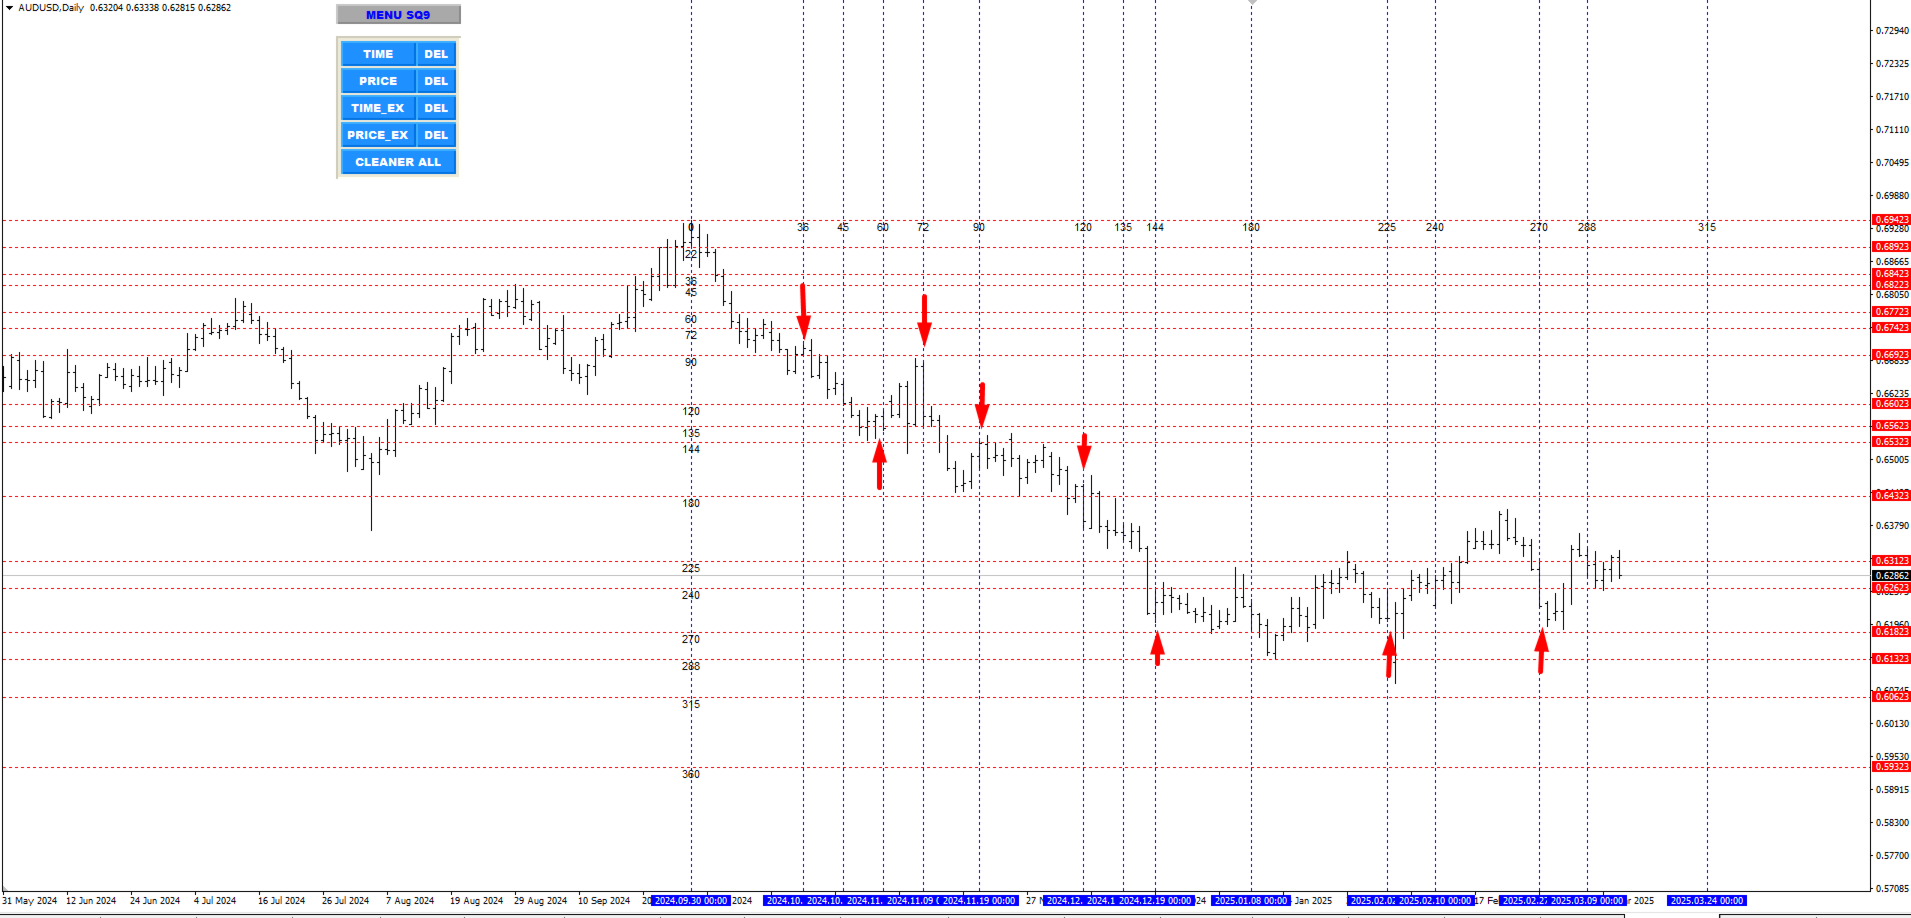
How to calculate the grid:
Press the Time_Ex or Price_Ex button (depending on what you expect) and click on the selected starting extreme 1 time. The levels will be drawn immediately.
All construction methods can be combined and used repeatedly on the work schedule.