NR4 and NR7 indicator MT4

Descrizione:
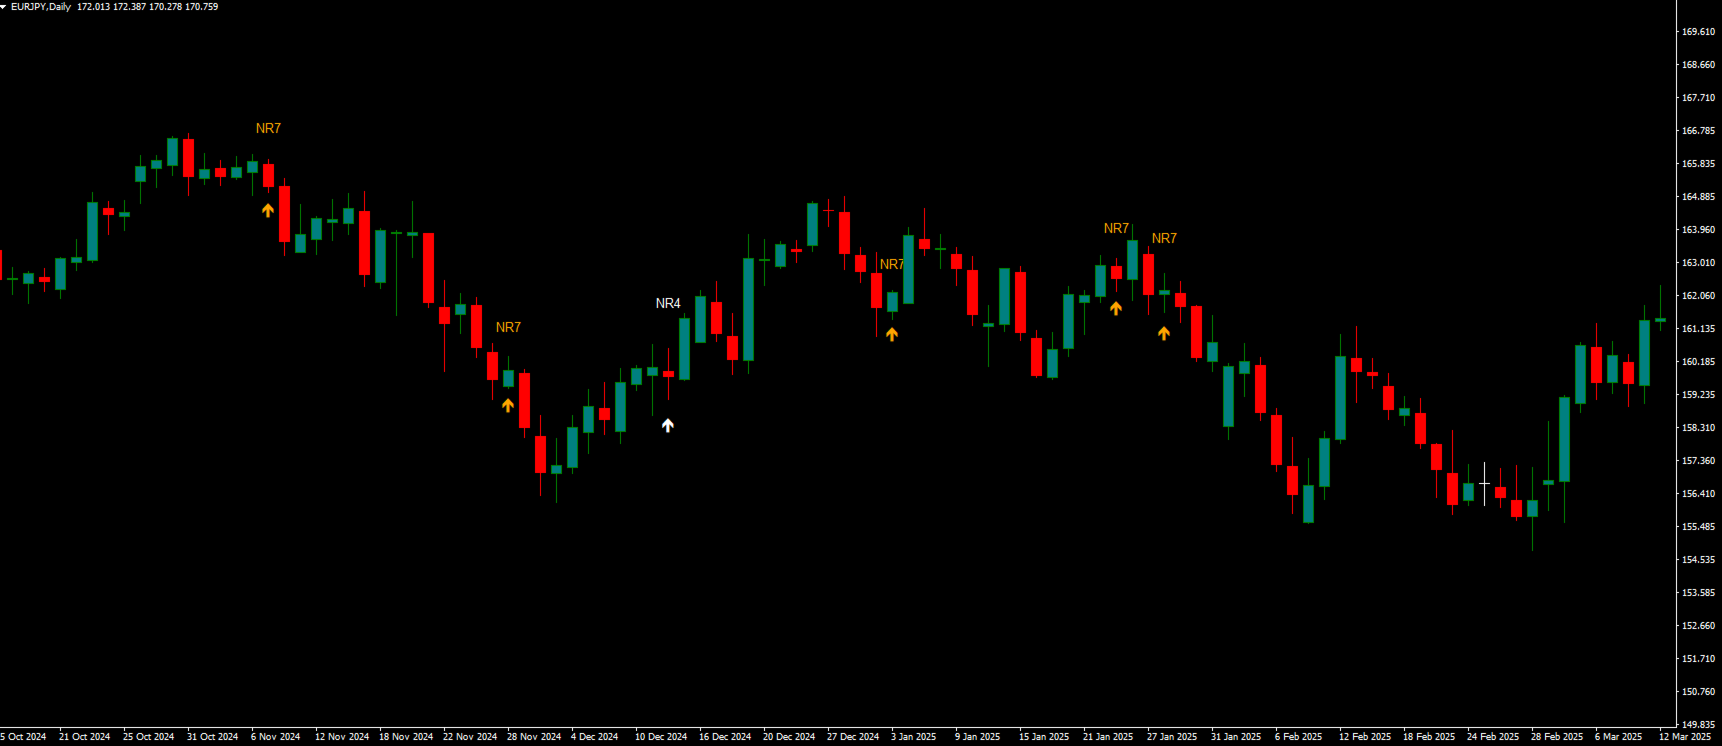
NR4 & NR7 Inside Bar Highlighter per MetaTrader 4 è un indicatore che rileva automaticamente pattern di compressione del prezzo basati sulla combinazione di NR4 o NR7 con un Inside Bar.

Come funziona:
Il pattern NR4 (Narrow Range 4) individua la candela con il range più stretto tra le ultime 4 barre, mentre NR7 considera le ultime 7. Quando questa condizione di range ridotto si verifica insieme a un Inside Bar (una candela completamente contenuta nella precedente), segnala spesso una fase di bassa volatilità che può precedere un breakout significativo. Questi segnali sono ampiamente utilizzati nelle strategie di trading orientate ai breakout.

Segnali evidenziati:
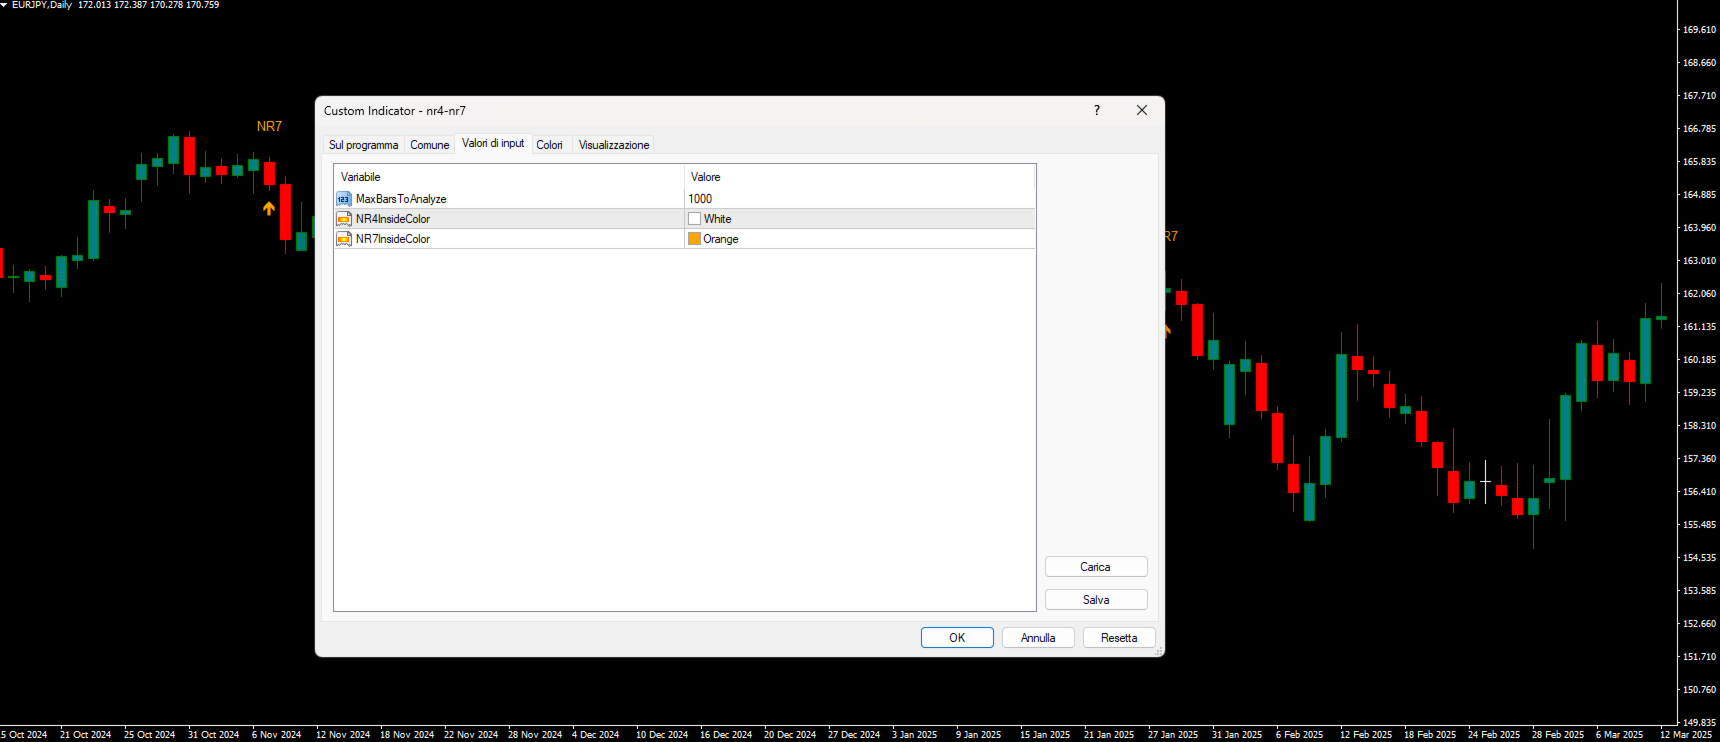
L’indicatore mette in risalto le candele rilevanti sul grafico con colori configurabili:

  • NR4 + Inside Bar: bianco

  • NR7 + Inside Bar: arancione

Ogni segnale è accompagnato da un’etichetta sul grafico per facilitarne l’identificazione visiva.

Integrazione & Avvisi:
Il sistema è pronto per essere integrato con avvisi visivi, email, suoni o logiche di trading personalizzate in MetaTrader 4. Supporta anche l’invio di notifiche push tramite gateway/bridge compatibili con MT4.

Compatibilità:
Funziona su tutti i simboli e timeframe disponibili in MetaTrader 4. Leggero ed efficiente, è progettato per non appesantire il terminale, mantenendo fluidità durante l’analisi.

Uso consigliato:
Strumento essenziale per trader focalizzati su setup di breakout e opportunità di espansione della volatilità, specialmente in fasi di compressione del prezzo pre-breakout.

Versione MetaTrader 5:
Disponibile anche la versione per MT5: https://www.mql5.com/en/market/product/145549


Prodotti consigliati
Free automatic Fibonacci is an indicator that automatically plots a Fibonacci retracement based on the number of bars you select on the BarsToScan setting in the indicator. The Fibonacci is automatically updated in real time as new highest and lowest values appears amongst the selected bars. You can select which level values to be displayed in the indicator settings. You can also select the color of the levels thus enabling the trader to be able to attach the indicator several times with differe
FREE
Extremum Reverse Bar
Yurij Izyumov
2.8 (5)
This indicator has been created for finding the probable reversal points of the symbol price. A small candlestick reversal pattern is used it its operation in conjunction with a filter of extremums. The indicator is not redrawn! If the extremum filter is disabled, the indicator shows all points that have a pattern. If the extremum filter is enabled, the condition works – if the history Previous bars 1 candles back contains higher candles and they are farther than the Previous bars 2 candle, such
FREE
The free version of the Hi Low Last Day MT4 indicator . The Hi Low Levels Last Day MT4 indicator shows the high and low of the last trading day . The ability to change the color of the lines is available . Try the full version of the Hi Low Last Day MT4 indicator , in which additional indicator features are available : Displaying the minimum and maximum of the second last day Displaying the minimum and maximum of the previous week Sound alert when crossing max . and min . levels Selecting an arb
FREE
PZ Trendlines
PZ TRADING SLU
4.27 (11)
Tired of plotting trendlines? The PZ TrendLines indicator applies a mechanical approach to the construction of trend lines for you! [ Installation Guide | Update Guide | Troubleshooting | FAQ | All Products ] It can draw up to 18 trendlines Trendlines can be optionally based on fractals Each line represents a breakout level Each trendline can be broken or rejected Configurable amount of lines Configurable colors Author Arturo López Pérez, private investor and speculator, software engineer and
FREE
Follow The Line
Oliver Gideon Amofa Appiah
3.94 (16)
FOLLOW THE LINE GET THE FULL VERSION HERE: https://www.mql5.com/en/market/product/36024 This indicator obeys the popular maxim that: "THE TREND IS YOUR FRIEND" It paints a GREEN line for BUY and also paints a RED line for SELL.  It gives alarms and alerts of all kinds. IT DOES NOT REPAINT and can be used for all currency pairs and timeframes. Yes, as easy and simple as that. Even a newbie can use it to make great and reliable trades. NB: For best results, get my other premium indicators for more
FREE
Basic Harmonic Pattern
Mehran Sepah Mansoor
4.56 (57)
Questo indicatore identifica i pattern armonici più popolari che predicono i punti di inversione del mercato. Questi modelli armonici sono formazioni di prezzo che si ripetono costantemente nel mercato forex e suggeriscono possibili movimenti di prezzo futuri / Versione MT5 gratuita Inoltre, questo indicatore è dotato di un segnale di entrata nel mercato e di vari take profit e stop loss. Va notato che, sebbene l'indicatore di pattern armonico possa fornire segnali di acquisto/vendita da solo,
FREE
Trend Filter Pro
Aleksandr Makarov
5 (1)
Special offer!   https://www.mql5.com/ru/users/bossik2810 Trend Filter Pro Trend filter indicator. Very good filter for your trading system, I recommend to use it together with - System Trend Pro   or  Quantum Entry PRO The indicator no repaint!!! Settings: Change the Period parameter for better filtering ( default is 90) Any questions? Need help?, I am always happy to help, write me in private messages or In Telegram: https://t.me/Trader35_Admin
FREE
Wicks UpDown Target GJ Wicks UpDown Target GJ is specialized in GJ forex pairs. Choppy movement up and down on the opening range every day.  Trading breakouts on London session and New York session is recommended. Guideline Entry Strategy Idea: Step 1 - Breakout Forming (Warning! Trade on London Session and New York Session) Step 2 - Breakout Starting (Take Action on your trading plan) Step 3 - Partial Close your order & set breakeven (no-risk) Step 4 - Target complete Step 5 - Don't trade
FREE
This indicator shows the latest untouched support and resistance as horizontal lines. The indicator can show support/resistance from higher timeframes. With this indicator you can e.g. easily see the support/resistance of the timeframes H4, D1 and W1 on a H1 chart, which can be a big advantage while time your entry on H1. This is the FREE version of the indicator: Support Resistance Multi Time Frame The free version works only on EURUSD and GBPUSD! Parameters referenceTF: the timeframe from whi
FREE
The Auto Fibonacci Indicator is a professional technical analysis tool that automatically draws Fibonacci retracement levels based on the most recent closed Daily (D1) or 4-Hour (H4) candle. These levels are widely used by traders to identify key support , resistance , and trend reversal zones . This version is designed for manual trading and supports a powerful trading strategy using Fibonacci levels combined with a 50-period EMA (Exponential Moving Average) , which you can easily add from MT4
FREE
TrendPlus
Sivakumar Subbaiya
4.07 (14)
Trend Plus   Trendplus  Indicator   Time Frame: Suitable for any time frame.  Purpose: Trend Prediction. Blue and red candle indicate the buy and sell call respectively. Buy: When the blue candle is formed buy call is initiated. close the buy trades when the next red candle will formed.   Sell: When the Red candle is formed Sell call is initiated. close the Sell trades when the next blue candle will formed.   Happy trade!!
FREE
PZ Three Drives
PZ TRADING SLU
5 (2)
This indicator finds Three Drives patterns. The Three Drives pattern is a 6-point reversal pattern characterised by a series of higher highs or lower lows that complete at a 127% or 161.8% Fibonacci extension. It signals that the market is exhausted and a reversal can happen. [ Installation Guide | Update Guide | Troubleshooting | FAQ | All Products ] Customizable pattern sizes Customizable colors and sizes Customizable breakout periods Customizable 1-2-3 and 0-A-B ratios It implements visual/s
FREE
SuperTrend Alert
Biswarup Banerjee
Super Trend Alert Indicator for MT4 is a powerful tool designed to help traders identify and follow market trends with precision. This indicator uses a proprietary algorithm to analyze price movements and provide clear trend signals, making it suitable for traders across all experience levels. You can find the MT5 version   here You can find the MT5 version here   SuperTrend Multicurrency Scanner MT5 Download the Expert Advisor    Supertrend Strategy EA MT5 Key features of the Super Trend Indic
FREE
MegaTrends
Sivakumar Subbaiya
1 (1)
Megatrends  Indicator   Time Frame: Suitable for any time frame.  Purpose: Trend Prediction. Blue and red color indicate the buy and sell call respectively. Buy: When the blue line is originating it is opened buy call. Sell: When the Red line is origination it is opened sell call Happy trade!! this indicator is suitable for all time frame, but our recommended time frame to use 1hour and 4 hours, suitable for any chart.
FREE
Support and resistance levels
Alexandr Bryzgalov
4.29 (17)
The indicator displays the probable ( Support and resistance ) levels. The indicator draws horizontal and trend levels of support and resistance. The indicator settings: Trends - the mode for displaying trend lines or horizontal lines of support and resistance Yes - display trend lines only No - display horizontal lines only UseResource - use the resources built into the indicator. Yes - use the ZigZag indicator from the resources of the product. No - use a custom ZigZag indicator. HistoryBar -
FREE
StrikePin
Mike Pascal Plavonil
1 (1)
The StrikePin indicator is a technical, analytical tool designed to identify trend reversals and find optimal market entries.  The StrikePin indicator is based on the pin bar pattern, which is the Price Action reversal pattern. An entry signal, in a trending market, can offer a very high-probability entry and a good risk to reward scenario. Be careful: the indicator is repainting since it is looking for highest high and lowest lows.  You should avoid to use it in experts but you can use it in
FREE
Virtual Targets
Hoang Van Dien
3.83 (6)
This indicator is very useful for day traders or short term traders. No need to calculate the number of pips manually, just look at the chart and you will see the Virtual Take Profit / Virtual Stop Loss target line and evaluate whether the entry point is feasible to reach the intended target or not. Enter the intended Take Profit / Stop Loss pips for your trade. The indicator will display Virtual Take Profit / Virtual Stop Loss lines for you to easily see if the target is feasible or not.
FREE
Swan Harmonic Pattern Indicator MT4 Download the Swan Harmonic Pattern Indicator, a harmonic pattern tool for MT4 designed to detect potential price reversal points and forecast future market movements. One of the standout features of this indicator is its ability to display two distinct variations: the Black Swan and White Swan patterns, applicable in both bullish and bearish market conditions. «Indicator Installation & User Guide» MT4 Indicator Installation  |  Swan Harmonic Pattern Indicator
FREE
FlatBreakout
Aleksei Vorontsov
FlatBreakout (Free Version) Flat Range Detector and Breakout Panel for MT4 — GBPUSD Only FlatBreakout is the free version of the professional FlatBreakoutPro indicator, specially designed for flat (range) detection and breakout signals on the GBPUSD pair only. Perfect for traders who want to experience the unique fractal logic of FlatBreakout and test breakout signals on a live market without limitations. Who Is This Product For? For traders who prefer to trade breakout of flat ranges (breakout,
FREE
Only One Trade a Day Indicator MetaTrader 4 The Only One Trade a Day indicator is developed for the MetaTrader 4 platform to generate buy and sell signals.This trading tool analyzes market behavior using two moving averages—one fast and one slow—and displays the generated signals as blue and red arrows directly on the chart. «Indicator Installation & User Guide» MT4 Indicator Installation  |  Only One Trade a Day Indicator MT5   | ALL Products By   TradingFinderLab  | Best MT4 Indicator:   Ref
FREE
I make this indicator to help you for setting effective stoploss and getting more signals from following trends. This indicator helps to tell the trends and sideway, when 2 lines stand above of blue cloud, it means uptrend. When 2 lines stand above red cloud, it means down trend, the other else, it means sideway market. For taking order, you have to wait the arrows. You also need to see the cloud position, if the cloud's res, you have to wait the yellow arrow for selling order. If the cloud's bl
FREE
Aroon Classic
Etsushi Ishizuka
Panoramica dell’indicatore Aroon Classic L’indicatore Aroon Classic è uno strumento tecnico che identifica quantitativamente l’insorgere e la persistenza dei trend su un grafico. Utilizza due linee — “Aroon Up” e “Aroon Down” — per mostrare la forza del trend e i punti di inversione nell’intervallo da 0 a 100. Un valore elevato di Aroon Up indica un forte trend rialzista, mentre un valore elevato di Aroon Down indica un forte trend ribassista. Caratteristiche principali Distinzione visiva tra in
FREE
BB stop bar
Aleksei Kostrov
A simple and effective trend indicator. It will be a good assistant when trading. A minimum of understandable settings. Put it on a chart and set it up Good to combine with other indicators. I will post another trend indicator soon. The combination of these two indicators gives good results. Works on all timeframes. Suitable for any couple. Experiment, adjust, observe. Filter by higher timeframes.
FREE
PZ Penta O MT4
PZ TRADING SLU
2.33 (3)
The Penta-O is a 6-point retracement harmonacci pattern which usually precedes big market movements. Penta-O patterns can expand and repaint quite a bit. To make things easier this indicator implements a twist: it waits for a donchian breakout in the right direction before signaling the trade. The end result is an otherwise repainting indicator with a very reliable trading signal. The donchian breakout period is entered as an input. [ Installation Guide | Update Guide | Troubleshooting | FAQ | A
FREE
WaPreviousCandleLevelsMT4
Wachinou Lionnel Pyrrhus Sovi Guidi
!!!The free version works only on "EURUSD"!!! WaPreviousCandleLevels MT4 shows the previous candle levels, it shows the previous candle Open High Low Close levels (OHLC Levels) in different time frame. It's designed to help the trader to analyse the market and pay attention to the previous candle levels in different time frame.  We all know that the OHLC Levels in Monthly, Weekly and Daily are really strong and must of the time, the price strongly reacts at those levels. In the technical analys
FREE
AIS MT4 INDICATOR 5 ALL INCLLUSIVE SET !!!!!!!!!!!!!!!!!!!!!!!!!!!!!!!!!!!!!!!!!!!!!!!!!!!!!!!!!!! ! ! ATTENTION ! LIMITATION OF FREE OFFER PERIOD IS IMPLICIT ! !   ! CONFIRMATION 2024-08-20 20:00                           ! ! !!!!!!!!!!!!!!!!!!!!!!!!!!!!!!!!!!!!!!!!!!!!!!!!!!!!!!!!!!! GUIDE CHAPTER 1 IMPORTANT INFORMATION <1> THIS INDICATOR IS ONE OF THE SERIES OF NEW AIS INDICATORS AIS MT4 INDICATOR 1 =ADVANCED CLASSIC= AIS MT4 INDICATOR 2 =MULTIFRAMES= AIS MT4 INDICATOR 3 =LINES= AIS M
FREE
Pivot Point Fibo RSJ è un indicatore che traccia le linee di supporto e resistenza del giorno utilizzando i tassi di Fibonacci. Questo spettacolare indicatore crea fino a 7 livelli di supporto e resistenza tramite Pivot Point utilizzando i tassi di Fibonacci. È fantastico come i prezzi rispettino ogni livello di questo supporto e resistenza, dove è possibile percepire possibili punti di entrata/uscita di un'operazione. Caratteristiche Fino a 7 livelli di supporto e 7 livelli di resistenza Im
FREE
Judas Swing with Confirmation Indices ICT MT4 The Judas Indicator with Confirmation is specifically designed to detect deceptive price movements on the chart. This tool helps traders recognize the true market trend by filtering out fake breakouts, reducing the risk of falling for false signals. By confirming the primary trend within a 1-minute timeframe , it minimizes the chances of traders making incorrect decisions. «Indicator Installation & User Guide» MT4 Indicator Installation  |  Judas Sw
FREE
Anti Butterfly Harmonic Pattern Indicator MT4 The Anti Butterfly Harmonic Pattern Indicator accurately identifies the key pivot points X, A, B, C, and D and automatically plots the harmonic structure on the chart. Bullish patterns appear in red, and bearish patterns in blue, providing clear insights into market trends. «Indicator Installation & User Guide» MT4 Indicator Installation  |  Anti Butterfly Harmonic Pattern Indicator MT5  | ALL Products By  TradingFinderLab  | Best MT4 Indicator:  Ref
FREE
This indicator scans for you up to 30 trading instruments and up to 8 timeframes for occurrences of the high probability reversal patterns: Double Tops/Bottoms with fake breakouts . Please read also the blog post " Professional Trading With Double Tops/Bottoms And Divergences! " which explains the concepts behind the ULTIMATE Double Top/Bottom indicator and how you can use a professional top-down approach. This FREE Version of the Scanner scans only EURUSD and GBPUSD. The full version of the sca
FREE
Gli utenti di questo prodotto hanno anche acquistato
Gann Made Easy
Oleg Rodin
4.81 (134)
Gann Made Easy è un sistema di trading Forex professionale e facile da usare che si basa sui migliori principi del trading utilizzando la teoria di mr. WD Gann. L'indicatore fornisce segnali ACQUISTA e VENDI accurati, inclusi i livelli di Stop Loss e Take Profit. Puoi fare trading anche in movimento utilizzando le notifiche PUSH. Vi prego di contattarmi dopo l'acquisto! Condividerò i miei consigli di trading con te e fantastici indicatori bonus gratuitamente! Probabilmente hai già sentito parlar
Trend indicator AI
Ramil Minniakhmetov
5 (33)
Trend Ai indicator è un ottimo strumento che migliorerà l'analisi di mercato di un trader combinando l'identificazione della tendenza con punti di ingresso utilizzabili e avvisi di inversione. Questo indicatore consente agli utenti di navigare nelle complessità del mercato forex con fiducia e precisione Oltre ai segnali primari, l'indicatore Ai di tendenza identifica i punti di ingresso secondari che si presentano durante i pullback o i ritracciamenti, consentendo ai trader di capitalizzare le
M1 Sniper
Oleg Rodin
5 (11)
M1 SNIPER è un sistema di indicatori di trading facile da usare. Si tratta di un indicatore a freccia progettato per l'intervallo temporale M1. L'indicatore può essere utilizzato come sistema autonomo per lo scalping sull'intervallo temporale M1 e come parte del tuo sistema di trading esistente. Sebbene questo sistema di trading sia stato progettato specificamente per il trading sull'intervallo temporale M1, può comunque essere utilizzato anche con altri intervalli temporali. Inizialmente ho pro
Day Trader Master è un sistema di trading completo per i day trader. Le systeme se compose de due indicatori. Un indicar est un signal fléché pour acheter et vendre. C'est l'indicateur de fleche que vous obtenez. Je vous fournirai le deuxième indicaur gratuitement. Le deuxième indicaur è un indicaur de tendance spécialement conçu pour être utilisé conjointement avec ces flèches. GLI INDICATORI NON SI RIPETONO E NON RITARDANO! Usare questo sistema è molto semplice. Devi solo seguire i segnali del
Attualmente 20% di sconto! La soluzione migliore per ogni principiante o trader esperto! Questo software per cruscotti funziona su 28 coppie di valute. Si basa su 2 dei nostri indicatori principali (Advanced Currency Strength 28 e Advanced Currency Impulse). Offre un'ottima panoramica dell'intero mercato Forex. Mostra i valori di forza delle valute avanzate, la velocità di movimento delle valute e i segnali per 28 coppie Forex in tutti i (9) timeframe. Immaginate come migliorerà il vostro tra
Quantum Breakout Indicator PRO
Bogdan Ion Puscasu
4.96 (25)
Presentazione       Quantum Breakout PRO   , l'innovativo indicatore MQL5 che sta trasformando il modo in cui scambi le zone di breakout! Sviluppato da un team di trader esperti con un'esperienza di trading di oltre 13 anni,   Quantum Breakout PRO   è progettato per spingere il tuo viaggio di trading a nuovi livelli con la sua strategia innovativa e dinamica della zona di breakout. Quantum Breakout Indicator ti fornirà frecce di segnalazione sulle zone di breakout con 5 zone target di profitt
Trend Screener
STE S.S.COMPANY
4.79 (95)
Indicatore di tendenza, soluzione unica rivoluzionaria per il trading di tendenze e il filtraggio con tutte le importanti funzionalità di tendenza integrate in un unico strumento! È un indicatore multi-timeframe e multi-valuta al 100% non ridipingibile che può essere utilizzato su tutti i simboli/strumenti: forex, materie prime, criptovalute, indici e azioni. OFFERTA A TEMPO LIMITATO: l'indicatore di screening di supporto e resistenza è disponibile a soli 50$ e a vita. (Prezzo originale 250$) (o
PTS Precision Index Oscillator V2
PrecisionTradingSystems
5 (1)
L'Oscillatore dell'Indice di Precisione (Pi-Osc) di Roger Medcalf di Precision Trading Systems La Versione 2 è stata attentamente rielaborata per essere estremamente veloce nel caricarsi sul tuo grafico e sono state apportate alcune altre migliorie tecniche per migliorare l'esperienza. Il Pi-Osc è stato creato per fornire segnali di sincronizzazione del trading accurati progettati per individuare punti di esaurimento estremi, i punti ai quali i mercati vengono costretti a recarsi solo per eli
Easy Breakout
Mohamed Hassan
5 (13)
Summer Sale: 50% OFF!!! Promotion is valid until 08 August 2025!  After your purchase, feel free to contact me for more details on how to receive a bonus indicator called VFI, which pairs perfectly with Easy Breakout for enhanced confluence!   Easy Breakout is a powerful price action trading system built on one of the most popular and widely trusted strategies among traders: the Breakout strategy ! This indicator delivers crystal-clear Buy and Sell signals based on breakouts from key support
Gold Stuff
Vasiliy Strukov
4.85 (262)
Gold Stuff è un indicatore di tendenza progettato specificamente per l'oro e può essere utilizzato anche su qualsiasi strumento finanziario. L'indicatore non ridisegna e non è in ritardo. Periodo consigliato H1. Su di esso l'indicatore funziona in modo completamente automatico Expert Advisor EA Gold Stuff. Lo trovi nel mio profilo. I risultati in tempo reale possono essere visualizzati qui.  Puoi ottenere una copia gratuita del nostro indicatore Strong Support e Trend Scanner, per favore scriv
Scalper Inside PRO
Alexey Minkov
4.69 (68)
An exclusive indicator that utilizes an innovative algorithm to swiftly and accurately determine the market trend. The indicator automatically calculates opening, closing, and profit levels, providing detailed trading statistics. With these features, you can choose the most appropriate trading instrument for the current market conditions. Additionally, you can easily integrate your own arrow indicators into Scalper Inside Pro to quickly evaluate their statistics and profitability. Scalper Inside
Volatility Trend System - un sistema di trading che fornisce segnali per le voci. Il sistema di volatilità fornisce segnali lineari e puntuali nella direzione del trend, nonché segnali per uscirne, senza ridisegnare e ritardi. L'indicatore di tendenza monitora la direzione della tendenza a medio termine, mostra la direzione e il suo cambiamento. L'indicatore di segnale si basa sui cambiamenti della volatilità e mostra gli ingressi nel mercato. L'indicatore è dotato di diversi tipi di avvisi. Pu
IQ Gold Gann Levels a non-repainting, precision tool designed exclusively for XAUUSD/Gold intraday trading. It uses W.D. Gann’s square root method to plot real-time support and resistance levels, helping traders spot high-probability entries with confidence and clarity. William Delbert Gann (W.D. Gann) was an exceptional market analyst, whose trading technique was based on a complex blend of mathematics, geometry, astrology, and ancient mathematics which proved to be extremely accurate. Download
Algo Pumping MT4
Ihor Otkydach
4.93 (14)
PUMPING STATION – La tua strategia personale "all inclusive" Ti presentiamo PUMPING STATION — un indicatore Forex rivoluzionario che trasformerà il tuo modo di fare trading in un’esperienza efficace ed entusiasmante. Non si tratta solo di un assistente, ma di un vero e proprio sistema di trading completo con potenti algoritmi che ti aiuteranno a operare in modo più stabile. Acquistando questo prodotto, riceverai GRATUITAMENTE: File di configurazione esclusivi: per un'impostazione automatica e pr
PipRush è un indicatore tecnico che identifica opportunità di trading strutturate utilizzando logiche statistiche. Disegna automaticamente configurazioni di trade con livelli predefiniti di ingresso, stop loss e take profit. L'indicatore è pensato per i trader che desiderano ridurre l’analisi manuale e applicare un approccio coerente e basato sui dati. Caratteristiche principali Traccia automaticamente la configurazione completa del trade: ingresso, stop loss, take profit e rapporto rischio/rend
Grabber System
Ihor Otkydach
5 (1)
Ti presento un eccellente indicatore tecnico: Grabber, che funziona come una strategia di trading "tutto incluso", pronta all’uso. In un solo codice sono integrati strumenti potenti per l’analisi tecnica del mercato, segnali di trading (frecce), funzioni di allerta e notifiche push. Ogni acquirente di questo indicatore riceve anche gratuitamente: L’utility Grabber: per la gestione automatica degli ordini aperti Video tutorial passo dopo passo: per imparare a installare, configurare e utilizzare
PZ Mean Reversion MT4
PZ TRADING SLU
3 (4)
Indicatore unico che implementa un approccio professionale e quantitativo al trading di reversione. Sfrutta il fatto che il prezzo devia e ritorna alla media in modo prevedibile e misurabile, il che consente regole di entrata e uscita chiare che superano di gran lunga le strategie di trading non quantitative. [ Installation Guide | Update Guide | Troubleshooting | FAQ | All Products ] Segnali di trading chiari Incredibilmente facile da scambiare Colori e dimensioni personalizzabili Implementa l
Predictive Levels
Satya Prakash Mishra
Market predictive price levels are key technical analysis tools is my finest invention through mathematics to predict automatically next price is where to reach after break any levels. A unique name quality it automatically calculate price range its my own invention according price value to predict what's is next price came than after it not fixed levels like Fibonacci or pivots Its Naveen's Predictive Levels .used to forecast where an asset's price might find support (stop falling) or resistanc
Advanced Supply Demand
Bernhard Schweigert
4.91 (295)
CURRENTLY 26% OFF !! Best Solution for any Newbie or Expert Trader! This indicator is a unique, high quality and affordable trading tool because we have incorporated a number of proprietary features and a new formula. With this update, you will be able to show double timeframe zones. You will not only be able to show a higher TF but to show both, the chart TF, PLUS the higher TF: SHOWING NESTED ZONES. All Supply Demand traders will love it. :) Important Information Revealed Maximize the potentia
FX Power MT4 NG
Daniel Stein
4.94 (18)
FX Power: Analizza la Forza delle Valute per Decisioni di Trading Più Intelligenti Panoramica FX Power è lo strumento essenziale per comprendere la reale forza delle principali valute e dell'oro in qualsiasi condizione di mercato. Identificando le valute forti da comprare e quelle deboli da vendere, FX Power semplifica le decisioni di trading e rivela opportunità ad alta probabilità. Che tu segua le tendenze o anticipi inversioni utilizzando valori estremi di Delta, questo strumento si adatta
Cycle Maestro
Stefano Frisetti
1 (1)
FARE TRADING con CYCLEMAESTRO Il segnale e' semplice ed immediato: appena si colora lo sfondo di un'area verde o rosso significa che e' attivo un segnale di TRADING: VERDE = BUY e ROSSO = SELL. Il TRADER puo' aprire il TRADE e seguire le prossime indicazioni.  NOTA: CYCLEMAESTRO e' distribuito solo su questo sito web, non ci sono altri distributori. La versione DEMO e' solo per referenza e non e' supportata. La versione definitiva e' supportata ed e' perfettamebte funzionante. CYCLEMAESTRO , il
2 copies left at $65, next price is $120 Scalper System is a user-friendly indicator designed to detect market consolidation zones and anticipate breakout movements. Optimized for the M1 or M15 timeframe, it performs best on highly volatile assets like gold (XAUUSD). Although originally designed for the M1 or M15 timeframe, this system performs well across all timeframes thanks to its robust, price action-based strategy. You can visually backtest the indicator to evaluate the accuracy of its si
Daily Candle Predictor è un indicatore che prevede il prezzo di chiusura di una candela. L'indicatore è destinato principalmente all'uso sui grafici D1. Questo indicatore è adatto sia per il trading forex tradizionale che per il trading di opzioni binarie. L'indicatore può essere utilizzato come sistema di trading autonomo o può fungere da aggiunta al sistema di trading esistente. Questo indicatore analizza la candela corrente, calcolando alcuni fattori di forza all'interno del corpo della cande
M1 Signal Scanner MT4
Reza Aghajanpour
5 (2)
**   All Symbols   x   All Time frames   scan just by pressing scanner button ** After 18 years of experience in the markets and programming, Winner indicator is ready. I would like to share with you! ***  Contact me to send you " Trend Finder indicator " free, instruction and add you in "M1 Signal Scanner group" for sharing or seeing experiences with other users. Introduction: M1 Signal Scanner   is the indicator designed scalping M1 time frame to detect Small trend switching in the direction
PRO Renko System
Oleg Rodin
5 (27)
PRO Renko System è un sistema di trading altamente accurato appositamente progettato per il trading di grafici RENKO. Questo è un sistema universale che può essere applicato a vari strumenti di trading. Il sistema neutralizza efficacemente il cosiddetto rumore di mercato che consente di accedere a segnali di inversione accurati. L'indicatore è molto facile da usare e ha un solo parametro responsabile della generazione del segnale. Puoi facilmente adattare lo strumento a qualsiasi strumento di
Upper and Lower Reversal - Sistema per la previsione anticipata dei momenti di inversione. Ti consente di trovare punti di svolta dei prezzi ai confini dei canali di movimento dei prezzi superiore e inferiore. L'indicatore non si ricolorerà né cambierà mai la posizione delle frecce del segnale. Le frecce rosse sono un segnale di acquisto, le frecce blu sono un segnale di vendita. Si adatta a qualsiasi intervallo temporale e strumento di trading L'indicatore non si ridisegna, funziona solo quan
PZ Harmonacci Patterns
PZ TRADING SLU
3.17 (6)
Trade smarter, not harder: Empower your trading with Harmonacci Patterns This is arguably the most complete harmonic price formation auto-recognition indicator you can find for the MetaTrader Platform. It detects 19 different patterns, takes fibonacci projections as seriously as you do, displays the Potential Reversal Zone (PRZ) and finds suitable stop-loss and take-profit levels. [ Installation Guide | Update Guide | Troubleshooting | FAQ | All Products ] It detects 19 different harmonic pric
Trading System Double Trend è un sistema di trading indipendente composto da diversi indicatori. Determina la direzione della tendenza generale e fornisce segnali nella direzione del movimento dei prezzi. Può essere utilizzato per lo scalping, il trading intraday o intraweek. Possibilità Funziona su qualsiasi intervallo temporale e strumento di trading (Forex, criptovalute, metalli, azioni, indici). Semplice lettura visiva delle informazioni senza caricare un grafico L'indicatore non ridisegn
Scientific trade
Aleksey Ivanov
5 (1)
An extremely convenient indicator that truly makes the process of making money on the exchange easy. It is based on the scientifically rigorous theory of the market developed by the author, the beginning of which is presented here .                The full algorithm of this indicator operation is presented in the article .               The indicator calculates the most probable price movement trajectory and displays it on the chart. Based on the predicted price movement trajectory
Currency Strength Wizard è un indicatore molto potente che ti fornisce una soluzione all-in-one per un trading di successo. L'indicatore calcola la potenza di questa o quella coppia forex utilizzando i dati di tutte le valute su più intervalli di tempo. Questi dati sono rappresentati in una forma di indice di valuta facile da usare e linee elettriche di valuta che puoi utilizzare per vedere il potere di questa o quella valuta. Tutto ciò di cui hai bisogno è collegare l'indicatore al grafico che
Altri dall’autore
Questo indicatore calcola i momenti di rientro del prezzo dopo che una candela ha attraversato esternamente le Bollinger Bands , combinando tale segnale con una conferma tramite RSI per ridurre i falsi positivi. Viene rilevato un segnale di Buy ReEntry quando il prezzo era uscito sotto la banda inferiore e ritorna dentro, con la conferma opzionale che l’RSI abbia appena lasciato una condizione di oversold . Un segnale di Sell ReEntry viene generato quando il prezzo era uscito sopra la banda supe
FREE
False Breakout Detector è un indicatore progettato per individuare situazioni in cui il prezzo supera un livello di supporto o resistenza recente e successivamente rientra rapidamente nel range. Il rilevamento di questi falsi breakout può essere utile nell’ambito di analisi tecnica discrezionale o per lo sviluppo di strategie di tipo contrarian. Funzionalità principali: Rilevamento automatico di falsi breakout su massimi e minimi delle ultime N barre Visualizzazione grafica tramite frecce, line
FREE
Descrizione: NR4 & NR7 Inside Bar Highlighter è un indicatore che rileva automaticamente i pattern di compressione del prezzo, basati sulla combinazione di NR4 o NR7 con una candela Inside Bar. Il pattern NR4 (Narrow Range 4) identifica la candela con il range più stretto delle ultime 4 candele, mentre NR7 (Narrow Range 7) considera le ultime 7. Quando queste condizioni coincidono con un’Inside Bar (una candela completamente contenuta all’interno della precedente), si evidenziano situazioni di c
FREE
Panoramica Questo indicatore monitora tre tipi di supporti e resistenze basati sui periodi precedenti: Daily (massimo e minimo di ieri), Weekly e Monthly . Fornisce una mappa visiva dei livelli chiave dove il prezzo tende a reagire, utile sia per individuare potenziali inversioni sia per catturare breakout significativi. Cosa fa Disegna automaticamente i livelli di: Massimo/Minimo di ieri (Daily) Massimo/Minimo della settimana precedente (Weekly) Massimo/Minimo del mese precedente (Monthly) Ogni
FREE
Opening range
Mattia Impicciatore
Descrizione per MQL5 Market Opening‑Range Sessions (GMT‑Aware) è un indicatore leggero che disegna in tempo reale l’opening‑range (high, low e box colorato) delle principali finestre di mercato – Sydney, Tokyo, London, New York – con rilevazione automatica del fuso orario del server. Ideale per breakout, mean‑reversion e analisi di volatilità su qualunque strumento e timeframe. Caratteristiche principali Auto‑Time‑Zone – il calcolo usa l’offset del server, perciò gli orari delle sessioni risulta
FREE
Descrizione (MT4) Questo indicatore individua i momenti di reentry del prezzo dopo che una candela ha superato esternamente le Bollinger Bands, combinando quel segnale con una conferma RSI opzionale per ridurre i falsi positivi. Un segnale Buy ReEntry viene generato quando il prezzo era sceso sotto la banda inferiore e poi rientra all’interno, con l’eventuale conferma che l’RSI è appena uscito da una condizione di oversold. Un segnale Sell ReEntry si crea quando il prezzo era salito sopra la ba
FREE
Simple Range Filter
Mattia Impicciatore
Simple Range Filter è un indicatore progettato per evidenziare le candele caratterizzate da elevata o bassa volatilità . Calcola il range medio (High - Low) su un numero definito di candele e adatta automaticamente le soglie in base al contesto di mercato. Funzionalità principali: Calcolo dinamico del range medio Evidenziazione visiva delle barre con range superiore o inferiore alla media Parametri configurabili per colori e periodo di calcolo Aggiornamento in tempo reale (tick-by-tick) Applica
FREE
False Breakout MT4
Mattia Impicciatore
False Breakout MT4 è un indicatore pensato per individuare i casi in cui il prezzo rompe temporaneamente un livello recente di supporto o resistenza per poi rientrare rapidamente nel range precedente. Questi falsi breakout sono utili per analisi discrezionali o strategie contrarian, offrendo segnali visivi chiari senza fare previsioni automatiche. Caratteristiche principali: Rilevazione automatica dei falsi breakout su massimi e minimi recenti (es. daily estesi su 2 giorni). Rappresentazione vis
FREE
L’indicatore “ATR Volatility Histogram” misura in modo visivo i momenti di alta e bassa volatilità confrontando due ATR con periodi differenti: rapido e lento. La differenza tra il Fast ATR e il Slow ATR viene mostrata come istogramma: in verde i momenti in cui la volatilità sta accelerando (HighVol, diff ≥ 0), in rosso quelli in cui sta diminuendo (LowVol, diff < 0). È uno strumento di conferma potente per inversioni o breakout: un breakout supportato da un picco verde conferma forza nel movime
FREE
Market Correlation Panoramica Market Correlation è un indicatore avanzato che calcola in tempo reale il coefficiente di correlazione di Pearson tra più strumenti finanziari direttamente sul grafico. Una matrice fluttuante mette in evidenza, con codifica colore, la forza e la direzione della relazione tra asset diversi, da valute e indici a materie prime. Perché usarlo Evitare sovraesposizioni su strumenti che si muovono insieme Individuare opportunità di diversificazione quando la correlazione
FREE
Nome Prodotto: Efficiency Ratio Indicator (Standalone) Descrizione Breve: Uno strumento potente per misurare l’efficienza del trend e filtrare il rumore di mercato. Passa da un elegante grafico a linea a un istogramma colorato con avvisi sulle soglie. Caratteristiche Principali: Due Modalità di Visualizzazione: Grafico a linea (simile all’RSI) oppure istogramma colorato (Trend/Neutro/Range). Soglie Configurabili: Imposta i tuoi livelli superiori (trend) e inferiori (range). Visualizzazione Mul
FREE
Descrizione Spread History è un indicatore semplice ma fondamentale che consente di visualizzare lo spread storico, barra per barra, in una finestra separata, insieme alla media mobile dello spread. Grazie alla linea in tempo reale e al testo sovrapposto sul grafico principale, puoi monitorare facilmente lo spread applicato dal broker in ogni fase del mercato. A cosa serve Visualizzare lo spread reale fornito dal broker per ogni candela Calcolare e mostrare la media dello spread su base config
FREE
Descrizione Il Body Ratio Indicator è uno strumento pensato per analizzare la struttura interna delle candele e classificare rapidamente le giornate di mercato in base alla loro forza direzionale. Misura il rapporto tra il corpo della candela (differenza tra apertura e chiusura) e il suo range totale (massimo - minimo), evidenziando con chiarezza se si tratta di: Giornate ad alta direzionalità (trend forti) Giornate neutre o di consolidamento Giornate molto indecise (doji, spinning top) Grazie a
FREE
Performance indicator
Mattia Impicciatore
Overview Performance Indicator mostra una heatmap dei rendimenti percentuali per una lista di simboli su intervalli temporali configurabili. Serve a confrontare in modo visivo forza e debolezza relativa, senza dare alcuna garanzia di risultati. Configuration SymbolsList: simboli separati da virgola, deve corrispondere esattamente ai nomi nel terminale. BaseTF: timeframe base per i calcoli. UpdateSeconds: intervallo in secondi per l’aggiornamento automatico. CapPercent: valore di normalizzazio
FREE
Fair Value Gap Zone
Mattia Impicciatore
Descrizione Generale Il Fair Gap Value Indicator individua e mette in evidenza i “fair value gap” sul grafico di MetaTrader 5. Un fair gap si crea quando tra il minimo di una barra e il massimo di un’altra, separate da una barra intermedia, si forma un vuoto di prezzo. L’indicatore disegna rettangoli colorati (rialzisti e ribassisti) per evidenziare queste aree, offrendo un valido supporto visivo nelle strategie di price action. Principali Caratteristiche Rilevamento gap rialzisti : evidenzia ga
FREE
Candlestick Pattern Analyzer per MT4 Descrizione Candlestick Pattern Analyzer è uno strumento avanzato per trader discrezionali e sistematici, progettato per riconoscere automaticamente i principali pattern di candele giapponesi e fornire un’analisi statistica dettagliata delle loro performance passate. Questo indicatore è ideale per chi vuole verificare in modo oggettivo l’efficacia reale dei pattern e usarli assieme a filtri di conferma (es. trend, livelli chiave, volume) e a una strategia di
Descrizione lunga (dettagliata): Bias Finder è uno strumento avanzato per l’analisi stagionale dei mercati, progettato per mostrare visivamente i profitti medi generati su diversi segmenti temporali: Bias orario (Hourly Bias) – mostra le ore più profittevoli della giornata Bias settimanale (Weekday Bias) – identifica il miglior giorno della settimana per ogni simbolo Bias giorno del mese (Day-of-Month Bias) – analizza l’andamento dei primi e ultimi giorni ️ Bias mensile (Monthly Bi
Descrizione Candlestick Pattern Analyzer è uno strumento avanzato per trader discrezionali e sistematici, progettato per identificare automaticamente i principali pattern di candele giapponesi e fornire un’analisi statistica dettagliata delle loro performance storiche. L’indicatore è ideale per chi desidera verificare l’efficacia reale dei pattern e utilizzarli insieme a filtri di conferma (trend, livelli chiave, volumi, ecc.) e a una strategia di gestione del rischio ben definita. Funzionalit
Filtro:
Nessuna recensione
Rispondi alla recensione