Structured Zig Zag

The indicator identifies ordered trend structures. Each structure consists of at least three waves: the formation of the primary movement, a rollback, and a breakout of the primary movement.

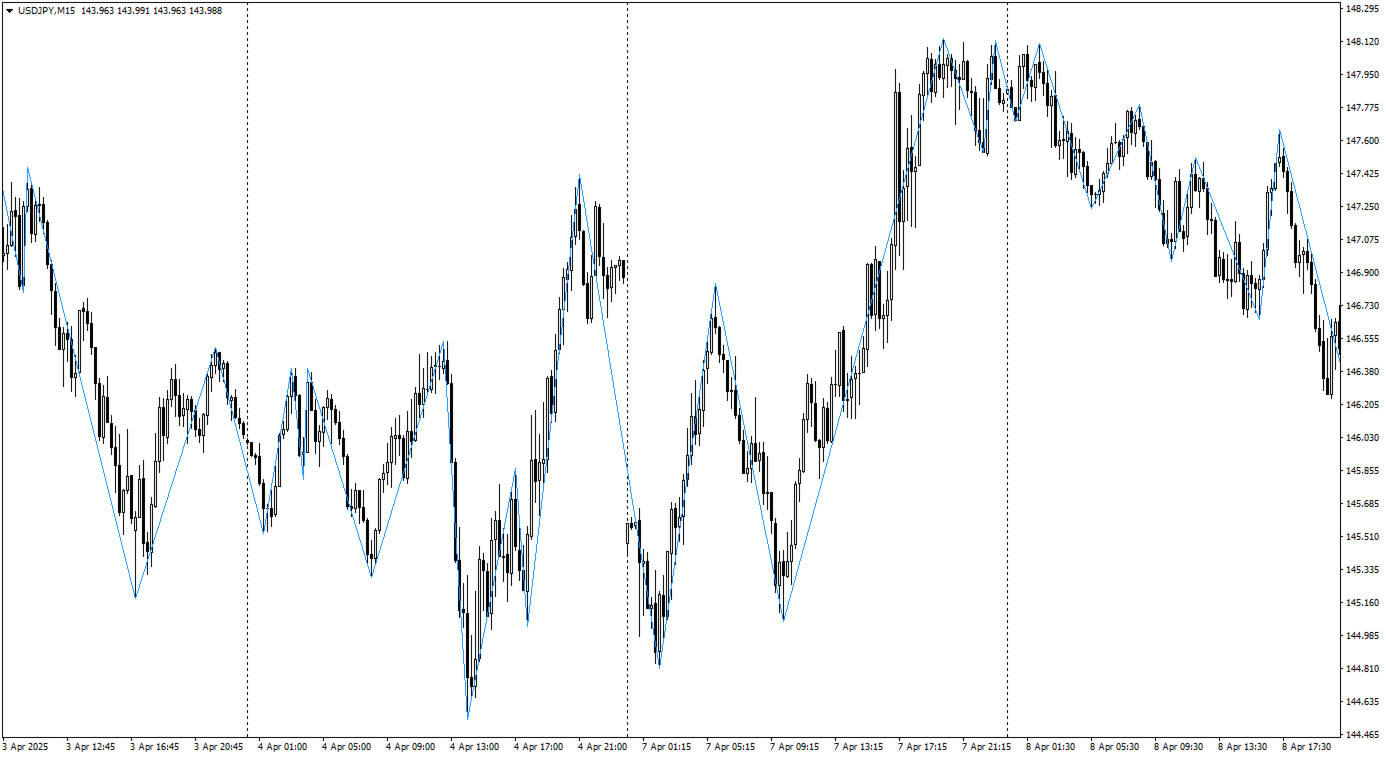
One wave in the structure is considered to be the market movement between opposite price extremes, which corresponded to different positions of the points of the classic Parabolic Support And Reverse (PSAR) indicator relative to the closing prices of the candles: a point below the price - searching for a maximum, a point above the price - searching for a minimum. The connection of opposite waves gives an idea of ​​the market movement in the form of a zigzag, displayed by thin blue lines.

From the resulting zigzag, the indicator identifies upward and downward structures. For a downward structure, each new minimum should be lower than the previous minimum, and each new maximum - lower than the previous maximum. Accordingly, for an upward structure, each new minimum should be higher than the previous minimum, and the new maximum should be higher than the previous maximum. Downward structures are displayed with bold red lines, and upward ones - with blue lines. At the moment of structure detection, a sound signal is given with the display of a text description of the trading signal.

The simplest use of the indicator readings is to open a deal at the moment of structure detection in the direction indicated by the structure. Accordingly, it is convenient to close a deal at the moment of the opposite signal. In order to assess the prospects of such tactics for the current timeframe of the selected financial instrument, the indicator provides a service for maintaining statistics of the results of virtual trading for the available depth of the quotes history. One deal is considered to be the interval between the moments of detection of opposite structures, that is, two or more structures in a row of the same direction do not lead to the virtual closure of one deal and the opening of the next. Long deals are displayed as a dotted blue line, and short ones are red. The result of virtual trading is displayed in the upper left corner of the chart in points with a division into short and long deals. The result takes into account the spread (specified by the user), but does not take into account swaps and commissions.

Parameters

  1. PSAR step - the parameter of the PSAR indicator of the same name.
  2. PSAR max - the parameter of the PSAR indicator of the same name.
  3. Show structures - control the display of wave structures. If disabled, the indicator will not be able to notify about trading signals and keep statistics of virtual trading.
  4. Alert on signal - manage notifications about trading signals.
  5. Collect statistic - manage the service for collecting statistics of virtual trading. If disabled, the dotted lines of trades and the result of virtual trading in the upper left corner of the chart are not displayed.
  6. Spread, pts. - the spread value in points, which is taken into account when keeping statistics and displaying trade lines.
  7. Use reverse - keeping statistics in the opposite direction. If enabled, then when registering an upward structure, a short deal will be virtually opened, and when registering a downward one, a long one.
  8. Number of bars to display (0 - all) - the number of bars processed by all the indicator's functionality. The value 0 indicates that data is processed in the full depth of the existing quote history.
  9. Color of upward trend - the color of upward structures and lines of long trades.
  10. Color of downward trend - the color of downward structures and lines of short trades.

Application

The indicator is recommended for use on charts of financial instruments that have a clearly expressed trend character. At the moment (06.06.2025), such instruments include USDJPY and GBPJPY, if you use TF M15. If the instrument has a clearly expressed flat, then you can use the principle of reversal of trading signals available in the indicator. In this case, statistics show positive results for the last year for EURUSD on TF H1.


Prodotti consigliati
Flying Volume
Paul Geirnaerdt
1 (1)
The Flying Volume indicator is a specialized volume indicator. It deciphers the volume data after heavy proprietary number crunching. When a main signal is found Flying Volume will look for possible continuation points. The main signal is shown by arrows, the continuation points by dots. Volume indicators are most often used on higher timeframes. Features Main Buy or Sell signals Continuation signals No repainting One signal per bar Settings Flying Volume default settings are good enough most
Fibo Linear Channel
Igor Semyonov
4 (1)
Colored indicator of the linear channel based on the Fibonacci sequence. It is used for making trading decisions and analyzing market sentiment. The channel boundaries represent strong support/resistance levels, as they are the Fibonacci proportion levels. Users can select the number of displayed lines of channel boundaries on the chart by means of the input parameters. Attaching multiple instances of the indicator to the chart with different calculation periods leads to displaying a system of c
Questo indicatore è un indicatore per l'analisi automatica delle onde perfetto per il trading pratico! Caso... Nota:   non sono abituato a usare nomi occidentali per la classificazione delle onde a causa dell'influenza della convenzione di denominazione di Tang Lun (Tang Zhong Shuo Zen), ho chiamato l'onda base come   penna   e la banda dell'onda secondaria come   segmento   At allo stesso tempo, il segmento ha la direzione del trend. La denominazione   è principalmente segmento di trend   (que
Newlevel
Sergey Nanov
Indicator. Zones of support and resistance levels The most reliable tool in the hands of any technical analyst is support and resistance levels.It is these levels that magically work in the market, because the price then bounces off them, on the contrary, gaining maximum acceleration, punching them and striving for a new price point.However, in practice, many beginners face enormous difficulties in building them.This is due to the fact that the price may react quite differently to them, and ofte
FREE
A Fibonacci indicator is best used with other indicators like Pivots, Support/Resistance etc. Price tends to use Fibo levels as Support or Resistance lines. So, this indicator is very useful to know when price might reverse or if a level is crossed, price might continue the trend. Also, to find the best Take Profit and StopLoss lines. Don't use Fibo Indicator alone for trading as it might not always be accurate. Use it to make your strategies better as a supporting indicator. Settings: Auto Fib
FREE
Lisek Stochastic
Darius Hans Lischka
2.83 (6)
Lisek Stochastic   oscillator indicator with Alarm, Push Notifications and e-mail  Notifications. The Stochastic indicator is a momentum indicator that shows you how strong or weak the current trend is. It helps you identify overbought and oversold market conditions within a trend. The Stochastic indicator is lagging indicator, which means it don't predict where price is going, it is only providing data on where price has been !!! How to trade with Stochastic indicator: Trend following: As long
FREE
MACD Scanner With Alerts
Niravkumar Maganbhai Patel
4 (2)
MACD Dashboard Panel   This indicator helps you to scan symbols which are in the Market Watch window and filter out a trend according to MACD. Moving Average Convergence Divergence (MACD) is a trend-following momentum indicator that shows the relationship between two moving averages of a security’s price. The MACD is calculated by subtracting the 26-period Exponential Moving Average (EMA) from the 12-period EMA. The result of that calculation is the MACD line. A nine-day EMA of the MACD called
FREE
Atr Mtf Trend
Jalitha K Johny
The Average True Range (ATR) is a tool to measure volatility. ATR MTF (Multi Time Frame) indicator provides all timeframe trends helps to identify in which kind of volatility environment the market .This indicator can be used with any Trading Systems for additional confirmation of trading entries or exits. It is a very helpful tool to calculate Targets and Stops according the current market conditions.
Questo consulente esperto non esegue alcuna operazione, ma esegue la scansione di tutti i simboli nel tuo orologio di mercato e scansiona ciascuna azione una per una in tempi diversi e alla fine ti mostra quale simbolo in quale periodo di tempo ha una potente candela avvolgente. Inoltre, puoi definire un periodo MA e un limite RSI alto e basso, e ti mostra quali simboli in quale intervallo di tempo attraverserà la media mobile regolata e quale simbolo in quale intervallo di tempo attraverserà
FREE
Discover the power of precision and efficiency in your trading with the " Super Auto Fibonacci " MT4 indicator. This cutting-edge tool is meticulously designed to enhance your technical analysis, providing you with invaluable insights to make informed trading decisions. Key Features: Automated Fibonacci Analysis: Say goodbye to the hassle of manual Fibonacci retracement and extension drawing. "Super Auto Fibonacci" instantly identifies and plots Fibonacci levels on your MT4 chart, saving you tim
FREE
Vi presentiamo l'indicatore Donchian Channels per MQL4, uno strumento potente di analisi tecnica progettato per aumentare il successo delle vostre operazioni. Questo indicatore è composto da quattro linee che rappresentano i limiti superiori e inferiori del movimento dei prezzi in un periodo specificato. Con l'indicatore Donchian Channels potete facilmente individuare potenziali rotture e inversioni di tendenza sul mercato. La linea superiore mostra il massimo più alto del periodo specificato, m
Special Agent
Vitalii Zakharuk
The advantage of working on the Special Agent signal indicator is that the trader does not need to independently conduct a technical analysis of the chart. Determining the market trend is an important task for traders, and the tool gives ready-made signals in the form of directional arrows. This tool is an arrow (signal). Special Agent is a trend indicator, a technical analysis tool that helps to determine the exact direction of the trend: either up or down price movement for a trading pair of
Multi Timeframe ZigZag Indicator
Salman A A A T Bakhash
5 (2)
Description: This indicator draw ZigZag Line in multiple time frame also search for Harmonic patterns before completion of the pattern. Features: Five instances of ZigZag indicators can be configured to any desired timeframe and inputs. Draw Harmonic pattern before pattern completion. Display Fibonacci retracement ratios. Configurable Fibonacci retracement ratios. Draw AB=CD based on Fibonacci retracement you define. You can define margin of error allowed in Harmonic or Fibonacci calculations
FREE
The Auto Fibonacci Indicator is a professional technical analysis tool that automatically draws Fibonacci retracement levels based on the most recent closed Daily (D1) or 4-Hour (H4) candle. These levels are widely used by traders to identify key support , resistance , and trend reversal zones . This version is designed for manual trading and supports a powerful trading strategy using Fibonacci levels combined with a 50-period EMA (Exponential Moving Average) , which you can easily add from MT4
FREE
MT Scanner
Niravkumar Maganbhai Patel
4 (2)
This indicator helps you to Scan symbols which are in the Market Watch Window  and filter out trends with alerts. It works based on the effective indicator "SUPERTREND" which is used by many traders for trading: When box color changes to " Green " or " Red " color, it indicates you for trend change for long and short entry. And also you will get alerted on screen. When it changes to " Green ", it indicates you that trend is going upwards, and you can take the long entry. If the color changes to
FREE
L'indicatore SMC Venom Model BPR è uno strumento professionale per i trader che operano nell'ambito del concetto di Smart Money (SMC). Identifica automaticamente due modelli chiave sul grafico dei prezzi: FVG   (Fair Value Gap) è una combinazione di tre candele, in cui c'è un gap tra la prima e la terza candela. Forma una zona tra livelli in cui non c'è supporto di volume, il che spesso porta a una correzione dei prezzi. BPR   (Balanced Price Range) è una combinazione di due modelli FVG che for
Chart Analyzer
Innovicient Limited
The Chart Analyzer is an MT4 indicator that provides visual arrow signals without redrawing them. In addition, we have included trendlines to validate your entries. This indicator has been fine-tuned to work with all timeframes and instruments.  The Chart Analyzer has a number of advantages Does not fade or remove arrows when drawn Sends both email and phone alerts. It is light on computer resources Easy to install. Default setting works just fine.  If price opens above the trendline, open bu
Introduction to Fractal Moving Average Fractal Moving Average indicator was designed as part of Fractal Pattern Scanner. Inside Fractal Pattern Scanner, Fractal Moving Average Indicator was implemented as multiple of chart objects. With over thousands of chart object, we find that it was not the best and efficient ways to operate the indicator. It was computationally too heavy for the indicator. Hence, we decide to implement the indicator version of Fractal Moving Average indicator to benefit o
FREE
PZ Mean Reversion MT4
PZ TRADING SLU
3 (4)
Indicatore unico che implementa un approccio professionale e quantitativo al trading di reversione. Sfrutta il fatto che il prezzo devia e ritorna alla media in modo prevedibile e misurabile, il che consente regole di entrata e uscita chiare che superano di gran lunga le strategie di trading non quantitative. [ Installation Guide | Update Guide | Troubleshooting | FAQ | All Products ] Segnali di trading chiari Incredibilmente facile da scambiare Colori e dimensioni personalizzabili Implementa l
Free automatic Fibonacci is an indicator that automatically plots a Fibonacci retracement based on the number of bars you select on the BarsToScan setting in the indicator. The Fibonacci is automatically updated in real time as new highest and lowest values appears amongst the selected bars. You can select which level values to be displayed in the indicator settings. You can also select the color of the levels thus enabling the trader to be able to attach the indicator several times with differe
FREE
Implement
Vitalii Zakharuk
5 (1)
Implement analyzes market dynamics for pivot points. If you want to learn how to spot the correct reversals for consistently likely profitable trading, buy this indicator. Shows favorable moments of entering the market in stripes. Ready-made trading system. The principle of operation of the indicator is to automatically determine the current state of the market when placed on a chart, analyze historical data based on historical data and display instructions for further actions on the trader's
Auto Fibo Pro m
DMITRII GRIDASOV
Indicatore "Auto FIBO Pro" Crypto_Forex: è un ottimo strumento ausiliario nel trading! - L'indicatore calcola e posiziona automaticamente sul grafico i livelli di Fibo e le linee di tendenza locali (colore rosso). - I livelli di Fibonacci indicano le aree chiave in cui il prezzo può invertirsi. - I livelli più importanti sono 23,6%, 38,2%, 50% e 61,8%. - Puoi usarlo per lo scalping di inversione o per il trading di zone grid. - Ci sono molte opportunità per migliorare il tuo sistema attuale us
Holy Trinity Volatility Indicator This indicator reflects the peak time of the day wherein there's is expected to be sharp price actions. It also presents the markets as just waking up from the dull and less volatile Asian (and or London) trading sessions into a bustling time of highly liquid price flows. NOTE: This indicator informs the trader ahead of peak price movements - one bar just before the real actions starts. Enter when the volatility line falls below the Tripple Exponential Moving Av
The Icarus Reversals(TM) FREE Indicator is a powerful tool to identify high-probability reversal points, across all instruments.  The Reversals Indicator provides traders and investors with a simple-to-use and highly dynamic insight into points of likely price-action reversals.  Generated by a unique proprietary code-set, the Reversals Indicator (FREE version) generates long and short trade signals, which can be customised for key inputs and colourisation. Settings of the Icarus Reversals FREE h
FREE
The indicator allows you to trade binary options. The recommended time frame is М1 and the expiration time is 1,2,3 minutes. The indicator suitable for auto and manual trading. A possible signal is specified as a arrows above/under a candle. You should wait until the candle closes! Arrows are not re-painted Trade sessions: TOKYO section (Half-end) Currency pairs: USD/JPY Working time frame: M1 Expiration time: 1,2,3 minutes. The indicator also shows good results when using the martingale strateg
FREE
Raymond Cloudy Day Indicator for MT4 – Pivot-Based Reversal and Trend Levels Raymond Cloudy Day Indicator is a pivot-based level indicator for MetaTrader 4 (MT4). It was developed by Ngo The Hung based on Raymond’s original idea and is designed to give a structured view of potential reversal zones, trend extensions and support/resistance levels directly on the chart. The default settings are optimised for XAUUSD on the H1 timeframe, but the indicator can be tested and adjusted for other symbols
Fibonacci Currency Strength Meter (FCSM) Early Access Sale!! This new product is still in the process of adding new features and settings. For early bird buyers. The Price will be 50% Sale. In a few weeks, the product will be done. Go Grab your copy while it's still cheap. More details will be added soon. Things to be added. Alert Levels Mobile and Email Alert From it's name, Fibonacci Currency Strength Meter is a combination of Fibonacci levels and Currency Strength Meter. The plot of Fibona
Sentinel Arrow Caratteristiche principali: ⊗Un algoritmo esclusivo per identificare rapidamente e accuratamente trend, inversioni e variazioni di momentum. ⊗Progettato per uso professionale, è dotato di una solida logica di segnale che elimina ritardi o falsi aggiornamenti. ⊗Adatto a diversi intervalli temporali. ⊗Non ridisegna, elimina o modifica i segnali passati. ⊗Tutti i segnali di ACQUISTO e VENDITA vengono generati sulla candela stessa e rimangono fissi. ⊗Nel trading reale, non c'è alcun
FREE
Rainbow MT4
Jamal El Alama
Rainbow MT4 is a technical indicator based on Moving average with period 34 and very easy to use. When price crosses above MA and MA changes color to green, it’s a signal to buy. When price crosses below MA and MA changes color to red, it’s a signal to sell. The Expert advisor ( Rainbow EA MT4) based on Rainbow MT4 indicator, as you can see in the short video below is now available here .
FREE
Pivot Point Fibo RSJ è un indicatore che traccia le linee di supporto e resistenza del giorno utilizzando i tassi di Fibonacci. Questo spettacolare indicatore crea fino a 7 livelli di supporto e resistenza tramite Pivot Point utilizzando i tassi di Fibonacci. È fantastico come i prezzi rispettino ogni livello di questo supporto e resistenza, dove è possibile percepire possibili punti di entrata/uscita di un'operazione. Caratteristiche Fino a 7 livelli di supporto e 7 livelli di resistenza Im
FREE
Gli utenti di questo prodotto hanno anche acquistato
Gann Made Easy
Oleg Rodin
4.83 (150)
Gann Made Easy è un sistema di trading Forex professionale e facile da usare che si basa sui migliori principi del trading utilizzando la teoria di mr. WD Gann. L'indicatore fornisce segnali ACQUISTA e VENDI accurati, inclusi i livelli di Stop Loss e Take Profit. Puoi fare trading anche in movimento utilizzando le notifiche PUSH. CONTATTATEMI DOPO L'ACQUISTO PER RICEVERE CONSIGLI DI TRADING, BONUS E L'ASSISTENTE EA GANN MADE EASY GRATUITAMENTE! Probabilmente hai già sentito parlare molte volte d
Smc Blast Signal
Mohit Dhariwal
4.75 (4)
NEW YEAR 2026 SALE OFFER PRICE AT JUST 80 DOLLARS FEW COPIES ONLY AT This price From 5th Jan -10th Jan MIDNIGHT Final offer GRAB YOUR COPY ON THIS New Year EVE Prices will be increased to 150 after the offer period ends Full Fledged EA and Alert plus for alerts will also be provided in this offer along with the purchase of Indicator. Limited copies only at this price and Ea too. Grab your copy soon Alert plus for indicator with set file is kept in comment section with the image  SMC Blast Signa
Attualmente 20% di sconto! La soluzione migliore per ogni principiante o trader esperto! Questo software per cruscotti funziona su 28 coppie di valute. Si basa su 2 dei nostri indicatori principali (Advanced Currency Strength 28 e Advanced Currency Impulse). Offre un'ottima panoramica dell'intero mercato Forex. Mostra i valori di forza delle valute avanzate, la velocità di movimento delle valute e i segnali per 28 coppie Forex in tutti i (9) timeframe. Immaginate come migliorerà il vostro tra
Scalper Inside PRO
Alexey Minkov
4.74 (69)
An exclusive indicator that utilizes an innovative algorithm to swiftly and accurately determine the market trend. The indicator automatically calculates opening, closing, and profit levels, providing detailed trading statistics. With these features, you can choose the most appropriate trading instrument for the current market conditions. Additionally, you can easily integrate your own arrow indicators into Scalper Inside Pro to quickly evaluate their statistics and profitability. Scalper Inside
Presentiamo l'Indicatore F-16 Plane, uno strumento all'avanguardia per MT4 progettato per rivoluzionare la tua esperienza di trading. Ispirato alla velocità e alla precisione imbattibili dell'aereo da combattimento F-16, questo indicatore combina algoritmi avanzati e tecnologia all'avanguardia per offrire prestazioni senza precedenti sui mercati finanziari. Con l'Indicatore F-16 Plane, volerai al di sopra della concorrenza poiché fornisce analisi in tempo reale e genera segnali di trading estrem
Game Changer Indicator
Vasiliy Strukov
4.67 (9)
Game Changer è un indicatore di tendenza rivoluzionario, progettato per essere utilizzato su qualsiasi strumento finanziario, per trasformare il tuo Metatrader in un potente analizzatore di trend. L'indicatore non ridisegna e non subisce ritardi. Funziona su qualsiasi intervallo temporale e aiuta a identificare i trend, segnala potenziali inversioni, funge da meccanismo di trailing stop e fornisce avvisi in tempo reale per risposte tempestive del mercato. Che tu sia un trader esperto, un profess
M1 Sniper
Oleg Rodin
4.89 (18)
M1 SNIPER è un sistema di indicatori di trading facile da usare. Si tratta di un indicatore a freccia progettato per l'intervallo temporale M1. L'indicatore può essere utilizzato come sistema autonomo per lo scalping sull'intervallo temporale M1 e come parte del tuo sistema di trading esistente. Sebbene questo sistema di trading sia stato progettato specificamente per il trading sull'intervallo temporale M1, può comunque essere utilizzato anche con altri intervalli temporali. Inizialmente ho pro
Dynamic Forex28 Navigator
Bernhard Schweigert
4.43 (7)
Dynamic Forex28 Navigator - Lo strumento di trading Forex di nuova generazione. ATTUALMENTE SCONTATO DEL 49%. Dynamic Forex28 Navigator è l'evoluzione dei nostri indicatori popolari di lunga data, che combinano la potenza di tre in uno: Advanced Currency Strength28 Indicator (695 recensioni) + Advanced Currency IMPULSE con ALERT (520 recensioni) + CS28 Combo Signals (Bonus). Dettagli sull'indicatore https://www.mql5.com/en/blogs/post/758844 Cosa offre l'indicatore di forza di nuova generazione?
Special Launch Offer: Available at a limited-time price to celebrate the new release. [Concept: Cutting Through the Noise] In a market filled with chaotic movements and lagging indicators, clarity is the ultimate weapon. KATANA Scalper is engineered with a singular philosophy: to cut through market noise like a precision blade. By filtering out non-essential fluctuations, it reveals the pure "Momentum Structure" hidden within the price action, allowing you to execute with surgical precision. 5
Trend indicator AI
Ramil Minniakhmetov
4.95 (76)
Trend Ai indicator è un ottimo strumento che migliorerà l'analisi di mercato di un trader combinando l'identificazione della tendenza con punti di ingresso utilizzabili e avvisi di inversione. Questo indicatore consente agli utenti di navigare nelle complessità del mercato forex con fiducia e precisione Oltre ai segnali primari, l'indicatore Ai di tendenza identifica i punti di ingresso secondari che si presentano durante i pullback o i ritracciamenti, consentendo ai trader di capitalizzare le
Indicatore in anticipo   determina i livelli e le zone di inversione del mercato , consente di attendere che il prezzo ritorni al livello ed entrare all'inizio di un nuovo trend, e non alla sua fine. Lui mostra   livelli di inversione   dove il mercato conferma un cambio di direzione e forma un ulteriore movimento. L'indicatore funziona senza ridisegnare, è ottimizzato per qualsiasi strumento e rivela il suo massimo potenziale quando abbinato al   LINEE DI TENDENZA PRO   indicatore. Scanner st
ATTUALMENTE SCONTATO DEL 26% La soluzione migliore per ogni principiante o trader esperto! Questo indicatore è uno strumento di trading unico, di alta qualità e conveniente perché abbiamo incorporato una serie di caratteristiche proprietarie e una nuova formula. Con un solo grafico è possibile leggere la forza delle valute per 28 coppie Forex! Immaginate come migliorerà il vostro trading perché sarete in grado di individuare l'esatto punto di innesco di una nuova tendenza o di un'opportunità
Hidden Cycles
Lev Vladimirovic Marushkin
5 (1)
Christmas Sale! – The Only 100% Universal Tool Grab Hidden Cycles for only $129 (regular price $179). Stop trading against nature! This is your chance to secure the only indicator rooted in the absolute laws that govern the entire universe. Most tools guess—this one reveals the truth. Offer ends soon — Buy another toy or buy the truth. Your choice... Based on Universal Laws — NOT Some Guy’s Algorithm: Let the market adjust to the Hidden Cycles Geometry — not the other way around. Most indicat
M1 Arrow
Oleg Rodin
5 (19)
Una strategia intraday basata su due principi fondamentali del mercato. L'algoritmo si basa sull'analisi dei volumi e delle onde di prezzo utilizzando filtri aggiuntivi. L'algoritmo intelligente dell'indicatore fornisce un segnale solo quando due fattori di mercato si combinano in uno solo. L'indicatore calcola le onde di un certo intervallo sul grafico M1 utilizzando i dati dell'intervallo di tempo più alto. E per confermare l'onda, l'indicatore utilizza l'analisi per volume. Questo indicatore
Volatility Trend System - un sistema di trading che fornisce segnali per le voci. Il sistema di volatilità fornisce segnali lineari e puntuali nella direzione del trend, nonché segnali per uscirne, senza ridisegnare e ritardi. L'indicatore di tendenza monitora la direzione della tendenza a medio termine, mostra la direzione e il suo cambiamento. L'indicatore di segnale si basa sui cambiamenti della volatilità e mostra gli ingressi nel mercato. L'indicatore è dotato di diversi tipi di avvisi. Pu
Versione MT5 disponibile qui: https://www.mql5.com/en/market/product/50048 Canale e gruppo Telegram: https://t.me/bluedigitsfx Accesso al gruppo V.I.P: Invia la prova di pagamento di uno dei nostri prodotti a pagamento in messaggio privato Broker consigliato: https://bit.ly/BlueDigitsFxStarTrader BlueDigitsFx Easy 123 System — Indicatore potente per rilevare inversioni e breakout su MT4 Sistema tutto-in-uno non repaint per individuare facilmente cambi di struttura del mercato, breakout e in
Quantum Breakout Indicator PRO
Bogdan Ion Puscasu
4.96 (26)
Presentazione       Quantum Breakout PRO   , l'innovativo indicatore MQL5 che sta trasformando il modo in cui scambi le zone di breakout! Sviluppato da un team di trader esperti con un'esperienza di trading di oltre 13 anni,   Quantum Breakout PRO   è progettato per spingere il tuo viaggio di trading a nuovi livelli con la sua strategia innovativa e dinamica della zona di breakout. Quantum Breakout Indicator ti fornirà frecce di segnalazione sulle zone di breakout con 5 zone target di profitt
Entry Points Pro
Yury Orlov
4.62 (172)
Indicatore top per MT5 che fornisce segnali accurati per entrare in un trade senza riverniciare! Può essere applicato a qualsiasi attività finanziaria: forex, criptovalute, metalli, azioni, indici.  La versione MT5 è qui Fornirà segnali di trading piuttosto precisi e ti dirà quando è meglio aprire un trade e chiuderlo. Guarda il video (6:22) con un esempio di elaborazione di un solo segnale che ha ripagato l'indicatore! La maggior parte dei trader migliora i propri risultati di trading dura
Trend Lines PRO
Roman Podpora
5 (1)
LINEE DI TENDENZA PRO       Aiuta a capire dove il mercato sta realmente cambiando direzione. L'indicatore mostra reali inversioni di tendenza e punti in cui i principali attori rientrano. Vedi  Linee BOS   Cambiamenti di tendenza e livelli chiave su timeframe più ampi, senza impostazioni complesse o rumore inutile. I segnali non vengono ridisegnati e rimangono sul grafico dopo la chiusura della barra. Cosa mostra l'indicatore: Cambiamenti reali       tendenza (linee BOS) Una volta che un segna
Meravith
Ivan Stefanov
5 (1)
L'indicatore analizza il volume da ogni punto e calcola i livelli di esaurimento del mercato per quel volume. È composto da tre linee: Linea di esaurimento del volume rialzista Linea di esaurimento del volume ribassista Una linea che indica la tendenza del mercato. Questa linea cambia colore per riflettere se il mercato è rialzista o ribassista. Puoi analizzare il mercato da qualsiasi punto di partenza tu scelga. Una volta che una linea di esaurimento del volume è raggiunta, identifica un nuovo
Advanced Supply Demand
Bernhard Schweigert
4.91 (296)
New Year Trading Special – 50% OFF Best Solution for any Newbie or Expert Trader! This indicator is a unique, high quality and affordable trading tool because we have incorporated a number of proprietary features and a new formula. With this update, you will be able to show double timeframe zones. You will not only be able to show a higher TF but to show both, the chart TF, PLUS the higher TF: SHOWING NESTED ZONES. All Supply Demand traders will love it. :) Important Information Revealed Maximiz
ATTUALMENTE SCONTATO DEL 26%!! Questo indicatore è una super combinazione di entrambi i nostri indicatori principali ( Advanced Currency Strength 28   &  Advanced Currency IMPULSE with ALERT  ). Mostra i valori di forza della valuta per unità di TICK e segnali di allerta per 28 coppie Forex. È possibile utilizzare 11 diverse unità di Tick. Si tratta di 1, 2, 3, 4, 5, 6, 10, 12, 15, 20 e 30 secondi. La barra dell'unità di tick nella finestra secondaria verrà mostrata e spostata a sinistra quand
Currency Strength Exotics
Bernhard Schweigert
4.88 (33)
ATTUALMENTE SCONTATO DEL 20%! La soluzione migliore per qualsiasi principiante o trader esperto! Questo indicatore è specializzato nel mostrare la forza della valuta per qualsiasi simbolo come coppie esotiche, materie prime, indici o futures. È il primo nel suo genere, qualsiasi simbolo può essere aggiunto alla nona riga per mostrare la vera forza della valuta di Oro, Argento, Petrolio, DAX, US30, MXN, TRY, CNH ecc. Si tratta di uno strumento di trading unico, di alta qualità e conveniente pe
Day Trader Master è un sistema di trading completo per i day trader. Le systeme se compose de due indicatori. Un indicar est un signal fléché pour acheter et vendre. C'est l'indicateur de fleche que vous obtenez. Je vous fournirai le deuxième indicaur gratuitement. Le deuxième indicaur è un indicaur de tendance spécialement conçu pour être utilisé conjointement avec ces flèches. GLI INDICATORI NON SI RIPETONO E NON RITARDANO! Usare questo sistema è molto semplice. Devi solo seguire i segnali del
PZ Divergence Trading
PZ TRADING SLU
5 (2)
Unlock hidden profits: accurate divergence trading for all markets Tricky to find and scarce in frequency, divergences are one of the most reliable trading scenarios. This indicator finds and scans for regular and hidden divergences automatically using your favourite oscillator. [ Installation Guide | Update Guide | Troubleshooting | FAQ | All Products ] Easy to trade Finds regular and hidden divergences Supports many well known oscillators Implements trading signals based on breakouts Display
SMC Easy Signal
Mohamed Hassan
4.73 (15)
3 copies left at $65, next price is $120 SMC Easy Signal was built to remove the confusion around the smart money concept by turning structural shifts like BOS (Break of Structure) and CHoCH (Change of Character) into simple buy and sell trading signals. It simplifies market structure trading by automatically identifying breakouts and reversals as they happen, allowing traders to focus on execution rather than analysis. Whether the market is continuing its trend or preparing to reverse, the i
Trend Screener
STE S.S.COMPANY
4.79 (95)
Indicatore di tendenza, soluzione unica rivoluzionaria per il trading di tendenze e il filtraggio con tutte le importanti funzionalità di tendenza integrate in un unico strumento! È un indicatore multi-timeframe e multi-valuta al 100% non ridipingibile che può essere utilizzato su tutti i simboli/strumenti: forex, materie prime, criptovalute, indici e azioni. OFFERTA A TEMPO LIMITATO: l'indicatore di screening di supporto e resistenza è disponibile a soli 50$ e a vita. (Prezzo originale 250$) (o
Atomic Analyst
Issam Kassas
5 (3)
Innanzitutto, vale la pena sottolineare che questo indicatore di trading non è repaint, non è ridisegno e non presenta ritardi, il che lo rende ideale sia per il trading manuale che per quello automatico. Manuale utente: impostazioni, input e strategia. L'Analista Atomico è un indicatore di azione del prezzo PA che utilizza la forza e il momentum del prezzo per trovare un miglior vantaggio sul mercato. Dotato di filtri avanzati che aiutano a rimuovere rumori e segnali falsi, e aumentare il pote
Smetti di indovinare. Inizia a fare trading con un vantaggio statistico. Gli indici azionari non si negoziano come il forex. Hanno sessioni definite, gap notturni e seguono pattern statistici prevedibili. Questo indicatore ti fornisce i dati di probabilità di cui hai bisogno per fare trading su indici come DAX, S&P 500 e Dow Jones con fiducia. Cosa lo rende diverso La maggior parte degli indicatori ti mostra cosa è successo. Questo ti mostra cosa probabilmente succederà dopo. Ogni giorno di trad
GOLD Impulse with Alert
Bernhard Schweigert
4.64 (11)
Questo indicatore è una super combinazione dei nostri 2 prodotti Advanced Currency IMPULSE with ALERT  +   Currency Strength Exotics . Funziona per tutti i time frame e mostra graficamente l'impulso di forza o debolezza per le 8 valute principali più un simbolo! Questo indicatore è specializzato nel mostrare l'accelerazione della forza delle valute per qualsiasi simbolo come oro, coppie esotiche, materie prime, indici o futures. Primo nel suo genere, qualsiasi simbolo può essere aggiunto all
Altri dall’autore
Фрактальная дивергенция - это   скрытая дивергенция, построенная на фракталах Билла Вильямса. Бычья фрактальная дивергенция представляет собой комбинацию из двух нижних фракталов, последний из которых расположен ниже предыдущего, и при этом две свечи справа от минимума последнего фрактала имеют минимумы выше уровня предыдущего фрактала (см. скриншот 1). Медвежья фрактальная дивергенция - это комбинация из двух соседних верхних фракталов, последний из которых расположен выше, чем предыдущий верхн
FREE
Канал фрактальной дивергенции базируется на   паттернах фрактальной дивергенции , представляя их в виде канала, границы которого изменяются в момент появления очередного паттерна. Верхняя граница канала соответствует верхней части последнего найденного медвежьего паттерна фрактальной дивергенции. Нижняя граница канала - это нижняя часть последнего найденного бычьего паттерна (см. скриншот 1). По отношению к индикатору   FractalDivergence_Patterns , канальная версия обладает теми же параметрами,
FREE
A fractal divergence is a hidden divergence , based on Bill Williams' fractals. A bullish fractal divergence is a combination of two lower fractals, the last of which is located below the previous one, and, at the same time, two candles to the right of the Low of the last fractal have Lows higher than the previous fractal level (see screenshot 1). A bearish fractal divergence is a combination of two adjacent upper fractals, the last of which is located above the previous one, but, at the same ti
FREE
Charts Synchronizer
Ihor Herasko
4 (4)
The "Chart synchronization" utility (the SynchronizeCharts indicator) can help traders in simultaneous trading on multiple financial instruments, as it automatically scrolls all or selected charts of the terminal according to the position of the master chart.  Four charts are shown in the screenshot 1. The EURUSD chart is the master chart, as the SynchronizeCharts indicator is attached to it. As a result, the other three charts are displayed on the timeline starting from 2017.02.17 23:15. Any fu
The indicator shows the number and ratio of ticks with the price growth and fall for each candle of the chart. The upper part of the histogram in the form of thin lines shows the number of price growth ticks (bullish strength), while the lower part shows the amount of price fall ticks (bearish strength). The thicker histogram bars is the difference between the strength of bulls and bears. A positive difference is displayed in green, and the negative one is red. The strength of bulls increases wh
FREE
Fractal Divergence Channel is based on the fractal divergence patterns , representing them in the form of a channel with the borders changing the moment the next pattern appears. The upper border of the channel corresponds to the upper part of the last found bearish fractal divergence pattern. The lower border of the channel is the lower part of the last found bullish pattern (see screenshot 1). Compared to the FractalDivergence_Patterns indicator, the channel version has the same parameters wit
FREE
TemplateSwitcher
Ihor Herasko
5 (2)
The TemplateSwitcher utility allows automatically switching the set of indicators and objects used on the chart depending on the current timeframe and/or symbol. It often happens that an indicator with a certain period is used on a chart of a higher timeframe, while the same indicator with an increased calculation period is required for a smaller timeframe. Of course, it is possible to open two charts of different timeframes with the required indicator periods. But what if duplication of charts
The Expert Advisor generates trading signals based on the values of the FractalDivergence_Patterns indicator. A Buy signal is generated when the indicator detects a support level, and a Sell signal is generated when the resistance level is found (see Fig. 1: blue arrows show buying, red arrows show selling). The Expert Advisor does not require the indicator to be additionally used, and can display the appropriate support and resistance levels. Parameters The "Fractal divergence parameters" bloc
General information The indicator determines the areas of flat and trending market states by comparing the average and current volatilities. Flat areas are rectangles of a user-defined color. It is easy to determine the maximum and minimum of the flat area, as well as its height in points. The beginning of each trend area is marked with an arrow indicating the direction of the trend. Tuning parameters 1. Averaging period - period for calculating average volatility 2. Color of flat region -
Утилита TemplateSwitcher позволяет автоматически переключать набор используемых на графике индикаторов и объектов в зависимости от текущего таймфрейма графика и/или символа. Часто бывает так, что на графике старшего таймфрейма используется индикатор с одним периодом расчета, а для младшего таймфрейма этот же индикатор необходим с увеличенным периодом расчета. Можно, конечно же, открыть два графика разных таймфреймов с нужными периодами индикатора. Но что, если мы не можем позволить себе дублиров
Filtro:
Nessuna recensione
Rispondi alla recensione