Predictive Ranges HTF for MT4
- Indicatori
-
Minh Truong Pham
 Hello, my name is Pham and I am a programmer and trader! At here, I create amazing forex indicators and expert advisors for Metatrader.
I will try:
+ Provide best tools base on my 5 years experience as a trader and 10 years as a programmer. - Versione: 1.0
- Attivazioni: 15
The Predictive Ranges indicator aims to efficiently predict future trading ranges in real-time, providing multiple effective support & resistance levels as well as indications of the current trend direction.
Predictive Ranges was a premium feature originally released by LuxAlgo in 2020.
The feature was discontinued & made legacy, however, due to its popularity and reproduction attempts, we deemed it necessary to release it open source to the community.
🔶 USAGE
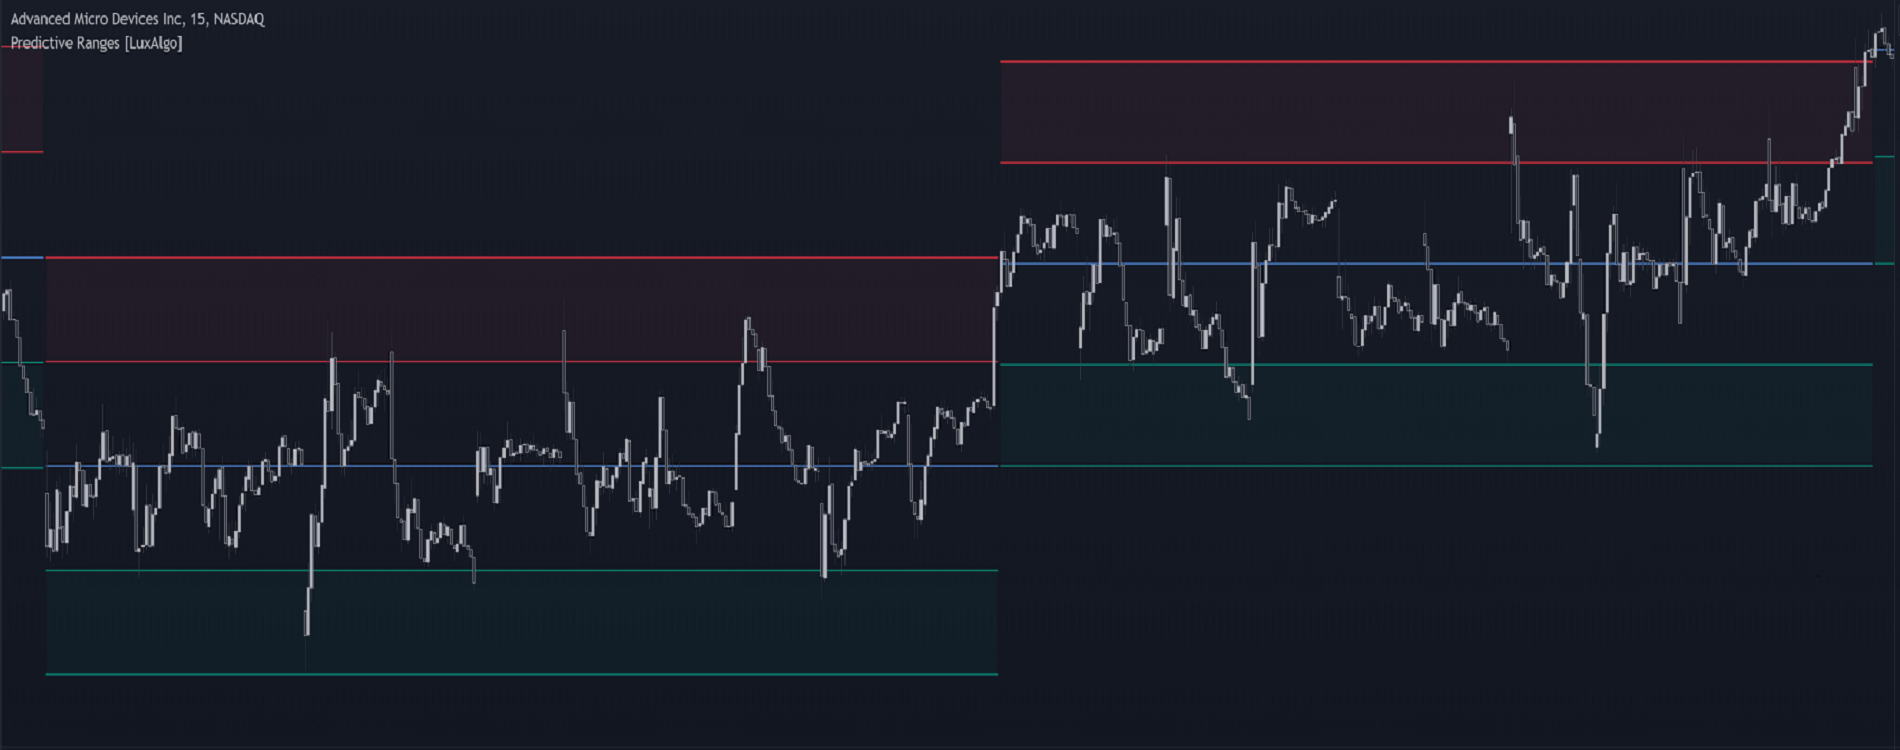
Figure 1
The primary purpose of this indicator is to provide potential support & resistance levels on the chart by estimating future trading ranges.
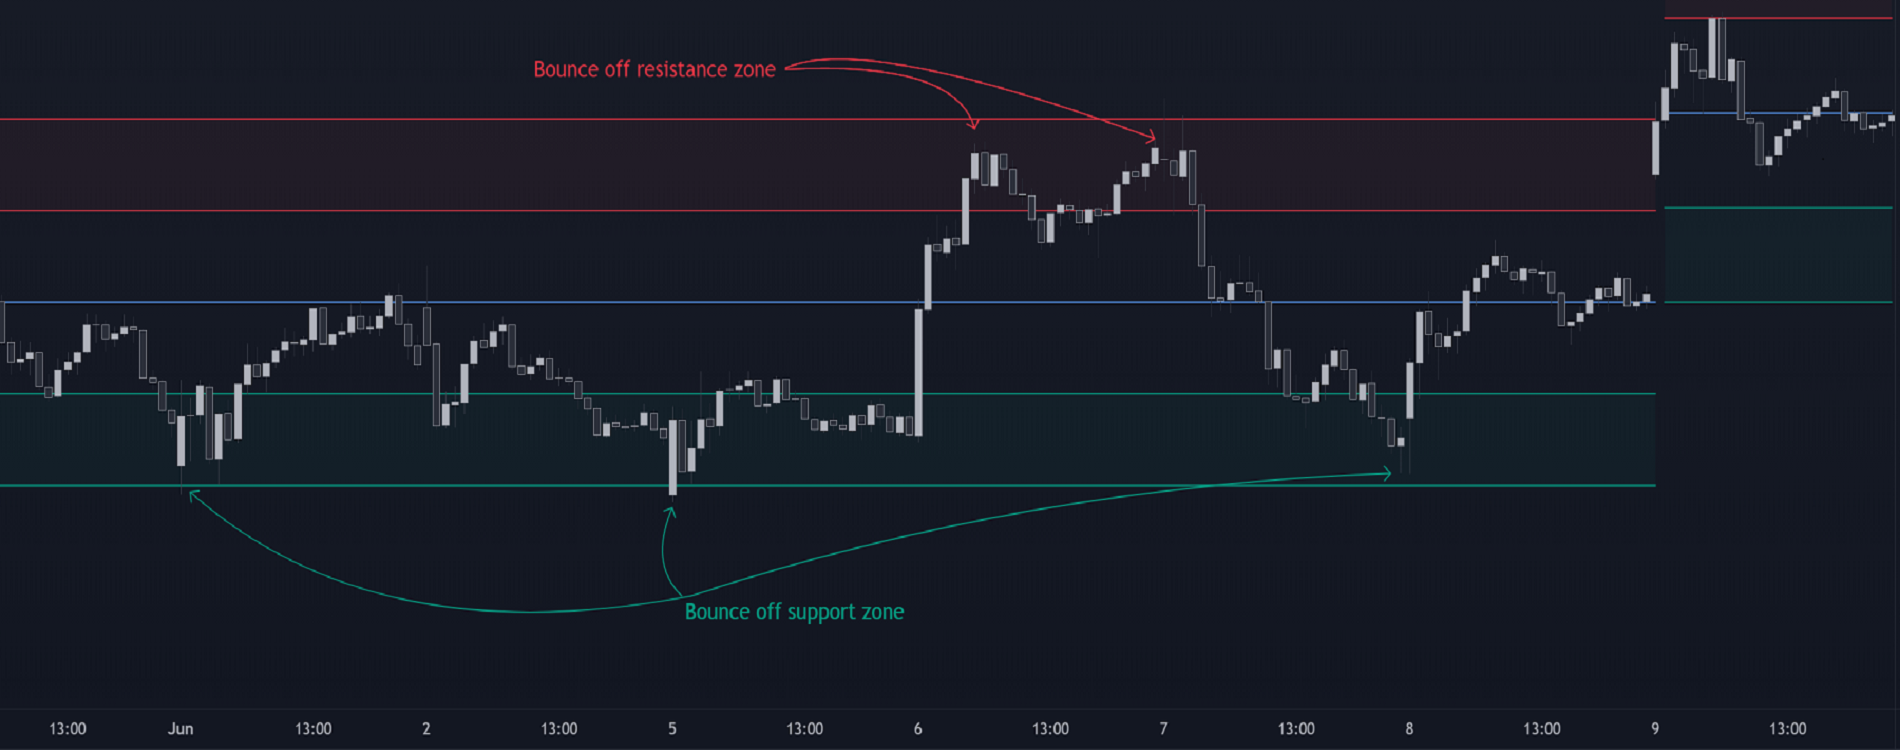
Figure 2
When the price reaches one of the upper/lower levels of the Predictive Ranges we can expect the price to reverse.
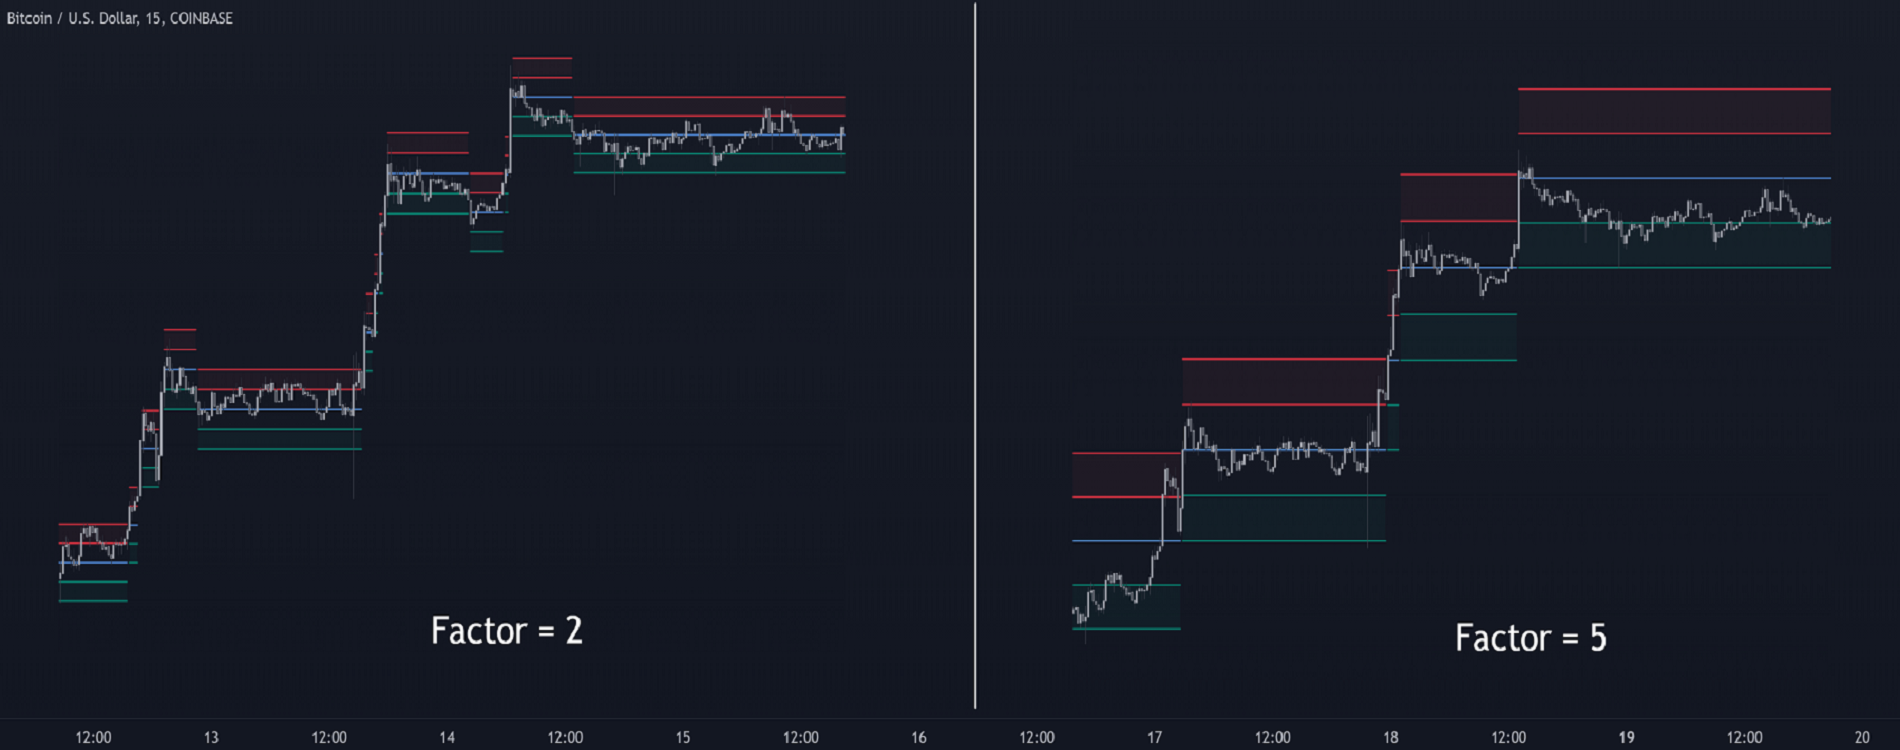
Figure 3
If the price exits the predicted range, new levels are given in real-time & they do not repaint. Higher "Factor" values allow returning longer term and wider ranges less susceptible to be exited.
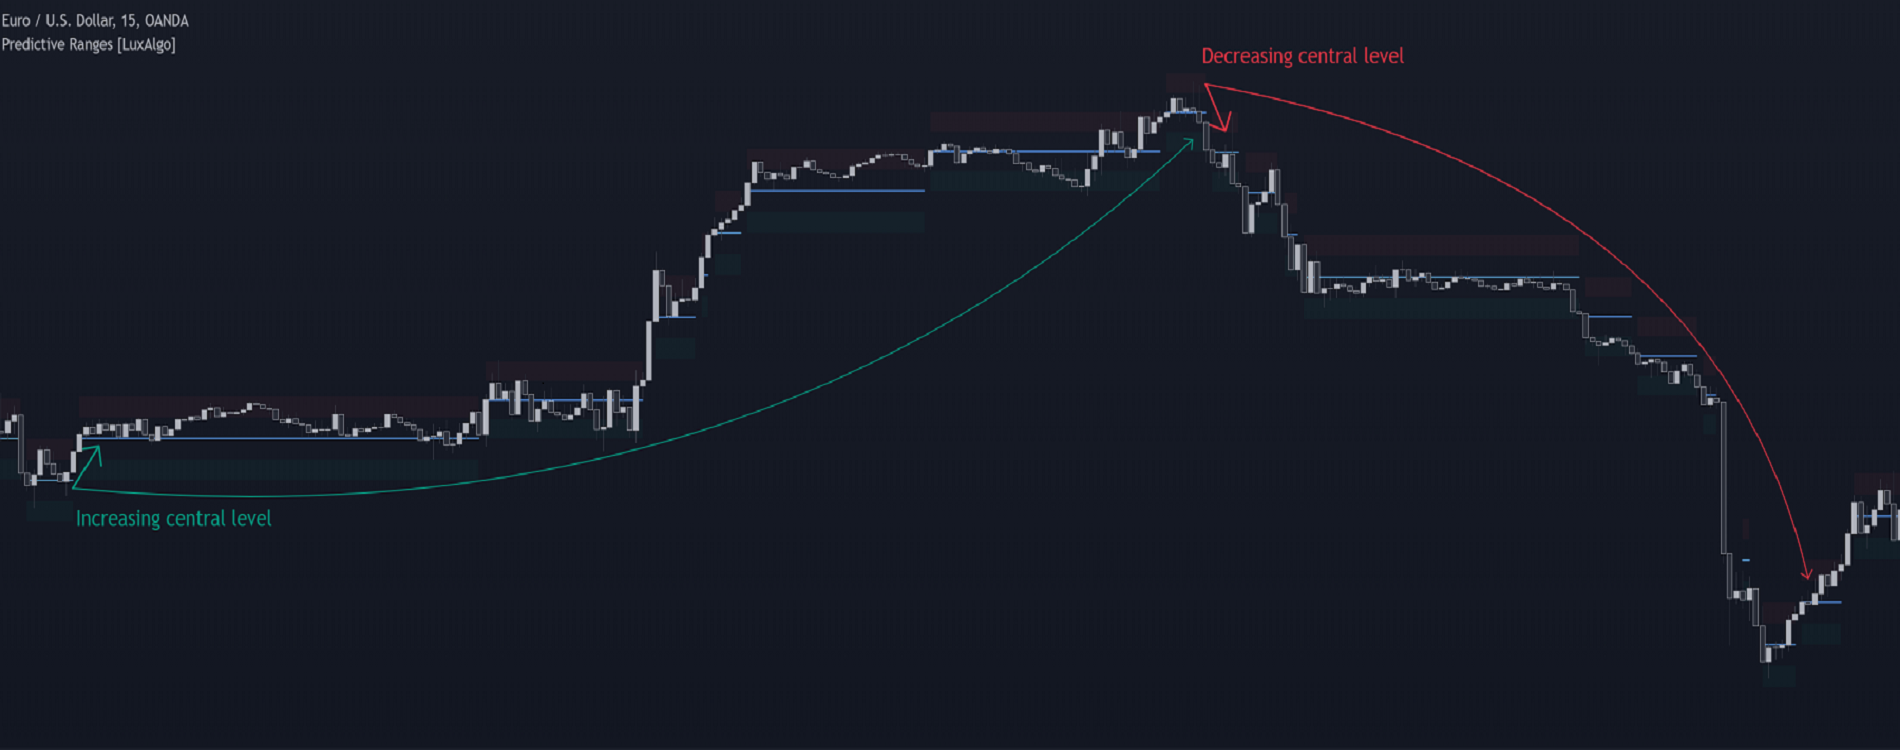
🔹Estimating Trend Directions
Figure 4
Users are able to easily estimate trend directions by looking at the central levels of the predictive ranges, which represent an estimate of the price central tendency.If this central level increases it means the price is up-trending, if it is decreasing price is down-trending.
🔶 SETTINGS
- Length: ATR Length used for the indicator calculation. Higher values will tend to return ranges of equal width.
- Factor: Control the ranges width. Higher values will return less frequent ranges, each having a higher width.
- Timeframe: Indicator timeframe output.
- Style settings
- Show history levels option