Regardez les tutoriels vidéo de Market sur YouTube
Comment acheter un robot de trading ou un indicateur
Exécutez votre EA sur
hébergement virtuel
hébergement virtuel
Test un indicateur/robot de trading avant d'acheter
Vous voulez gagner de l'argent sur Market ?
Comment présenter un produit pour qu'il se vende bien
Indicateurs techniques payants pour MetaTrader 4 - 105

* Pivot Points Magic : Effortlessly Plot Pivot Levels on Any Chart**
Pivot Points Magic simplifies the process of identifying critical pivot levels on any chart, across all timeframes. With just a few clicks, traders can instantly visualize pivot points, enabling them to make more informed trading decisions.
We value your feedback! Share your experience with Pivot Points Magic and help us improve. Your reviews and suggestions are essential for shaping future updates and enhancements to the in

The KeyLevels Pro indicator is a powerful tool designed to identify significant support and resistance levels based on pivot highs and lows in the price action. This indicator is perfect for traders who rely on market structure and key price levels to make informed trading decisions. It features customizable parameters, automatic detection of pivot points, and visual representation of key levels with optional labels. Features Pivot Detection : Automatically detects pivot highs and lows based on

The “Sharp Scalper” indicator is high-frequency trading tool designed for quick, short term trades in the forex market. It focus on identifying rapid price movement and generating signals for best entry. This indicator is known for its ability to capture small profit opportunities multiple times throughout the day making it ideal for scalpers looking to capitalize on market volatility. The” sharp scalper” indicator employs advance algorithms to detect market trends and fluctuation, helping trade

This is a Halftrend Scalper for MT4. Meant for Swinging markets with good volatility. Not suitable during low volatility. Features:
Wait for Price to cross Halftrend line. Select which HTF halftrend(Main Signal) Check Halftrend alignment between Higher Timeframes Check High Volume Bar (Optional) Halftrend Trends stacked (Optional) What's in the Downloads Package Extras:
- HT Scalper Scanner Dashboard (Keep in same directory as your Arrows indicator - or else won't work)
- Modified MTF Halft

The 10PIPS Dynamite is a semi-automated cutting-edge Forex indicator designed to automatically revolutionize your trading skills from a being a losing trader to becoming a profitable trader simply by Scalping 10 pips per Trade setup generated by the software. 10PIPS Dynamite Indicator once attached on the main chart it starts an in-depth market analysis based on its unique in-built advanced algorithm which seamlessly combines powerful indicators, statistical analysis, and trend recognition

TMA Channel is a price channel obtained through a special calculation method based on traditional TMA . The channel has upper, middle, and lower tracks . When the price approaches or exceeds the upper track, it is already in an overbought state, and attention should be paid to the situation of reversal and decline; When the price approaches or falls below the lower track, it is already in an oversold state, and attention should be paid to the situation of reversal and rise . The indicator will d

The author's indicator is based on automatically adjusted horizontal and inclined lines from significant market points. In the settings you can specify the period, color and thickness of the lines, disable or enable slanted lines and several other graphic settings.
Recommended rules for entering the market:
Using SELL as an example:
I place a pending order for a breakout - sell stop below the horizontal line of the indicator, then I monitor the work-out, stop loss and take profit are determi

User Manual Download link: https://ontrd.com/our-books/
For all who are asking about indicator ON Trade Numerology Station It obtain about 16 numerology strategies it make together completed unit control your trading . Basic strategies to work with it are 3 strategies statistics about them are the following : 1. RBA levels success rate more then 95%. 2. FF more then 96% 3.RBA SUN 98% We will not say 100 % as they are .. Ratio rates as following : 1.Rba levels more then 1/3 to 1/6 . 2.FF MORE

The Onion Trend Indicator is a revolutionary trend trading and market data filtering solution that combines all the important features of a trend tool in one tool! It is great for any trader, be it Forex or binary options. No settings are required, everything is optimized by time and experience, it works effectively both in flat conditions and in trend conditions.
The Onion Trend Indicator is a technical analysis tool for financial markets that reflects current deviations in the price of s

Using the Likdon Forex indicator algorithm, you can quickly determine the current trend in the market. The Elephant indicator tracks long trends and can be used without restrictions on instruments or timeframes. With its help, you can try to predict future price values, but its main purpose is to generate buy and sell signals.
The indicator tracks the market trend, ignoring sharp fluctuations and market noise around the average price. It implements a technical analysis method based on the assu
The LewshaGen indicator is a technical analysis tool used in the Forex market. It helps traders make decisions when to enter or exit a trade based on analysis of market data. Let's look at how it works and why it can be useful.
How the LewshaGen indicator works: Trend Analysis: The indicator analyzes chart data and identifies key turning points and trends in the market. In the chart above, you can see how the indicator helps identify a decline of 180 points (PIP) and a subsequent rise of 330 p

The Dreadnought indicator carefully analyzes price dynamics, identifying temporary weakening of the trend and sharp changes in its direction. By monitoring this indicator, you can easily notice changes in the market and take appropriate action. Entering the market may be easy, but maintaining a position is much more difficult. With Dreadnought, you have reliable support to successfully stay ahead of the trend. This indicator analyzes historical data and provides the trader with the necessary in

Mysterium is a channel indicator without redraws, which is based on double smoothing of moving averages. Unlike channel indicators such as Bollinger, Mysterium uses double smoothed moving averages. This allows you to more accurately determine the direction of market movement, although it reduces the sensitivity of the indicator. However, double smoothing provides a clearer and more stable display of channels on the chart, which helps traders make informed trading decisions.
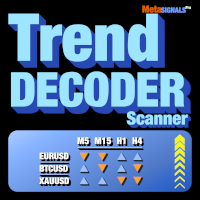
Obtenez les signaux de TrendDECODER pour plusieurs actifs et plusieurs unités de temps | Déterminez la meilleure unité de temps pour entrer | Maximisez vos profits et vos trades gagnants Indicateur et screener non repeignant, non retardé - idéal pour le trading manuel et automatisé - pour tous les actifs et toutes les unités de temps 49 $ pour les 50 premières copies - puis 99 $ Après votre achat, veuillez laisser un commentaire ou un avis et nous vous enverrons un indicateur SUPPLÉMENTAIRE d'u

Volatility Range is an indicator that calculates the range of volatility, predicting key levels such as potential resistance above and potential support below. The indicator can display volatility forecast ranges for the latest 50 days, 10 weeks, or 4 months. By observing these ranges, you can better identify reliable levels where combining with price action enhances trade accuracy significantly.
You have the option to fill the rectangle area with color for easier observation, or leave it unfi

Price Action Scanner is an indicator that identifies price behaviors and provides alerts. This indicator can simultaneously detect signals for up to 6 different symbols across various timeframes. By setting a separator, you can add different symbol names and timeframes.
The indicator can detect multiple common signal types such as Pinbar, Engulfing Pattern, Inside Bar, Morning Star, Evening Star, Fakey, and display corresponding information in separate subcharts, indicating the direction of th

Price Action Scanner Pro is an indicator that identifies price behaviors and provides alerts, offering more features and customization compared to Price Action Scanner ( https://www.mql5.com/zh/market/product/118937?source=Site+Profile+Seller ) . This indicator can simultaneously detect signals for up to 15 symbols across different timeframes. You can configure it to detect signals during specific trading sessions such as Asian, European, and US sessions, using different timeframes. This

The Radiant Trend indicator calculates the saturation levels of the price chart. A signal to exit the oversold zone indicates a buy, and a signal to exit the overbought zone indicates a sell. For this indicator, it is usually necessary to set relative values for the overbought and oversold levels – Bottom and Top.
Often a good trend can be seen visually on the price chart. However, an experienced trader must clearly understand the current market situation before opening a position. The indic

The Candlestick Pattern Detector is an advanced MetaTrader 4 indicator designed to identify and highlight candlestick patterns on your charts. Currently, the indicator detects one specific candlestick pattern - the pinbar, known for its significance in technical analysis and trading strategies. This tool provides traders with visual cues, making it easier to spot potential market reversals or continuations. Features: Customizable Colors: Users can customize the colors of the bullish and bearish
Working with the Channel Motion Tracker indicator is as simple as possible. Just react to the arrows that the indicator displays. Each arrow represents an explicit command to action. The signals generated by this indicator are accurate enough to allow you to trade based on this information.
One of the main advantages of the indicator is its ability to build high-quality channels and generate signals for entering the market. This is great for the trader who always finds it difficult to choose b

The Geliosx indicator is designed to visually display the trend. One of the key tasks when monitoring the currency market is to determine the trend - a stable direction of price movement. Geliosx uses special calculations to smooth out sharp fluctuations that do not have a significant impact on the overall picture of the price movement.
This indicator is created for those who value their time and money.
The trend can be ascending (bull trend) or descending (bear trend). Typically, the trend g

Support and Resistance Levels is an intelligent indicator that displays horizontal support and resistance levels, suitable for traders of different trading frequencies. You can select your preferred trading frequency, and the indicator will automatically calculate the support and resistance levels relevant to that frequency. Among these, the Bull-Bear Line is an interval used to distinguish the strength of bullish and bearish forces, and is an important level.
You can combine it with other ind

Product Description: Precision Pattern Indicator for Consistent Profits Elevate your trading with the Precision Pattern Indicator, an advanced tool designed to spot a highly profitable and specific trading pattern. This indicator is your key to unlocking consistent profits with minimal effort. Key Features: Accurate Entry Signals: Receive clear entry signals with green arrows for buy opportunities and red arrows for sell opportunities, ensuring you never miss a profitable trade. Defined Risk Man

The Arriator forex indicator algorithm allows you to quickly determine the current trend in the market. The Elephant indicator accompanies long-term trends and can be used without restrictions on instruments or timeframes. This indicator not only helps predict future values, but also generates buy and sell signals. It tracks market trends, ignoring wild swings and market noise around the average price. The indicator implements a type of technical analysis based on the idea of market cyclicalit

REMINDER: Early buyers hot price discount: Price subject to rise after first 20 copies. Starting price $65 and final price will be $1275. Secure your discounted copy Now!
Smart Money Analyser Indicator User Manual
1. Introduction Welcome to the Smart Money Analyser Indicator This powerful tool provides traders with comprehensive market analysis by combining various technical indicators to generate actionable trading signals. Designed to be user-friendly, this indicator helps traders of all

The Sirius X indicator reliably tracks market trends, ignoring wild swings and market noise. Suitable for trading on any timeframe, effectively filtering sudden price spikes and corrections by reducing market noise around the average price. For calculations, the indicator uses iLow, iHigh, iMA and iATR. The output based on these reliable indicators is also reliable. You can set up a sound signal and notifications, for example by email. The indicator does not redraw and works stably.
Configurab
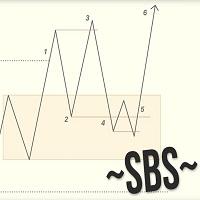
Swing Breakout Sequence | SBS presents a comprehensive trading strategy designed to help traders identify and capitalize on market swings and breakouts. The Swing Breakout Sequence (SBS) strategy is built around a series of well-defined steps to optimize trading decisions and improve profitability. Version 2.01: Add "golden entry" - entry by fib. Stoic added to it (fibo) he calls this setup gold SBS here is the video the description of the setup starts at 18min24sec Version 2: + Add BOS filter

Gann Retracements Octaves Indicator Enhance your trading strategy with the Gann Retracements Octaves indicator, meticulously designed to integrate Gann's theories with modern technical analysis. This custom indicator provides you with precise retracement levels based on Gann's octaves, helping you identify key support and resistance levels, as well as potential reversal points in the market. Key Features: 24 Indicator Buffers : Tracks multiple retracement levels (-7/8 to 15/8) with distinct colo
FX Strength Meter Pro est un indicateur puissant conçu pour les traders à la recherche des meilleures opportunités de trading sur le marché des changes. Notre indicateur affiche en temps réel la force relative des principales paires de devises (USD, EUR, GBP, CHF, AUD, NZD, JPY, CAD), vous aidant ainsi à identifier rapidement les devises les plus fortes et les plus faibles pour optimiser votre stratégie de trading.
Voici les principales caractéristiques :
- Support multi-timeframes : Du graph
L'indicateur MTFMA (Moyennes Mobiles Multi-Temps) utilise plusieurs moyennes mobiles (MA) dans différentes unités de temps pour fournir des signaux d'achat et de vente (qui ne repeignent pas) dans une fenêtre séparée du graphique principal. Il est polyvalent et facile à interpréter, adapté à la fois au scalping sur des unités de temps plus petites et au trading à plus long terme sur des unités de temps plus grandes. Pourquoi est-il Multiframe ? Le terme multiframe fait référence à la capacité de
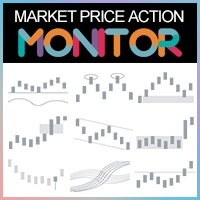
Why do I need to use the Market PA Monitor:
1.It is impossible to monitor multiple varieties and multiple TF of the market.
The market situation is constantly changing, with numerous varieties, and each variety has different timeframe from small to large. Each TF contains different market changes and trend alternations. Under numerous varieties and multiple TFs, there are countless trading opportunities every day. However, an ordinary trader cannot detect the trading opportunities of each var

Subscribe to the MA7 Trading channel to receive notifications about new programs, updates and other information. Ask questions in the profile on the MQL5 .
Description of work The MA7 Moss indicator is based on the standard Accelerator Oscillator (AC) indicator. Shows overbought and oversold zones. Detailed information about the MA7 Moss indicator.
Indicator settings General settings: Upper level ; Lower level .
Message settings: Send message to the terminal (Alert) – permission to send mess

Golden Range 2 is one of the top entry indicators securing its future with its results. Indicator settings: Points = how precise pattern detection is AlertConfirmation = turn on(true) off(false) alert CalculatedBars = how many bars will be calculated
Please leave Positive comments, reviews. Buffer 0 Buy Arrow, Buffer 1 Sell Arrow, Buffer2 Buy Signal(Value:1/0), Buffer3 Sell Signal(Value:1/0) Buy Green, Sell Red

Indicateur NextCandlePredictor NextCandlePredictor, un indicateur de signal avec alerte qui ne repeint pas, ne change pas de couleur, ne bouge pas, ne disparaît pas et n'a pas de retard. Il vous aidera à identifier la direction des prochaines bougies dans n'importe quelle période. Hautement recommandé pour les marchés à forte volatilité comme New York, Londres ou même le chevauchement des deux. Caractéristiques Principales: Polyvalence dans les Périodes de Temps: Fournit des signaux rapides et p

Gann Angles Indicator The Gann Angles Indicator is a powerful technical tool based on the theory of William Delbert Gann. It helps traders identify potential support and resistance levels, as well as trend direction across various time intervals. Key features: Automatic determination of extremum within a specified time range Construction of 9 Gann Fan lines with angles of 82.5, 75, 71.25, 63.75, 45, 26.25, 18.75, 15, and 7.5 Flexible line color customization Adaptation to both upward an

Get rid of trading confusion and embrace stable income! Are you still worried about finding a low-risk and stable profit method? Are you still anxious about judging the market direction and controlling the risk of placing orders? The new cross-platform arbitrage indicator helps you easily achieve stable returns! Accurately capture arbitrage opportunities without you having to worry! The cross-platform arbitrage indicator is a powerful tool that can monitor the price differences of the same finan

L'indicateur "MultiSymbol & TF Chart Integrated" est conçu pour fournir rapidement une vue complète du marché, vous permettant de surveiller jusqu'à 60 paires de devises dans les délais de votre choix sur un seul graphique (mode multiple) ou de voir la paire que vous négociez sur tous les TF (mode simple). Avantages Principaux: Surveillance Complète: Permet la surveillance en temps réel de toutes les paires souhaitées sur un seul graphique en un coup d'œil.
Gain de Temps: Évite la nécessité de b

Fibonacci Wave Bands Indicator The Fibonacci Wave Bands indicator utilizes Fibonacci ratios to create dynamic bands around a central moving average. These bands are derived from key Fibonacci ratios (typically 38.2%, 50%, 61.8%) and adapt to market volatility, offering insights into potential support and resistance zones. Key Features: Fibonacci Levels: The indicator plots multiple bands above and below a central moving average based on Fibonacci ratios. Dynamic Support and Resistance: Bands ser
Êtes-vous fatigué de passer d'un graphique à l'autre pour surveiller différentes paires de devises et périodes ? L'indicateur Pairs and TF Changer est là pour révolutionner votre expérience de trading ! Une fois que vous avez chargé tous les indicateurs pour votre stratégie, ajoutez Pairs and TF Changer au graphique. Si nécessaire, vous pouvez ensuite ajuster sa position, ses couleurs ou le nombre de colonnes qu'il affiche ! Caractéristiques clés : Intégration transparente : Intégrez cet indicat
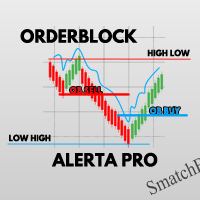
OrderBlock PRO ALERT
OrderBlock ALERTA PRO is the definitive tool for identifying the best entry points into the financial market. With it, you will find the ideal balance points for orders, detecting when liquidity will start to increase when breaking the bullish or bearish structure. Receive PUSH notifications directly on your Meta Trader, keeping you always informed.
Furthermore, OrderBlock ALERTA PRO identifies the HIGH LOW (HL) and LOW HIGH (LH) zones, providing you with the exact price

Misio - can be used as an independent trading system. The indicator determines the market trend, ignoring sharp fluctuations and noise around the average price. It displays the trending movement with potential stop points.
Simple, clear and effective use. The indicator does not redraw and does not lag. Suitable for all currency pairs and all timeframes.
Interpretation:
The location of the rate above or below the shadows indicates the presence of a trend. A move into the shadows signals a pos

Determining the current trend is one of the most important tasks of a trader, regardless of the trading style. The Gravity Trend indicator will help you do this with a fairly high probability.
Gravity Trend is a trend recognition indicator that uses the author's calculation algorithm. The indicator readings do not change under any conditions. The indicator is suitable for any currency pair, any timeframe.
Indicator Parameters Main Settings: HistoryBars - the number of bars to display. FirstPe
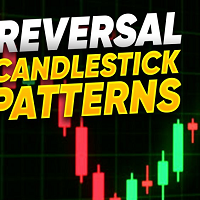
The Reversal Candlestick Structure indicator detects multiple candlestick patterns occurring when trends are most likely to experience a reversal in real-time. The reversal detection method includes various settings allowing users to adjust the reversal detection algorithm more precisely.
A dashboard showing the percentage of patterns detected as reversals is also included. USAGE Figure 1 Candlestick patterns are ubiquitous to technical analysts, allowing them to detect trend continuation

Indicateur de Modèles de Chandeliers pour MetaTrader 4 (MT4) Cet indicateur personnalisable identifie les principaux modèles de chandeliers haussiers et baissiers, aidant les traders dans leur analyse technique et prise de décision. Principales caractéristiques : Détection des modèles : Haussiers : Marteau, Englobante haussière, Étoile du matin, Trois soldats blancs, Harami haussier, Marteau inversé. Baissiers : Étoile filante, Englobante baissière, Étoile du soir, Trois corbeaux noirs, Harami b

Indicateur GoTrend Multi-Timeframe L'indicateur "GoTrend Multi-Timeframe" est un outil essentiel pour les traders à la recherche d'un moyen rapide et efficace d'évaluer les tendances générales et spécifiques d'une paire de devises sur différentes périodes. Cet indicateur permet aux traders d'obtenir une vue claire et complète de la direction du marché en un coup d'œil, optimisant ainsi la prise de décision et améliorant l'efficacité de leurs stratégies de trading. Caractéristiques Principales: A

Trend oscillator indicator for tracking microtrends and pullbacks. Determines even a minor change in trend . Allows you to open positions in a timely manner in accordance with market changes. Works on all timeframes, all currency pairs, metals, indices and cryptocurrencies. Can be used when working with binary options. Distinctive features Does not redraw after the candle closes; Accurately detects trend changes; Simple and clear setup; Works on all timeframes and all trading instruments; Suit
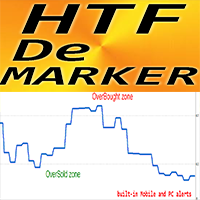
Crypto_Forex Indicator HTF DeMarker pour MT4.
- Cet indicateur est un outil utile utilisé par les traders techniques pour trouver des points d'entrée et de sortie. HTF signifie - Higher Time Frame. - La ligne d'oscillateur DeMarker indique la position actuelle du prix par rapport aux hauts et bas précédents. - DeMarker fournit les signaux de divergence réguliers les plus efficaces parmi les autres oscillateurs. - La zone de surachat se situe lorsque le DeMarker est supérieur à 0,7 et la zone d

Installation MetaTrader 4 Download: Download the provided file PrecisionStopDemo.ex4. Copy the File: Open MetaTrader 4. From the top menu, click on File > Open Data Folder. Navigate to MQL4 > Indicators. Copy the file PrecisionStopDemo.ex4 into this folder. Restart MetaTrader: Close and reopen MetaTrader 4. Add Indicator to Chart: In the Navigator (Ctrl+N), expand the Indicators folder. Find the indicator PrecisionStopDemo and drag it onto the desired chart.
Configuration After adding the ind

Contact me for any queries or custom orders, if you want to use this in an EA.
Key Features: Pattern Recognition : Identifies Fair Value Gaps (FVGs) Spots Break of Structure (BOS) points Detects Change of Character (CHoCH) patterns Versatile Application : Optimized for candlestick charts Compatible with any chart type and financial instrument Real-Time and Historical Analysis : Works seamlessly with both real-time and historical data Allows for backtesting strategies and live market analysis Vi

Indicateur Profil de Volume pour MT4 Obtenez un avantage en trading avec l'indicateur "Profil de Volume" pour MetaTrader 4 (MT4). Cet outil avancé d'analyse technique vous permet d'identifier avec précision les niveaux clés de support et de résistance basés sur le volume des transactions. Visualisez facilement les zones d'intérêt du marché, où les volumes d'échange sont les plus élevés, et utilisez ces informations pour prendre des décisions de trading plus éclairées. Caractéristiques principale

Insight Pro is a comprehensive tool for market analysis. It offers various features such as trend analysis, resistance and support levels, and distribution analysis, suitable for both novice and experienced traders. Features Trend Analysis Detects and visualizes market trends. Suggests potential entry and exit points based on trends. Customizable trend lines for clear market direction. Displays extreme levels based on standard deviation. Positive slope indicates buy orders; negative slope indic
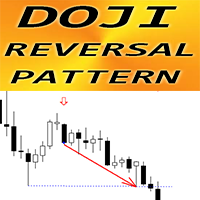
Indicateur Crypto_Forex "Doji Reversal pattern" pour MT4.
- L'indicateur "Doji Reversal pattern" est un trading d'action de prix pur : pas de repeinture, pas de délai ; - L'indicateur détecte le modèle de retournement Doji sur le graphique où la bougie Doji est au milieu du modèle et la dernière bougie est celle qui sort : - Modèle de retournement Doji haussier - Signal de flèche bleue sur le graphique (voir les images). - Modèle de retournement Doji baissier - Signal de flèche rouge sur le gr
Présentation de l'"Indicateur de Plage de Couleur" L'"Indicateur de Plage de Couleur" est un outil puissant d'analyse technique conçu pour la plateforme MT4, parfait pour les traders qui souhaitent avoir une vue claire et immédiate des tendances du marché. Cet indicateur trace une ligne colorée en fonction de la tendance actuelle, facilitant l'interprétation des mouvements de prix. Description de l'indicateur : Ligne verte : Indique une tendance haussière. Utilisez ce signal pour envisager des o
Trend Analyser Pro is a versatile trend analysis tool designed for traders who want to capitalize on market trends across multiple timeframes. This indicator combines advanced trend detection, dynamic signals, and higher timeframe analysis to provide you with a comprehensive view of market movements, empowering you to make well-informed trading decisions. 50% DISCOUNT - ENDING SOON ! BONUS - Trend Analyser Pro TradingView Indicator - After you purchase or rent this product, please send m
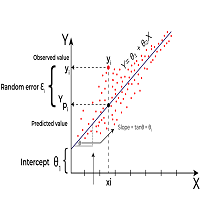
Linear Regression is a statistical method used to model the relationship between two or more variables. The primary goal of Linear Regression is to predict the value of one variable (called the dependent variable or outcome variable) based on the value of one or more other variables (called independent variables or explanatory variables) Linear Regression can be applied to technical analysis, and it is indeed one of the tools used by traders and analysts to make predictions and identify trends i
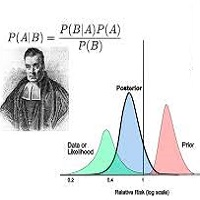
Bayesian methods can be effectively applied to predict price trends in financial markets, including Forex, stocks, and commodities. Here’s how Bayesian techniques can be used for trend prediction: 1. Bayesian Linear Regression Bayesian linear regression can be used to model the relationship between time and price. This method allows for the incorporation of prior beliefs about the trend and updates the trend as new data comes in. Example: Suppose you want to predict the price trend of a curren
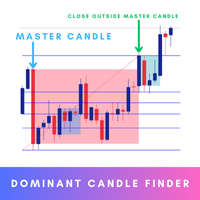
Dominant Candle Finder is a significant candlestick on a price chart that stands out due to its size, volume, or price movement compared to surrounding candles. It often indicates strong buying or selling pressure and can be used to identify potential reversal points, breakouts, or continuations in the market. Dominant candles can serve as key indicators for traders to make informed decisions, providing insights into market sentiment and potential future price movements. MT5 Version - https:

It is an indicator which notifies via push notification when an order is closed by Take Profit/Stop Loss It indicates via pc alert and or mobile alert Psychologically you can hold order for long time If stop loss hunting happens you can re-enter with same direction If real break out happens you can reverse the position Overall it Alerts when position reach stop - loss or take-profit level

Advance Currency Meter is a currency meter that detects strong market trends. This indicator is good for scalping, intraday trading and swing trading. The indicator will detect short term to long term market trends. This will give you good insight which currencies are best to trade as of the moment.
Note : Kindly contact me before you make any purchases. This won't work on your account without my permission. Note : Works well with my MACD Currency Strength Meter
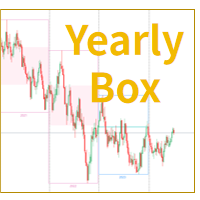
Indicateur de boîte de bougies annuelles MT4
L'indicateur "Boîte de Bougies Annuelles" sur la plateforme MetaTrader 4 est un outil d'analyse de graphiques qui affiche visuellement les mouvements de prix d'une année dans une boîte rectangulaire. Cet indicateur met en avant les prix d'ouverture et de clôture annuels en encadrant la fourchette des prix et en colorant l'arrière-plan. Les traders peuvent facilement identifier et analyser les fluctuations de prix annuelles en un coup d'œil en utilis

Our new indicator is an important part of the Smart Money Concepts (SMC) system
It uses a modern market vision and fast calculation methods. As a result, the trader has a complete picture of the trade at every moment in time, which makes the process of obtaining results easier and faster.
Our new indicator displays the following important patterns:
Order Blocks. Imbalance – Fair Value Gap (FVG). Break Of Structures (BoS). Change of character (CHoCH). Equal highs & lows. Premium , Equilibrium
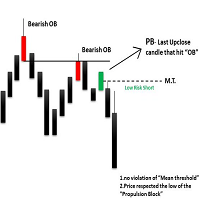
The ICT Propulsion Block indicator is meant to detect and highlight propulsion blocks, which are specific price structures introduced by the Inner Circle Trader (ICT).
Propulsion Blocks are essentially blocks located where prices interact with preceding order blocks. Traders often utilize them when analyzing price movements to identify potential turning points and market behavior or areas of interest in the market. Note: Multiple Timeframe version avaiable at here
USAGE (fingure

This indicator is based on the Cboe EuroCurrency Volatility Index, also known as Euro VIX and has a ticker symbol of EVZ . It basically measures volatility in the Eur/USD exchange rate but it can be used to track overall volitility in the Forex market. It's best usage is to add it to your system as a mandatory tool, when the value is above 7, you can expect some movement in the market, so you can trade at full risk, when the value is below 7, you trade with less risk or don't trade at all.
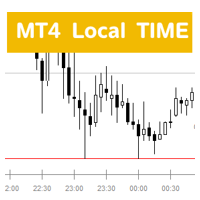
Description de l'Indicateur de Temps Local ( MT4 Local Time H4box )
Présentation L'indicateur de temps local est un indicateur personnalisé conçu pour la plateforme MetaTrader 4 (MT4), visant à fournir aux utilisateurs l'heure locale actuelle de leur région. Cet indicateur est adapté aux traders du monde entier, leur permettant de consulter rapidement l'heure locale lors de leurs transactions sur le marché des changes, afin de mieux saisir les dynamiques du marché et les opportunités de t

Moving Pivot Average The pivot indicator compares the selected period with its counterpart from the previous period. The indicator uses very flexible algorithm for pivot value calculating. It allows you to allocate in days a certain time intervals (custom bars) and calculate the average pivot value based on High, Low and Close prices of these bars. How many custom bars will be taken into account is determined by the "Days" setting. The pivot line can be considered an average trend line and us

Determining the current trend is one of the most important tasks of a trader, regardless of the trading style. The Creative Trend indicator will help you do this with a fairly high probability. Creative Trend is a trend recognition indicator that uses the author's calculation algorithm. The indicator readings do not change under any conditions. The indicator is suitable for any currency pair, any timeframe, as long as there is enough historical data for calculations. Indicator Parameters
Main Se

- Real price is 60$ - 50% Discount ( It is 30$ now )
Contact me for instruction, any questions! Introduction Triangle chart patterns are used in technical analysis , which is a trading strategy that involves charts and patterns that help traders identify trends in the market to make predictions about future performance.
Triangle Pattern Scanner Indicator It is usually difficult for a trader to recognize classic patterns on a chart, as well as searching for dozens of charts and time f

Contact me for instruction, any questions! Introduction Chart patterns are an essential tool traders and investors use to analyze the future price movements of securities. One such pattern is the triple bottom or the triple top pattern, which can provide valuable insights into potential price reversals. This pattern forms when a security reaches a low price level three times before reversing upward or reaches a high price level three times before reversing downward.
Triple Top Bottom P
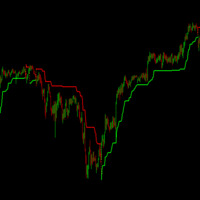
The classic SuperTrend indicator. The best indicator to define trends and small-scale trend changes in any pair and time frame. It is set up in exactly the same way as the TradinView indicator, and can be adjusted and complemented with other indicators to create profitable strategies or expert advisors, or used individually to profit from the market. Based on the average volatility of the last candles and the price movement, it draws a green line below the price if an bullish microtrend is ident
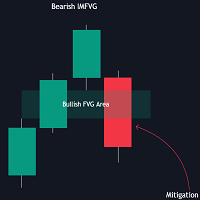
The FVG Instantaneous Mitigation Signals indicator detects and highlights "instantaneously" mitigated fair value gaps (FVG), that is FVGs that get mitigated one bar after their creation, returning signals upon mitigation.
Take profit/stop loss areas, as well as a trailing stop loss are also included to complement the signals.
USAGE Figure 1 Instantaneous Fair Value Gap mitigation is a new concept introduced in this script and refers to the event of price mitigating a fair value gap one
Découvrez comment acheter un robot de trading sur le MetaTrader Market, le magasin d'applications de la plateforme MetaTrader.
e système de paiement de MQL5.community prend en charge les transactions via PayPal, les cartes bancaires et les systèmes de paiement populaires. Nous vous recommandons vivement de tester le robot de trading avant de l'acheter, pour une meilleure expérience client.
Vous manquez des opportunités de trading :
- Applications de trading gratuites
- Plus de 8 000 signaux à copier
- Actualités économiques pour explorer les marchés financiers
Inscription
Se connecter
Si vous n'avez pas de compte, veuillez vous inscrire
Autorisez l'utilisation de cookies pour vous connecter au site Web MQL5.com.
Veuillez activer les paramètres nécessaires dans votre navigateur, sinon vous ne pourrez pas vous connecter.