Indicadores técnicos de pago para MetaTrader 4 - 105

* Pivot Points Magic: Niveles de pivote sin esfuerzo en cualquier gráfico**.
Pivot Points Magic simplifica el proceso de identificación de los niveles críticos de pivote en cualquier gráfico, en todos los plazos. Con unos pocos clics, los operadores pueden visualizar al instante los puntos pivote, lo que les permite tomar decisiones más informadas.
¡Valoramos sus comentarios! Comparta su experiencia con Pivot Points Magic y ayúdenos a mejorar. Sus comentarios y sugerencias son esenciales para

El indicador KeyLevels Pro es una potente herramienta diseñada para identificar niveles significativos de soporte y resistencia basados en pivotes de máximos y mínimos en la acción del precio. Este indicador es perfecto para los operadores que se basan en la estructura del mercado y en los niveles de precios clave para tomar decisiones de negociación informadas. Cuenta con parámetros personalizables, detección automática de puntos pivote y representación visual de los niveles clave con etiquetas

El indicador "Sharp Scalper" es una herramienta de negociación de alta frecuencia diseñada para operaciones rápidas y a corto plazo en el mercado de divisas. Se centra en identificar el movimiento rápido de los precios y generar señales para la mejor entrada. Este indicador es conocido por su capacidad para capturar pequeñas oportunidades de beneficio varias veces a lo largo del día, lo que lo hace ideal para los scalpers que buscan sacar provecho de la volatilidad del mercado. El indicador "sha

Esta es una Halftrend Scalper para MT4. Destinado a mercados oscilantes con buena volatilidad. No es adecuado durante la baja volatilidad. Características:
Espere a que el precio cruce la línea de media tendencia. Seleccione que media tendencia HTF (Señal Principal) Compruebe la alineación de la media tendencia entre los marcos temporales superiores. Comprobar Barra de Alto Volumen (Opcional) Tendencias de media tendencia apiladas (Opcional) Qué hay en el Paquete de Descargas Extras:
- HT Scalp

El 10PIPS Dynamite es un indicador de Forex de vanguardia semi-automatizado diseñado para revolucionar automáticamente sus habilidades de negociación de ser un trader perdedor a convertirse en un trader rentable simplemente por Scalping 10 pips por configuración de comercio generado por el software. 10PIPS Dynamite Indicador una vez conectado en el gráfico principal se inicia un análisis en profundidad del mercado basado en su único algoritmo avanzado incorporado que combina a la perfección los

El Canal TMA es un canal de precios obtenido mediante un método de cálculo especial basado en el TMA tradicional . El canal tiene sendas superior, media e inferior . Cuando el precio se aproxima o supera la pista superior, ya se encuentra en un estado de sobrecompra, y se debe prestar atención a la situación de reversión y descenso; Cuando el precio se aproxima o cae por debajo de la pista inferior, ya se encuentra en un estado de sobreventa, y se debe prestar atención a la situación de reversió

El indicador del autor se basa en líneas horizontales e inclinadas ajustadas automáticamente a partir de puntos significativos del mercado. En los ajustes puede especificar el período, el color y el grosor de las líneas, desactivar o activar las líneas inclinadas y varios otros ajustes gráficos.
Reglas recomendadas para entrar en el mercado:
Utilizando la VENTA como ejemplo:
Coloco una orden pendiente para un breakout - stop de venta por debajo de la línea horizontal del indicador, luego con

Enlace de descarga del manual de usuario: https://ontrd.com/our-books/
Para todos los que preguntan sobre el indicador ON Comercio Numerología Estación Se obtienen alrededor de 16 estrategias de numerología que hacen juntos unidad completa de control de su comercio . Estrategias básicas para trabajar con él son 3 estrategias estadísticas sobre ellos son los siguientes : 1. RBA niveles tasa de éxito más de 95%. 2. FF más del 96 3.RBA SOL 98% No vamos a decir 100%, ya que son ... Ratio tasas como

El indicador de tendencia Onion es una revolucionaria solución de negociación de tendencias y filtrado de datos de mercado que combina todas las características importantes de una herramienta de tendencias en una sola herramienta. Es ideal para cualquier operador, ya sea de Forex o de opciones binarias. No requiere ajustes, todo está optimizado por el tiempo y la experiencia, funciona eficazmente tanto en condiciones planas como en condiciones de tendencia.
El indicador de tendencia Onion es u

Utilizando el algoritmo del indicador Likdon Forex, puede determinar rápidamente la tendencia actual del mercado. El indicador Elephant sigue las tendencias a largo plazo y puede utilizarse sin restricciones de instrumentos o plazos. Con su ayuda, usted puede tratar de predecir los valores futuros de los precios, pero su principal objetivo es generar señales de compra y venta.
El indicador sigue la tendencia del mercado, ignorando las fluctuaciones bruscas y el ruido del mercado en torno al pr
El indicador LewshaGen es una herramienta de análisis técnico utilizada en el mercado Forex. Ayuda a los operadores a tomar decisiones sobre cuándo entrar o salir de una operación basándose en el análisis de los datos del mercado. Veamos cómo funciona y por qué puede ser útil.
Cómo funciona el indicador LewshaGen : Análisis de Tendencias: El indicador analiza los datos del gráfico e identifica los puntos de inflexión y las tendencias clave del mercado. En el gráfico anterior, puede ver cómo el

El indicador Dreadnought analiza cuidadosamente la dinámica de los precios, identificando el debilitamiento temporal de la tendencia y los cambios bruscos en su dirección. Controlando este indicador, podrá advertir fácilmente los cambios en el mercado y tomar las medidas oportunas. Entrar en el mercado puede ser fácil, pero mantener una posición es mucho más difícil. Con Dreadnought, dispondrá de un apoyo fiable para adelantarse con éxito a la tendencia. Este indicador analiza los datos históri

Mysterium es un indicador de canal sin redibujado, que se basa en el doble suavizado de las medias móviles. A diferencia de los indicadores de canal como Bollinger, Mysterium utiliza medias móviles con doble suavizado. Esto permite determinar con mayor precisión la dirección del movimiento del mercado, aunque reduce la sensibilidad del indicador. Sin embargo, el doble suavizado proporciona una visualización más clara y estable de los canales en el gráfico, lo que ayuda a los operadores a tomar d
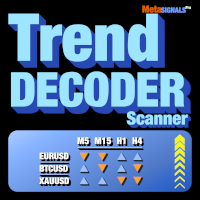
Obtenga señales de TrendDECODER para varios activos y varias unidades de tiempo | Determine la mejor unidad de tiempo para entrar | Maximice sus beneficios y operaciones ganadoras Indicador y escáner sin repintado y sin retrasos - ideal para el comercio manual y automatizado - para todos los activos y todas las unidades de tiempo 49$ para las primeras 50 copias - luego 99$ Después de su compra, por favor, deje un comentario o una reseña y le enviaremos un indicador EXTRA valorado en 99$.
¿De

Volatility Range es un indicador que calcula el rango de volatilidad, prediciendo niveles clave como la resistencia potencial por encima y el soporte potencial por debajo. El indicador puede mostrar rangos de previsión de volatilidad para los últimos 50 días, 10 semanas o 4 meses. Al observar estos rangos, puede identificar mejor los niveles fiables, donde la combinación con la acción del precio mejora significativamente la precisión de las operaciones.
Tiene la opción de rellenar el área del

Price Action Scanner es un indicador que identifica el comportamiento de los precios y proporciona alertas. Este indicador puede detectar simultáneamente señales de hasta 6 símbolos diferentes en varios marcos temporales. Estableciendo un separador, puede añadir diferentes nombres de símbolos y marcos temporales.
El indicador puede detectar múltiples tipos de señales comunes como Pinbar, Engulfing Pattern, Inside Bar, Morning Star, Evening Star, Fakey, y mostrar la información correspondiente

Price Action Scanner Pro es un indicador que identifica comportamientos de precios y proporciona alertas, ofreciendo más características y personalización en comparación con Price Action Scanner ( https://www.mql5.com/zh/market/product/118937?source=Site+Profile+Seller ) . Este indicador puede detectar simultáneamente señales de hasta 15 símbolos en diferentes marcos temporales. Puede configurarlo para detectar señales durante sesiones de negociación específicas, como las sesiones asiática, eur

El indicador Tendencia Radiante calcula los niveles de saturación del gráfico de precios. Una señal de salida de la zona de sobreventa indica una compra, y una señal de salida de la zona de sobrecompra indica una venta. Para este indicador, suele ser necesario establecer valores relativos para los niveles de sobrecompra y sobreventa: Bottom y Top.
A menudo, una buena tendencia puede apreciarse visualmente en el gráfico de precios. Sin embargo, un operador experimentado debe comprender claramen

El Detector de Patrones de Velas es un indicador avanzado de MetaTrader 4 diseñado para identificar y resaltar patrones de velas en sus gráficos. Actualmente, el indicador detecta un patrón de velas específico: la pinbar, conocida por su importancia en el análisis técnico y las estrategias de negociación. Esta herramienta proporciona a los operadores señales visuales, lo que facilita la detección de posibles retrocesos o continuaciones del mercado. Características: Colores personalizables: Los u
Trabajar con el indicador Channel Motion Tracker es de lo más sencillo. Basta con reaccionar a las flechas que muestra el indicador. Cada flecha representa una orden explícita a la acción. Las señales generadas por este indicador son lo suficientemente precisas como para permitirle operar basándose en esta información.
Una de las principales ventajas del indicador es su capacidad para construir canales de alta calidad y generar señales para entrar en el mercado. Esto es genial para el trader q

El indicador Geliosx está diseñado para mostrar visualmente la tendencia. Una de las tareas clave a la hora de supervisar el mercado de divisas es determinar la tendencia, es decir, una dirección estable del movimiento de los precios. Geliosx utiliza cálculos especiales para suavizar las fluctuaciones bruscas que no tienen un impacto significativo en la imagen general del movimiento de los precios.
Este indicador se ha creado para quienes valoran su tiempo y su dinero.
La tendencia puede ser

Niveles de soporte y resistencia es un indicador inteligente que muestra niveles horizontales de soporte y resistencia, adecuado para operadores de distintas frecuencias de negociación. Puede seleccionar la frecuencia de negociación que prefiera y el indicador calculará automáticamente los niveles de soporte y resistencia correspondientes a esa frecuencia. Entre ellos, la Línea Toro-Oso es un intervalo utilizado para distinguir la fuerza de los alcistas y los bajistas, y es un nivel importante.

Descripción del producto: Indicador de Patrón de Precisión para Ganancias Consistentes Eleve sus operaciones con el Indicador de Patrón de Precisión, una herramienta avanzada diseñada para detectar un patrón de operación altamente rentable y específico. Este indicador es la clave para obtener beneficios constantes con el mínimo esfuerzo. Características principales: Señales de entrada precisas: Reciba señales de entrada claras con flechas verdes para las oportunidades de compra y flechas rojas p

El algoritmo del indicador de divisas Arriator le permite determinar rápidamente la tendencia actual del mercado. El indicador Elephant acompaña las tendencias a largo plazo y puede utilizarse sin restricciones de instrumentos o plazos. Este indicador no sólo ayuda a predecir valores futuros, sino que también genera señales de compra y venta. Sigue las tendencias del mercado, ignorando las oscilaciones salvajes y el ruido del mercado en torno al precio medio. El indicador aplica un tipo de análi

RECORDATORIO: Descuento para los primeros compradores: Precio sujeto a aumento después de las primeras 20 copias. El precio inicial es de 65 $ y el precio final será de 1275 $. Asegúrese ahora su ejemplar con descuento!
Smart Money Analyser Indicador Manual de Usuario
1. Introducción Bienvenido al Smart Money Analyser Indicator Esta potente herramienta proporciona a los operadores un análisis exhaustivo del mercado mediante la combinación de varios indicadores técnicos para generar señales de

El indicador Sirius X sigue con fiabilidad las tendencias del mercado, ignorando las oscilaciones bruscas y el ruido del mercado. Adecuado para operar en cualquier marco temporal, filtra eficazmente los picos y las correcciones repentinas de los precios reduciendo el ruido del mercado en torno al precio medio. Para los cálculos, el indicador utiliza iLow, iHigh, iMA e iATR. La salida basada en estos fiables indicadores también es fiable. Puede configurar una señal sonora y notificaciones, por e
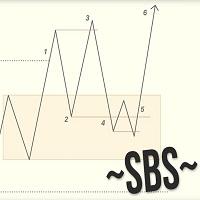
Swing Breakout Sequence | SBS presenta una estrategia de negociación integral diseñada para ayudar a los operadores a identificar y capitalizar las oscilaciones y rupturas del mercado. La estrategia Swing Breakout Sequence (SBS) se basa en una serie de pasos bien definidos para optimizar las decisiones de trading y mejorar la rentabilidad. Versión 2.01: Añadida "entrada dorada" - entrada por fibo. Estoico añadido a la misma (fibo) que él llama a esta configuración de oro SBS aquí está el video l

Indicador Gann Retracements Octaves Mejore su estrategia de negociación con el indicador Gann Retracements Octaves , meticulosamente diseñado para integrar las teorías de Gann con el análisis técnico moderno. Este indicador personalizado le proporciona niveles de retroceso precisos basados en las octavas de Gann, ayudándole a identificar niveles clave de soporte y resistencia, así como posibles puntos de reversión en el mercado. Características principales: 24 Búferes de Indicador : Rastrea múlt
FX Strength Meter Pro es un poderoso indicador diseñado para traders que buscan oportunidades óptimas de trading en el mercado de divisas. Nuestro indicador muestra en tiempo real la fuerza relativa de los principales pares de divisas (USD, EUR, GBP, CHF, AUD, NZD, JPY, CAD), ayudándote a identificar rápidamente las monedas más fuertes y débiles para mejorar tu estrategia de trading.
Las características principales incluyen:
- Soporte multi-timeframe: Desde gráficos de minutos hasta mensuales
El indicador MTFMA (Multi-Timeframe Moving Averages) utiliza múltiples medias móviles (MA) en diferentes marcos de tiempo para proporcionar señales de compra y venta (que no repintan) en una ventana separada del gráfico principal. Es versátil y fácil de interpretar, adecuado tanto para scalping en marcos de tiempo pequeños como para trading a más largo plazo en marcos de tiempo mayores.
¿Por qué es Multiframe?
El término multiframe se refiere a la capacidad del indicador de utilizar y combina
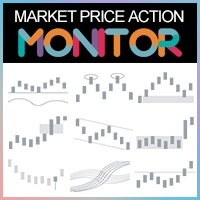
Por qué necesito utilizar el Monitor PA de Mercado:.
1.Es imposible monitorizar múltiples variedades y múltiples TF del mercado.
La situación del mercado está en constante cambio, con numerosas variedades, y cada variedad tiene diferente marco de tiempo de pequeño a grande. Cada TF contiene diferentes cambios de mercado y alternancias de tendencia. Bajo numerosas variedades y múltiples TFs, hay innumerables oportunidades de trading cada día. Sin embargo, un trader normal no puede detectar las

Suscríbase al canal MA7 Trading para recibir notificaciones sobre nuevos programas, actualizaciones y otra información. Haga preguntas en el perfil en el MQL5 .
Descripción del trabajo El indicador MA7 Moss se basa en el indicador estándar Accelerator Oscillator (AC). Muestra las zonas de sobrecompra y sobreventa. Información detallada sobre el indicador MA7 Moss .
Ajustes del indicador Ajustes generales: Nivel superior ; Nivel inferior .
Ajustes de mensajes: Enviar mensaje al terminal (Aler

Golden Range 2 es uno de los mejores indicadores de entrada asegurando su futuro con sus resultados. Configuración del indicador: Puntos = cuán precisa es la detección de patrones AlertConfirmation = activar(true) desactivar(false) la alerta CalculatedBars = cuántas barras se calcularán
Por favor, deje comentarios positivos, opiniones. Buffer 0 Flecha de Compra, Buffer 1 Flecha de Venta, Buffer2 Señal de Compra(Valor:1/0), Buffer3 Señal de Venta(Valor:1/0) Comprar Verde, Vender Rojo

Indicador NextCandlePredictor NextCandlePredictor, una indicador del tipo señal con alerta que no repinta, no cambia su color, no se mueve, no desaparece y no tiene lag. Te ayudará a identificar la dirección de la próxima o próximas velas en cualquier marco temporal. Es altamente recomendado para mercados de alta volatilidad, como Nueva York, Londres o incluso el solapamiento de ambos.
Características Principales: Versatilidad en Timeframes : Proporciona señales rápidas y precisas en cualquier

Indicador de ángulos de Gann El indicador de ángulos de Gann es una potente herramienta técnica basada en la teoría de William Delbert Gann. Ayuda a los operadores a identificar posibles niveles de soporte y resistencia, así como la dirección de la tendencia en varios intervalos de tiempo. Principales características: Determinación automática del extremo dentro de un intervalo de tiempo especificado Construcción de 9 líneas de abanico de Gann con ángulos de 82,5, 75, 71,25, 63,75, 45, 26,25

Deshágase de la confusión del trading y disfrute de unos ingresos estables. ¿Sigue preocupado por encontrar un método de ganancias estables y de bajo riesgo? ¿Todavía le preocupa juzgar la dirección del mercado y controlar el riesgo de colocar órdenes? ¡El nuevo indicador de arbitraje multiplataforma le ayuda a conseguir fácilmente ingresos estables! Capture con precisión las oportunidades de arbitraje sin tener que preocuparse. El indicador de arbitraje entre plataformas es una potente herramie

El indicador "MultiSymbol & TF Chart Integrated" está diseñado para proporcionar una visión completa del mercado rápidamente, permitiéndote monitorear hasta 60 pares de divisas en los marcos de tiempo que prefieras en un solo gráfico (modo multiple) o ver el par en el que estamos operando en todos los TF (modo simple).
Ventajas Principales : Monitoreo Completo : Permite monitorear en tiempo real y de un vistazo todos los pares deseados en un solo gráfico. Ahorro de Tiempo : Evita la necesidad

Indicador de bandas de ondas de Fibonacci El indicador de bandas de ondas de Fibonacci utiliza los coeficientes de Fibonacci para crear bandas dinámicas en torno a una media móvil central. Estas bandas se derivan de ratios de Fibonacci clave (normalmente 38,2%, 50%, 61,8%) y se adaptan a la volatilidad del mercado, ofreciendo información sobre posibles zonas de soporte y resistencia. Características principales: Niveles Fibonacci: El indicador traza múltiples bandas por encima y por debajo de un
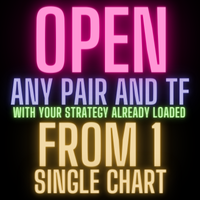
¿Estás cansado de cambiar entre múltiples gráficos para monitorear diferentes pares de divisas y marcos de tiempo? ¡El indicador Pairs and TF Changer está aquí para revolucionar tu experiencia de trading! Una vez que hayas cargado todos los indicadores para tu estrategia, agrega Pairs and TF Changer al gráfico. Si es necesario, puedes ajustar su posición, colores o el número de columnas que muestra. Características principales: Integración sin interrupciones: Integra este indicador en tu estrate
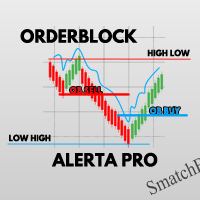
ALERTA OrderBlock PRO
OrderBlock ALERTA PRO es la herramienta definitiva para identificar los mejores puntos de entrada al mercado financiero. Con él encontrarás los puntos de equilibrio ideales para las órdenes, detectando cuándo comenzará a aumentar la liquidez al romper la estructura alcista o bajista. Reciba notificaciones PUSH directamente en su Meta Trader, manteniéndolo siempre informado.
Además, OrderBlock ALERTA PRO identifica las zonas HIGH LOW (HL) y LOW HIGH (LH), proporcionándole

Misio - puede utilizarse como un sistema de negociación independiente. El indicador determina la tendencia del mercado, ignorando las fluctuaciones bruscas y el ruido en torno al precio medio. Muestra el movimiento tendencial con posibles puntos de parada.
Uso sencillo, claro y eficaz. El indicador no se redibuja y no se retrasa. Adecuado para todos los pares de divisas y todos los plazos.
Interpretación:
La ubicación de la tasa por encima o por debajo de las sombras indica la presencia de u

Determinar la tendencia actual es una de las tareas más importantes de un operador, independientemente del estilo de negociación. El indicador Gravity Trend le ayudará a hacerlo con una probabilidad bastante alta.
Gravity Trend es un indicador de reconocimiento de tendencia que utiliza el algoritmo de cálculo del autor. Las lecturas del indicador no cambian bajo ninguna condición. El indicador es adecuado para cualquier par de divisas, cualquier marco de tiempo.
Parámetros del indicador Parám
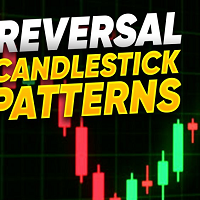
El indicador Reversal Candlestick Structure detecta en tiempo real múltiples patrones de velas que se producen cuando es más probable que las tendencias experimenten una inversión. El método de detección de inversiones incluye varios ajustes que permiten a los usuarios ajustar el algoritmo de detección de inversiones con mayor precisión.
También se incluye un panel que muestra el porcentaje de patrones detectados como inversiones. USO Figura 1 Los patrones de velas son omnipresentes para lo

Indicador de patrones de velas para MetaTrader 4 (MT4) Este indicador personalizable identifica patrones clave de velas alcistas y bajistas, ayudando a los traders en el análisis técnico y la toma de decisiones. Características principales: Detección de patrones : Alcistas : Martillo, Envuelven alcista, Estrella de la mañana, Tres soldados blancos, Harami alcista, Martillo invertido. Bajistas : Estrella fugaz, Envuelven bajista, Estrella de la tarde, Tres cuervos negros, Harami bajista, Hombre c

El indicador "GoTrend Multi-Timeframe" es una herramienta imprescindible para los traders que buscan una forma rápida y eficiente de evaluar la tendencia general y específica de un par de divisas en diferentes marcos de tiempo. Este indicador permite a los traders obtener una visión clara y completa de la dirección del mercado con tan solo un vistazo, optimizando así su toma de decisiones y mejorando la efectividad de sus estrategias de trading. Características Principales: Análisis Multimarcos

Indicador oscilador de tendencia para el seguimiento de microtendencias y retrocesos. Determina incluso un pequeño cambio de tendencia . Le permite abrir posiciones en el momento oportuno de acuerdo con los cambios del mercado. Funciona en todos los plazos, todos los pares de divisas, metales, índices y criptodivisas. Se puede utilizar cuando se trabaja con opciones binarias. Características distintivas No se redibuja después del cierre de la vela; Detecta con precisión los cambios de tendencia;
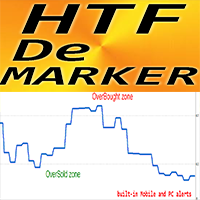
Indicador Crypto_Forex HTF DeMarker para MT4.
- Este indicador es una herramienta útil que utilizan los operadores técnicos para encontrar puntos de entrada y salida. HTF significa "marco temporal superior". - La línea del oscilador DeMarker indica la posición actual del precio en relación con los máximos y mínimos anteriores. - DeMarker proporciona las señales de divergencia regulares más eficientes entre otros osciladores. - La zona de sobrecompra es cuando el DeMarker está por encima de 0,7

Instalación MetaTrader 4 Descargar: Descargue el archivo proporcionado PrecisionStopDemo.ex4. Copie el archivo: Abra MetaTrader 4. En el menú superior, haga clic en Archivo > Abrir carpeta de datos. Navegue hasta MQL4 > Indicadores. Copie el archivo PrecisionStopDemo.ex4 en esta carpeta. Reinicie MetaTrader: Cierre y vuelva a abrir MetaTrader 4. Añada el indicador al gráfico: En el Navegador (Ctrl+N), expanda la carpeta Indicadores. Busque el indicador PrecisionStopDemo y arrástrelo al gráfico

Póngase en contacto conmigo para cualquier consulta o pedidos personalizados, si desea utilizar esto en un EA.
Características principales: Reconocimiento de Patrones : Identifica Gaps de Valor Justo (FVGs) Detecta puntos de ruptura de estructura (BOS) Detecta patrones de Cambio de Carácter (CHoCH) Aplicación versátil : Optimizado para gráficos de velas Compatible con cualquier tipo de gráfico e instrumento financiero Análisis en tiempo real e histórico : Funciona a la perfección tanto con dato

Indicador Perfil de Volumen para MT4 Obtén una ventaja en el trading con el indicador "Perfil de Volumen" para MetaTrader 4 (MT4). Esta herramienta avanzada de análisis técnico te permite identificar con precisión niveles clave de soporte y resistencia basados en el volumen de transacciones. Visualiza fácilmente las áreas de mayor interés del mercado, donde los volúmenes de negociación son más altos, y utiliza esta información para tomar decisiones de trading más informadas. Características prin

Insight Pro es una completa herramienta para el análisis de mercados. Ofrece diversas funciones, como análisis de tendencias, niveles de resistencia y soporte, y análisis de distribución, adecuadas tanto para operadores principiantes como experimentados. Características Análisis de tendencias Detecta y visualiza las tendencias del mercado. Sugiere posibles puntos de entrada y salida en función de las tendencias. Líneas de tendencia personalizables para una dirección clara del mercado. Muestra l
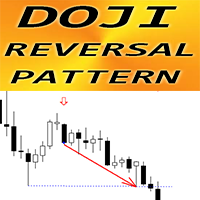
Indicador Crypto_Forex "Patrón de reversión Doji" para MT4.
- El indicador "Patrón de reversión Doji" es pura negociación de acción del precio: sin repintado, sin demora; - El indicador detecta el patrón de reversión Doji en el gráfico donde la vela Doji está en el medio del patrón y la última vela es la de ruptura: - Patrón de reversión Doji alcista: señal de flecha azul en el gráfico (ver imágenes). - Patrón de reversión Doji bajista: señal de flecha roja en el gráfico (ver imágenes). - Con
Presentación del "Color Range Indicator" El "Color Range Indicator" es una poderosa herramienta de análisis técnico diseñada para la plataforma MT4, ideal para traders que desean tener una visión clara e inmediata de las tendencias del mercado. Este indicador dibuja una línea de color en función de la tendencia actual, facilitando la interpretación de los movimientos de precios. Descripción del indicador: Línea verde : Indica una tendencia alcista. Utilice esta señal para considerar oportunidade
Trend Analyser Pro es una herramienta versátil de análisis de tendencias diseñada para operadores que desean sacar partido de las tendencias del mercado en múltiples marcos temporales. Este indicador combina la detección avanzada de tendencias, señales dinámicas y análisis de plazos más largos para ofrecerle una visión completa de los movimientos del mercado, lo que le permite tomar decisiones de trading bien informadas. 50% DE DESCUENTO - ¡FINALIZA PRONTO ! BONUS - Indicador Trend Analyser Pro
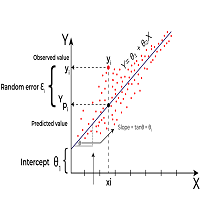
La regresión lineal es un método estadístico utilizado para modelizar la relación entre dos o más variables. El objetivo principal de la regresión lineal es predecir el valor de una variable (denominada variable dependiente o variable de resultado) a partir del valor de otra u otras variables (denominadas variables independientes o variables explicativas). La regresión lineal puede aplicarse al análisis técnico y, de hecho, es una de las herramientas que utilizan los operadores y analistas para
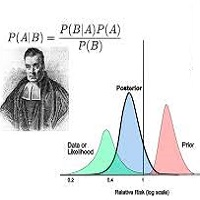
Los métodos bayesianos pueden aplicarse eficazmente para predecir las tendencias de los precios en los mercados financieros, incluidos el Forex, las acciones y las materias primas. A continuación se explica cómo pueden utilizarse las técnicas bayesianas para predecir tendencias: 1. Regresión lineal bayesiana La regresión lineal bayesiana puede utilizarse para modelizar la relación entre el tiempo y el precio. Este método permite incorporar creencias previas sobre la tendencia y la actualiza a me
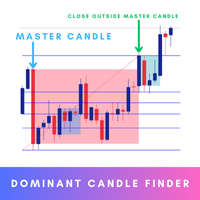
El Buscador de Velas Dominantes es una vela significativa en un gráfico de precios que destaca por su tamaño, volumen o movimiento del precio en comparación con las velas circundantes. A menudo indica una fuerte presión de compra o venta y puede utilizarse para identificar posibles puntos de reversión, rupturas o continuaciones en el mercado. Las velas dominantes pueden servir como indicadores clave para que los operadores tomen decisiones informadas, proporcionando información sobre el sentimi

Es un indicador que notifica vía notificación push cuando una orden es cerrada por Take Profit/Stop Loss Se indica a través de alerta pc y / o alerta móvil Psicológicamente puede mantener la orden durante mucho tiempo Si se produce la caza del stop loss puede volver a entrar con la misma dirección Si se produce una ruptura real, puede invertir la posición En general, avisa cuando la posición alcanza el nivel de stop loss o take profit .

Advance Currency Meter es un medidor de divisas que detecta las tendencias fuertes del mercado. Este indicador es bueno para scalping, trading intradía y swing trading. El indicador detectará las tendencias del mercado a corto y largo plazo. Esto le dará una buena idea de que las monedas son los mejores para el comercio a partir del momento.
Nota: Póngase en contacto conmigo antes de realizar cualquier compra. Esto no funcionará en su cuenta sin mi permiso. Nota : Funciona bien con mi medidor d
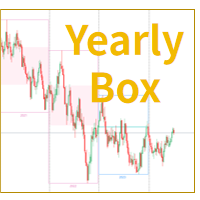
Indicador de cajas de velas anuales de MT4
El indicador "Caja de velas anuales" en la plataforma MetaTrader 4 es una herramienta de análisis de gráficos que muestra visualmente los movimientos de precios de un año dentro de una caja rectangular. Este indicador resalta los precios de apertura y cierre anuales al enmarcar el rango de precios y colorear el fondo. Los operadores pueden identificar y analizar fácilmente las fluctuaciones de precios anuales de un vistazo, utilizando el indicador de

Nuestro nuevo indicador es una parte importante del sistema Smart Money Concepts (SMC )
Utiliza una visión moderna del mercado y métodos de cálculo rápidos. Como resultado, el operador tiene una imagen completa de la operación en cada momento, lo que hace que el proceso de obtención de resultados sea más fácil y rápido.
Nuestro nuevo indicador muestra los siguientes patrones importantes:
Bloqueos de órdenes. Desequilibrio - Fair Value Gap (FVG). Ruptura de Estructuras (BoS). Cambio de carácter
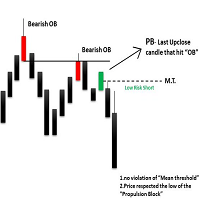
El indicador Bloques de Propulsión de ICT está pensado para detectar y destacar bloques de propulsión, que son estructuras de precios específicas introducidas por Inner Circle Trader (ICT).
Los Bloques de Propulsión son esencialmente bloques situados donde los precios interactúan con bloques de órdenes precedentes. Los operadores suelen utilizarlos cuando analizan los movimientos de los precios para identificar posibles puntos de inflexión y el comportamiento del mercado o áreas de interés en

Este indicador se basa en el Cboe EuroCurrency Volatility Index, también conocido como Euro VIX y tiene el símbolo EVZ . Básicamente mide la volatilidad en el tipo de cambio Eur/USD , pero se puede utilizar para realizar un seguimiento de la volatilidad general en el mercado Forex. Su mejor uso es añadirlo a su sistema como una herramienta obligatoria, cuando el valor está por encima de 7, puede esperar algún movimiento en el mercado, por lo que puede operar con todo el riesgo, cuando el valor e
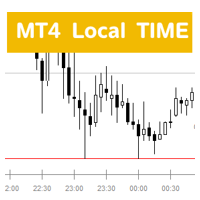
Descripción del Indicador de Hora Local ( MT4 Local Time H4box ) Visión General El Indicador de Hora Local es un indicador personalizado diseñado para la plataforma MetaTrader 4 (MT4), con el objetivo de proporcionar a los usuarios la hora local actual de sus respectivas regiones. Este indicador es adecuado para traders de todo el mundo, permitiéndoles visualizar rápidamente la hora local mientras realizan operaciones de forex, lo que les ayuda a comprender mejor la dinámica del mercado y

Media móvil pivotante El indicador de pivote compara el periodo seleccionado con su homólogo del periodo anterior. El indicador utiliza un algoritmo muy flexible para calcular el valor del pivote. Le permite asignar en días ciertos intervalos de tiempo (barras personalizadas) y calcular el valor pivote promedio basado en los precios Alto, Bajo y Cierre de estas barras. El número de barras personalizadas que se tendrán en cuenta viene determinado por el ajuste "Días". La línea de pivote puede co

Determinar la tendencia actual es una de las tareas más importantes de un operador, independientemente del estilo de negociación. El indicador Creative Trend le ayudará a hacerlo con una probabilidad bastante alta. Creative Trend es un indicador de reconocimiento de tendencia que utiliza el algoritmo de cálculo del autor. Las lecturas del indicador no cambian bajo ninguna condición. El indicador es adecuado para cualquier par de divisas, cualquier marco de tiempo, siempre y cuando haya suficient

- Precio real es de 60 $ - 50% de descuento ( es de 30 $ ahora )
¡Póngase en contacto conmigo para la instrucción, cualquier pregunta! Introducción Los patrones de gráficos triangulares se utilizan en el análisis técnico , que es una estrategia de negociación que implica gráficos y patrones que ayudan a los operadores a identificar las tendencias en el mercado para hacer predicciones sobre el rendimiento futuro .
Indicador Escáner de Patrones Triangulares Por lo general es difícil para un op

Póngase en contacto conmigo para recibir instrucciones, ¡cualquier pregunta! Introducción Los patrones gráficos son una herramienta esencial que los operadores e inversores utilizan para analizar los movimientos futuros de los precios de los valores. Uno de estos patrones es el triple fondo o el triple techo, que puede proporcionar información valiosa sobre posibles retrocesos de los precios. Este patrón se forma cuando un valor alcanza un nivel de precio bajo tres veces antes de revertir al al
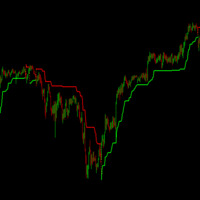
El indicador SuperTrend de toda la vida. El mejor indicador para definir tendencia y cambios de tendencia a pequeña escala en cualquier par y temporalidad. Está configurado exactamente de la misma forma que el indicador de TradinView, y puede ajustarse y complementarse con otros indicadores para crear estrategias o asesores expertos rentables, o usarse de forma individual para sacar beneficio al mercado. Basado en la volatilidad media de las últimas velas y en el movimiento del precio, traza una
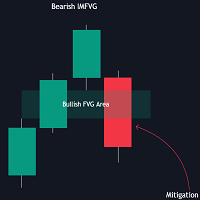
El indicador FVG Instantaneous Mitigation Signals detecta y destaca las brechas de valor razonable (FVG) mitigadas "instantáneamente", es decir, las FVG que se mitigan una barra después de su creación, devolviendo señales en el momento de la mitigación.
También se incluyen áreas de toma de beneficios/top loss, así como un trailing stop loss para complementar las señales.
USO Figura 1 La mitigación instantánea de la brecha de valor razonable es un nuevo concepto introducido en este script
MetaTrader Market ofrece a todos los desarrollador de programas de trading una sencilla y cómoda plataforma para ponerlos a la venta.
Le ayudaremos con la presentación y explicaremos cómo preparar la descripción de su producto para el Market. Todos los programas que se venden a través del Market están protegidos por una codificación adicional y pueden ser iniciados sólo en el ordenador del comprador. La copia ilegal es imposible.
Está perdiendo oportunidades comerciales:
- Aplicaciones de trading gratuitas
- 8 000+ señales para copiar
- Noticias económicas para analizar los mercados financieros
Registro
Entrada
Si no tiene cuenta de usuario, regístrese
Para iniciar sesión y usar el sitio web MQL5.com es necesario permitir el uso de Сookies.
Por favor, active este ajuste en su navegador, de lo contrario, no podrá iniciar sesión.