Rejoignez notre page de fans
- Vues:
- 6401
- Note:
- Publié:
- Mise à jour:
-
Besoin d'un robot ou d'un indicateur basé sur ce code ? Commandez-le sur Freelance Aller sur Freelance
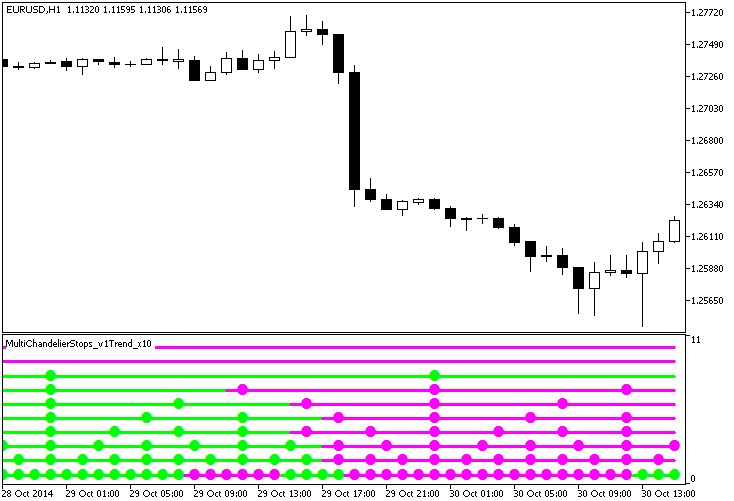
The MultiChandelierStops_v1Trend_x10 indicator shows information on current trends using the ChandelierStops_v1 indicator position from ten different timeframes.
Each of the ten indicator lines corresponds to a separate indicator. If the indicator line is positioned lower than the minimum price level, the lines are painted in light green, if it's higher than the maximum price level, the lines are painted in pink. Colored dots on lines appear when the bar of the corresponding timeframe changes.
The indicator requires ChandelierStops_v1.mq5 indicator file. Place it in <terminal_data_folder>\MQL5\Indicators.

Fig.1. The MultiChandelierStops_v1Trend_x10 indicator
Traduit du russe par MetaQuotes Ltd.
Code original : https://www.mql5.com/ru/code/13050
 Rainbow_HMA_HTF
The Rainbow_HMA indicator with the timeframe selection option available in the input parameters.
 Rainbow_HMA
Sixty Hull Moving Averages (HMA) with gradually changing period on a single chart.
 ChandelierStops_v1Trend_x10
The ChandelierStops_v1Trend_x10 indicator shows the ChandelierStops_v1 trend indicator position from ten different timeframes.
 ChangeOfVolatility_HTF
The ChangeOfVolatility indicator with the timeframe selection option available in the input parameters.