Golden section price action indicator
- Indicadores
- Versión: 1.60
- Actualizado: 22 septiembre 2022
- Activaciones: 5

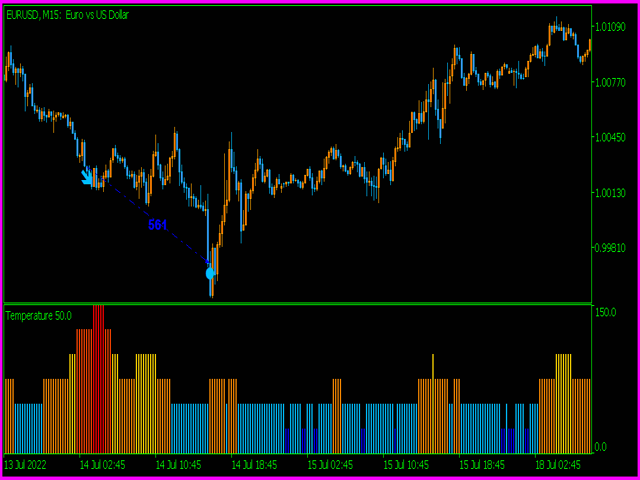
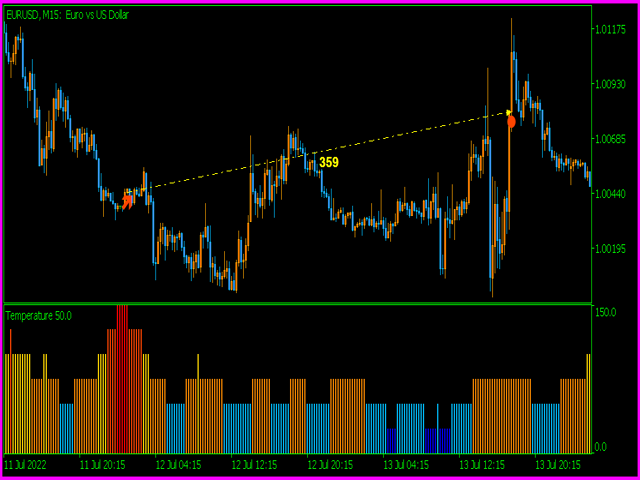
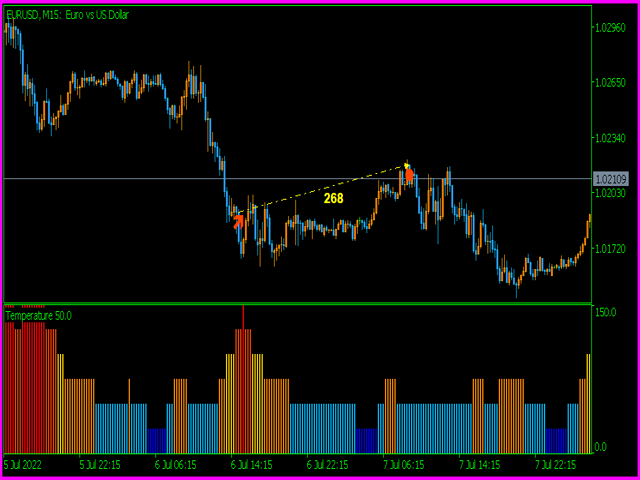
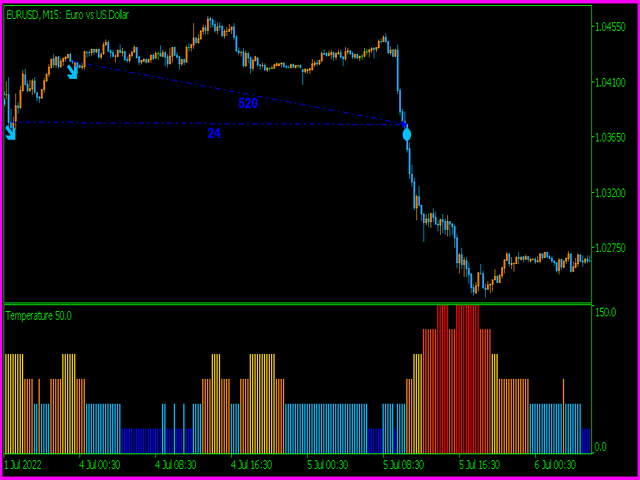
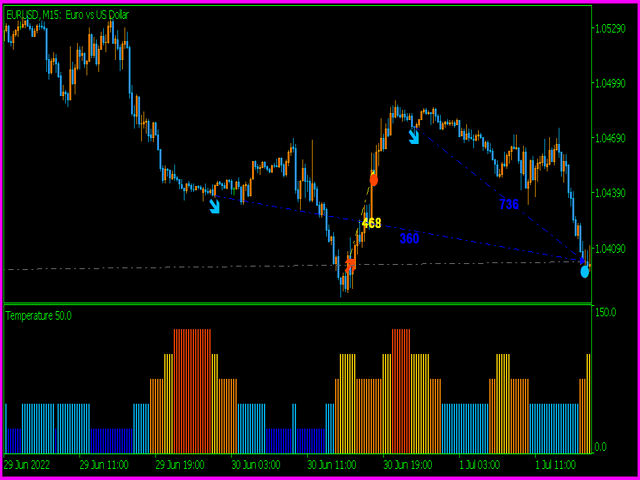
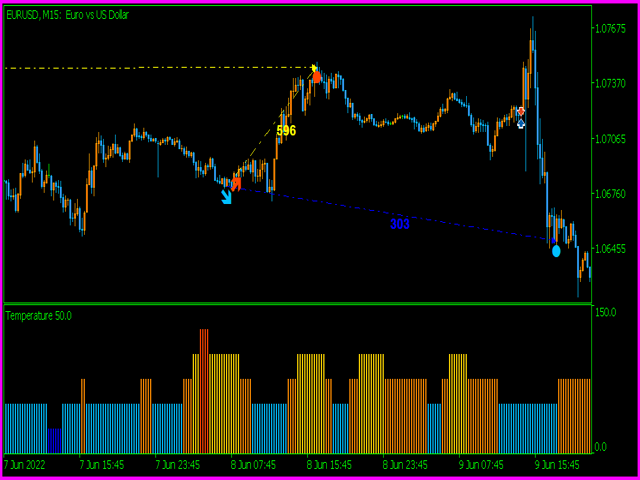
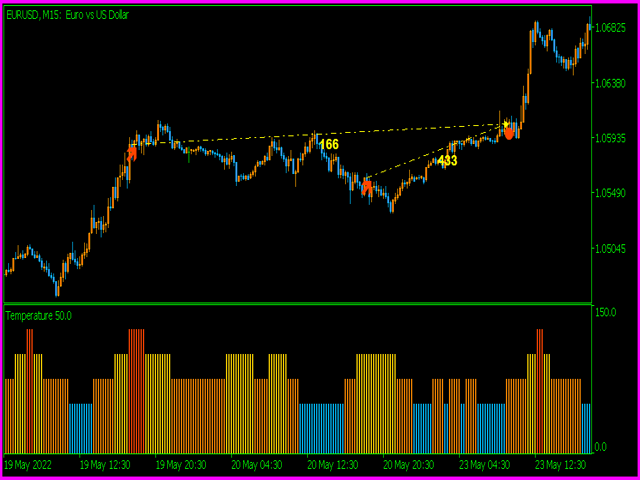
Indicador de la acción del precio de la sección de oro - es un sistema completo de la tendencia-escalada con los puntos de la entrada y de la salida. El indicador se basa en los patrones japoneses de acción de precios más poderosos que se filtran por volumen, volatilidad, fase de mercado. El patrón no es una simple combinación de velas. Los patrones deben tener "peso" para mover el mercado en la dirección correcta. "Peso" - es el resumen del volumen del patrón, el tamaño de las velas del patrón de acuerdo con la última volatilidad media y, por supuesto, el patrón debe aparecer en la fase correcta del mercado, excluyendo el falso mercado plano. Cuanto mayor sea la "temperatura" del mercado, más veraz será el patrón.
Características principales del indicador
- Las señales no se repintan, no se retrasan o desaparecen;
- Cada señal viene en la apertura de la nueva barra (el sistema utiliza sólo las señales confirmadas);
- Indicador tiene alertas, correo electrónico y notificaciones Push (permiten el comercio fuera de la PC, desde el teléfono inteligente / aplicación móvil);
- El sistema es 100% autoadaptive sin necesidad de ajuste manual. Sólo tiene que configurar y empezar a operar.
Recomendaciones para el comercio
- Scalping marcos de tiempo;
- EURUSD,GBPUSD,USDCAD,EURJPY;