KT CCI Alerts MT5
- Indicadores
-
KEENBASE SOFTWARE SOLUTIONS
 Visite nuestro sitio web para acceder a herramientas de trading gratuitas, tutoriales y guías detalladas de nuestros productos:
https://www.keenbase-trading.com - Versión: 1.0
- Activaciones: 5
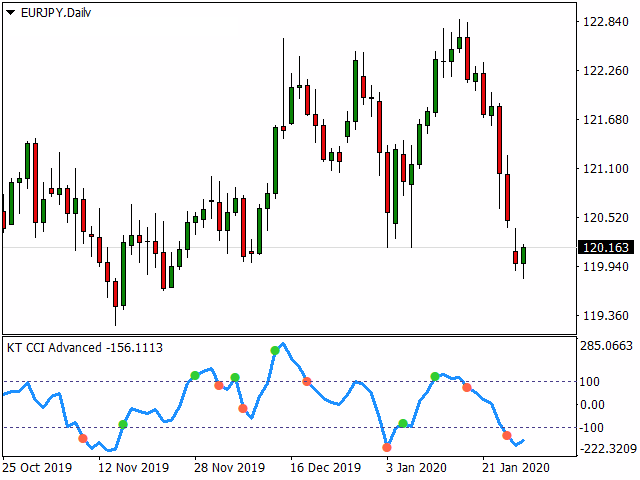
KT CCI Alerts es una implementación personal del oscilador Commodity Channel Index (CCI) que proporciona señales y alertas en cuatro eventos personalizados:
- Cuando el CCI entra en una zona de sobrecompra.
- Cuando el CCI sale de una zona de sobrecompra.
- Cuando el CCI entra en una zona de sobreventa.
- Cuando el CCI sale de una zona de sobreventa.
Características
- Una opción perfecta para los traders que especulan con los movimientos del CCI dentro de una zona de sobrecompra/sobreventa.
- Ligeramente codificado sin utilizar mucha memoria y recursos.
- Implementa todas las alertas de Metatrader.
Historia del Commodity Channel Index (CCI)
El CCI fue introducido por primera vez por Donald Lambert en 1980. Desde su introducción, el indicador ha crecido en popularidad y ahora es una herramienta muy común para los operadores en la identificación de tendencias cíclicas no sólo en materias primas, sino también en acciones y divisas. El CCI puede ajustarse al marco temporal del mercado en el que se negocia cambiando el periodo de promediación.