Candle Analysis MT5
- Indicateurs
-
Navdeep Singh
 The momentum of money is always more potent than the gravity of logic
Free or paid, All tools are coded with intention to help traders
My tools:- - Version: 1.0
- Activations: 10
50+ Candlestick Patterns, Simulated Trading Results, Top Five Performers
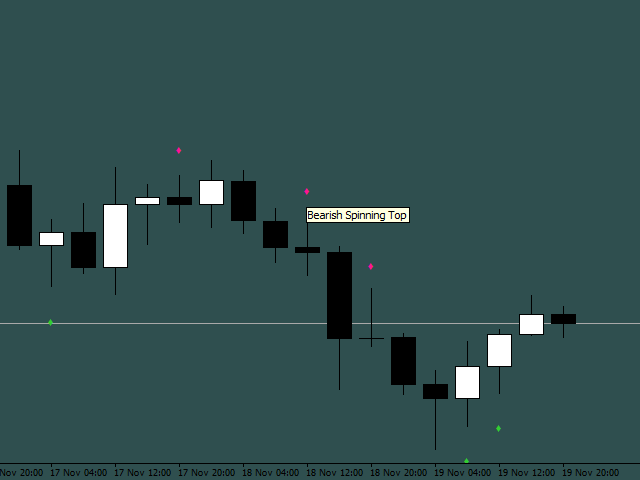
Candle Analysis extends Candlesticks Pattern Analysis by not only identifying Patterns but also recording the Past Performance of the Patterns.
What it Does:-
Identifies and plots results on chart
Displays Top Patterns for both Bullish and Bearish type.
Log can be printed in experts tab to see Simulated Trading results
Displays All or Selected Patterns
Alerts on Pattern formation
More detailed information in Blog