Stochastic Force MT5

Stochastic force is an advanced version of the stochastic oscillator. Instead of using the regular price a more efficient price data is provided as an input for the oscillator which takes into account the price efficiency, volume and market noise. Also price is pre-filtered with the selected average type and then post-filtered by a hull moving average which provides a smooth transition of the oscillator. It eliminates maximum false signals and has the potential to become an integral part of any technical trading system.

Main features

  • Multi-timeframe capability
  • A wide range of parameters for signals optimization
  • Alerts, emails and push notifications to mobile

Advantages

  • Easy to understand indicator for beginners
  • Reliable signals
  • Works on all instruments and timeframes
  • Non repainting tool
  • Generates minimum false signals

Recommended usage

Traders can use their own expertise in implementing this tool in their technical systems. The overbought and oversold levels can be used for timing potential trade entries. Examples of some reliable methods that show the capability of this tool are given below.

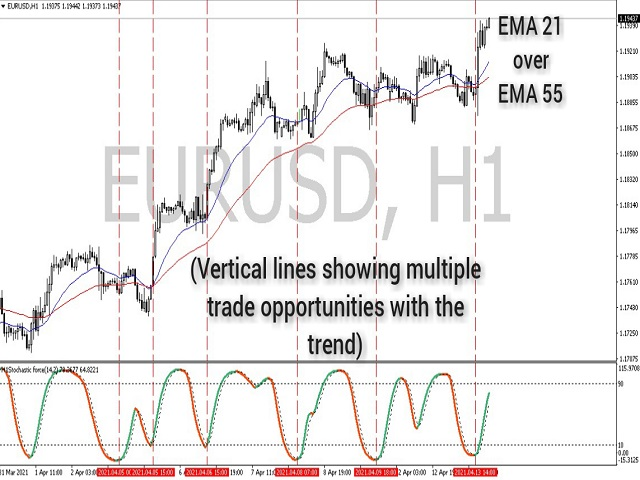
  • Example one shows the usage of two EMA's to identify trend and oversold levels of the indicator for buy signals. See Screenshot 1
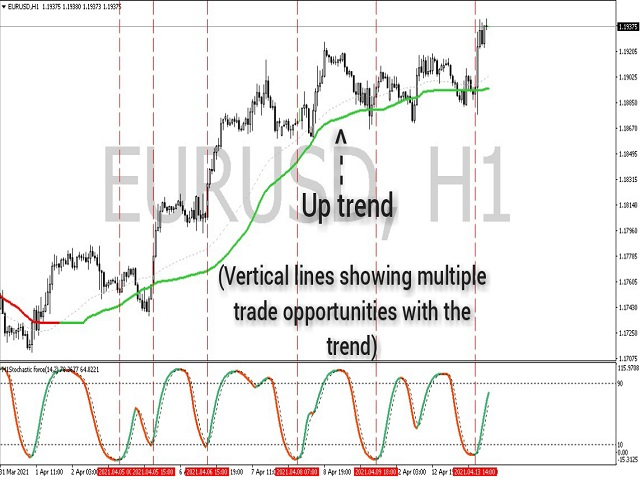
  • Example two shows the confluence of CMA and Stochastic Force to find potential trading entries. See Screenshot 2
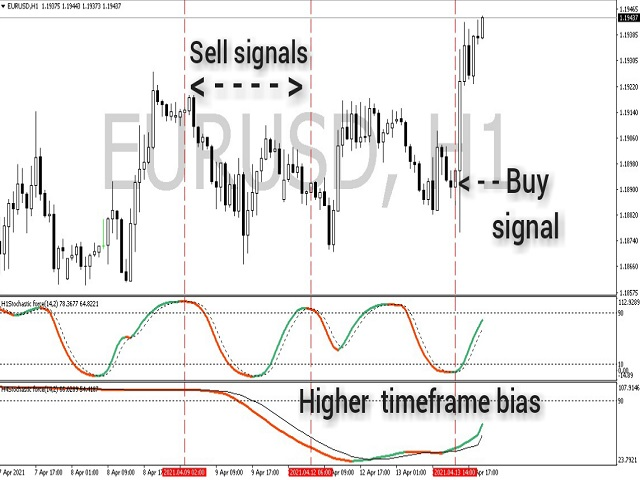
  • Example three shows how higher timeframe bias can be utilized in making confident decisions. See Screenshot 3

Produtos recomendados
KT Renko Patterns MT5
KEENBASE SOFTWARE SOLUTIONS
O KT Renko Patterns analisa o gráfico Renko tijolo por tijolo para identificar padrões gráficos conhecidos que são amplamente utilizados por traders em diversos mercados financeiros. Em comparação com gráficos baseados em tempo, os gráficos Renko tornam a identificação de padrões muito mais fácil e visualmente clara, graças à sua aparência limpa e objetiva. O KT Renko Patterns possui vários padrões Renko, muitos dos quais são explicados com profundidade no livro "Profitable Trading with Renko
Range Directional Force Indicator – Designed for You to Optimize! The Range Directional Force Indicator is a cutting-edge tool designed to empower traders by visualizing market dynamics and directional strength. Built to offer insights into market trends and reversals, this indicator is an invaluable asset for traders seeking precision in their strategies. However, it is important to note that this indicator is not optimized, leaving room for you to tailor it to your unique trading preferences.
A nova versão torna este indicador uma ferramenta completa para estudo, análise e operação de padrões probabilísticos. Suas funções incluem: Monitor de porcentagem de múltiplos ativos no gráfico. Martingales configuráveis. Vinte e um padrões pré-configurados, incluindo padrões Mhi e C3. Um editor de padrões avançado para armazenar até 5 padrões personalizados. Modo Backtest para testar resultados com relatório de perdas. Filtro de tendência. Filtro de hits. Opção de Ciclos de Martingale. Vários
Ichimoku Kinko Hyo é um sistema de gráficos de negociação de tendência que tem sido utilizado com sucesso em quase todos os mercados negociáveis. Ele é único em muitos aspectos, mas seu principal ponto forte é o uso de vários pontos de dados para dar ao trader uma visão mais abrangente e mais profunda no price action. Este ponto de vista mais profundo, e o fato de que Ichimoku é um sistema muito visual, permite que o comerciante possa discernir e filtra rapidamente "num piscar de olhos" as confi
RBreaker
Zhong Long Wu
RBreaker Gold Indicators é uma estratégia de negociação intradiária de curto prazo para futuros de ouro que combina duas abordagens: o seguimento de tendência e as reversões intradiárias. Ela permite capturar lucros durante mercados em tendência e também realizar lucros oportunamente e operar na direção oposta quando o mercado se reverte. Esta estratégia foi classificada por 15 anos consecutivos entre as dez estratégias de negociação mais lucrativas pela revista americana Futures Truth. Ela pos
Price Magnet — Price Density and Attraction Levels Indicator Price Magnet is a professional analytical tool designed to identify key support and resistance levels based on statistical Price Density. The indicator analyzes a specified historical period and detects price levels where the market spent the most time. These zones act as “magnets,” attracting price action or forming a structural base for potential reversals. Unlike traditional Volume Profile tools, Price Magnet focuses on price-time d
The Priority Argument indicator algorithm is based on standard indicators as well as its own mathematical calculations. The indicator will help users determine the direction of the trend. It will also become an irreplaceable advisor for entering the market or for closing a position. This indicator is recommended for everyone, both beginners and professionals. How to work: The implementation of the trend indicator is simple - in the form of lines of two colors. We buy when the indicator line c
Indicador Crypto_Forex "Cruzamento de Médias Móveis HTF" para MT5. - Aprimore seus métodos de negociação com o poderoso indicador Cruzamento de Médias Móveis HTF para MT5. HTF significa - período de tempo mais longo. - Este indicador é excelente para traders de tendências com entradas de Ação de Preço. - Ele permite anexar Médias Móveis Rápidas e Lentas de períodos de tempo mais longos ao seu gráfico atual --> este é um método profissional. - O Cruzamento de Médias Móveis HTF possui alertas in
Matrix Arrow EA MT5
Juvenille Emperor Limited
5 (7)
Matrix Arrow EA MT5  é um consultor especializado exclusivo que pode negociar os sinais de  MT5 do indicador de seta Matrix  com um painel de negociação no gráfico, manualmente ou 100% automaticamente. O  Matrix Arrow Indicator MT5  determinará a tendência atual em seus estágios iniciais, reunindo informações e dados de até 10 indicadores padrão, que são: Índice de movimento direcional médio (ADX), Índice de canal de commodities (CCI), Velas clássicas de Heiken Ashi, Média Móvel, Divergência de
Specialist E1
Slaven Kresic
Automatic Expert Advisor. Night scalp system, with trend detection and pullback entry. Dynamic exit signal, for SL or TP. Every trade has fix SL. No usage of risky strategies like martingale, hedge, grid etc. About EA Scalper strategy Technical strategy Can use with small deposits Pairs with best rezults: AUDNZD, AUDCAD, AUDCHF, EURAUD, GBPAUD, USDCHF, CADCHF, EURNZD, EURGBP, GBPCAD, GBPCHF, EURCHF Time Frame: M15 Recommendations Broker account with ECN and low spread Test it first to find out
Gyroscopes mt5
Nadiya Mirosh
5 (2)
Gyroscope        professional forex expert   (for EURUSD, GBPUSD, USDJPY, AUDUSD, USDCHF, EURGBP, EURJPY, NZDUSD, USDCAD, EURCHF, AUDJPY, CADJPY pairs)   alyzing the market using the Elliot Wave Index. Elliott wave theory is the interpretation of processes in financial markets through a system of visual models (waves) on price charts. The author of the theory, Ralph Elliott, identified eight variants of alternating waves (of which five are in the trend and three are against the trend). The mov
PipFinite EA Breakout EDGE MT5
Karlo Wilson Vendiola
5 (3)
The Official Automated Version of the Reliable Indicator PipFinite Breakout EDGE EA Breakout EDGE takes the signal of PipFinite Breakout EDGE indicator and manages the trade for you. Because of numerous financial instruments to consider, many traders want the signals to be fully automated. The EA will make sure all your trades are executed from entry to exit. Saving you time and effort while maximizing your profits. The Edge of Automation Effortless price action trading is now possible acros
Fibo Channels
Jeffrey Quiatchon
Fibo Daily Channel Indicator The  Indicator is a powerful tool for traders, providing precise daily support and resistance levels based on Fibonacci retracement and extension calculations. This indicator automatically draws key pivot points (PP, R1, R2, S1, S2) as well as additional extension levels (R3, R4, S3, S4), helping traders identify potential reversal and breakout zones with ease. It includes customizable alerts and push notifications, allowing traders to receive updates whenever the pr
PipFinite Breakout EDGE MT5
Karlo Wilson Vendiola
4.81 (93)
The Missing Edge You Need To Catch Breakouts Like A Pro. Follow a step-by-step system that detects the most powerful breakouts! Discover market patterns that generate massive rewards based on a proven and tested strategy. Unlock Your Serious Edge Important information here www.mql5.com/en/blogs/post/723208 The Reliable Expert Advisor Version Automate Breakout EDGE signals using "EA Breakout EDGE" Click Here Have access to the game changing strategy that will take your trading to the next l
Cyclone Intraday
Mikhail Mitin
5 (1)
How the EA works (simple explanation) Trades on M5 timeframe Uses H1 timeframe to analyze global market context Analyzes 2 or 3 timeframes simultaneously On each timeframe: Checks price position relative to one or two Moving Averages Evaluates MA angle and distance between price and MA Entry logic is based on trend + volatility conditions , not on random signals The full algorithm is illustrated in the screenshots. Recommended usage Symbol: EURUSD Timeframe: M5 Trading style: Intraday
Ichimoku Aiko MTF
Michael Jonah Randriamampionontsoa
Ichimoku Aiko MTF is a collection of technical indicators that show support and resistance levels, as well as momentum and trend direction. It is a multi-timeframe indicator so you don't need to change the chart timeframe when you want to see the ichimoku clouds on a higher timeframe.  eg. The chart timeframe is M15 and you want to see on the M15 timeframe chart the H1 ichimoku indicators (the ichimoku in Metatrader can't do that) that's why you need to use Ichimoku Aiko MTF.
As an experienced trader, it's crucial to have the right tools and resources to succeed in the market. Pro Trader EA offers a professional and efficient trading solution. With our innovative software, you can automate trading strategies, receive precise trading signals, and eliminate emotions. Pro Trader EA enables trading across multiple asset classes, offers real-time analytics, and a user-friendly interface. Our support team is available to answer any questions. Use Pro Trader EA to take you
The rubdfx divergence indicator is a technical analysis tool that compares a security's price movement. It is used to identify potential changes in the price trend of a security. The indicator can be applied to any type of chart, including bar charts and candlestick charts. The algorithm is based on MACD, which has been modified to detect multiple positive and negative divergences. Settings  ___settings___ * fastEMA * slowEMA * signalSMA *Alerts:   True/False     #Indicator Usage Buying :
SPECIAL LAUNCH OFFER: $30 (1-Month Rent) Limited time offer to build our community and gather feedback! AmbM GOLD Institutional Scalper A high-precision M5 algorithm for XAUUSD (Gold) , engineered to trade exclusively at Institutional Liquidity Levels ($5/$10 psychological marks). PERFORMANCE DATA (BUY ONLY) • Win Rate: 87.09%. • Safe Growth: +$4,113 profit on $10k (13.75% Max Drawdown). • Extreme Stress Test: Successfully generated +$22,997 in a 5-year stress test (2020-2026), proving
Bneu AI Impulse Pro
Marvinson Salavia Caballero
Bneu AI Impulse EA — Neural Impulse Scalper Tired of missing explosive moves on Gold and Crypto? Most scalpers react too late or get faked out by noise. Impulse EA detects explosive price moves in real time. 4-component impulse detection: breakout + single-bar + multi-bar + volume spike. 7-layer filter engine blocks weak signals before entry. AI cloud engine validates every impulse before execution. Designed for XAUUSD, BTCUSD, and ETHUSD on M1-M15. WHAT IT DOES Detects and trades
Stormer RSI 2
Ricardo Rodrigues Lucca
A estratégia do robô é baseada na ensinada pelo Stormer. Segue a explicação da mesma: Quando o RSI fica abaixo de 25, compramos nos últimos 15 minutos do pregão a mercado e o stop de ganho fica na maior máxima dos dois últimos dias. Sendo o mesmo movimentado até ser atingido ou ir para baixo da entrada (quando encerramos a posição a mercado, independente de termos atingido o número máximo de dias). Como utilizo? Configura o Lote e configure a hora e minuto que o EA deve operar. O mesmo só se
Chỉ báo này sẽ thông báo cho bạn nếu cấu hình xu hướng thành công. Tín hiệu theo xu hướng không nên được tăng theo, nhưng tín hiệu mua ở mức giá thấp theo mô hình giao dịch thông thường của bạn, hoặc tín hiệu bán ở mức giá tốt, là một lựa chọn rất tốt. Hãy thiết lập nó trên khung thời gian lớn hơn và theo dõi các khung thời gian nhỏ hơn, bám sát các xu hướng chính. Tôi thường thiết lập ba khung thời gian gần nhau nhất và không bao giờ đi ngược tín hiệu của INdicator này. INdicator   này không có
Isto baseia-se Na média de cruzamento e seta EM movimento DUPLO Ao abrigo Da preparação de indicadores personalizados EA. Quando a seta Azul aparecer, faça UMA longa ordem. Quando a seta vermelha aparecer, diminua a ordem. Quando a Linha Rosa atravessa a Linha Verde para cima, a Linha Rosa está acima, a Linha Verde está abaixo, o garfo dourado aparece, e a seta Azul aparece. Quando a Linha Rosa atravessa a Linha Verde para baixo, a Linha Rosa está abaixo e a Linha Verde está acima. Há um ga
Renko System
Marco Montemari
This indicator can be considered as a trading system. It offers a different view to see the currency pair: full timeless indicator, can be used for manual trading or for automatized trading with some expert advisor. When the price reaches a threshold a new block is created according to the set mode. The indicator beside the Renko bars, shows also 3 moving averages. Features renko mode median renko custom median renko 3 moving averages wicks datetime indicator for each block custom notification
O indicador SMC Venom Model BPR é uma ferramenta profissional para os traders que trabalham com o conceito Smart Money (SMC). Identifica automaticamente dois padrões principais no gráfico de preços: FVG   (Fair Value Gap) é uma combinação de três velas, em que existe um gap entre a primeira e a terceira velas. Forma uma zona entre níveis onde não há suporte de volume, o que geralmente leva a uma correção de preço. BPR   (Balanced Price Range) é uma combinação de dois padrões FVG que formam uma
The Bitcoin Reaper
Profalgo Limited
3.71 (34)
PROMOÇÃO DE LANÇAMENTO: Apenas um número muito limitado de cópias estará disponível pelo preço atual! Preço final: 999$ NOVO (a partir de US$ 349) --> GANHE 1 EA GRÁTIS (para 2 números de conta comercial). Oferta combinada definitiva     ->     clique aqui JUNTE-SE AO GRUPO PÚBLICO:   Clique aqui   LIVE SIGNAL LIVE SIGNAL V2.0 UPDATE 2.0 INFO Bem-vindo ao BITCOIN REAPER!   Depois do tremendo sucesso do Gold Reaper, decidi que era hora de aplicar os mesmos princípios vencedores ao mercado de Bi
Features All Ichimoku Signals (Selectable) : Display all reliable signals generated by the Ichimoku indicator. You can choose which signals to view based on your preferences. Filter by Signal Strength : Sort signals by their strength—whether they are weak, neutral, or strong. Live Notifications : Receive real-time notifications for Ichimoku signals. Transparent Cloud : Visualize the Ichimoku cloud in a transparent manner. Available Signals Tenkensen-Kijunsen Cross Price-Kijunsen Cross Price-C
O Scanner Multicurrency do Índice Direcional Médio (ADX) MT5 é um indicador de negociação avançado projetado para analisar múltiplos pares de moedas simultaneamente. Ele beneficia os traders que buscam aprimorar seu processo de tomada de decisão, fornecendo sinais em tempo real com base no Índice Direcional Médio, permitindo uma análise eficiente das tendências do mercado. Esta ferramenta simplifica a experiência de negociação ao facilitar a identificação da força da tendência e do movimento dir
A Estratégia Boring Gold (XAUUSD) A história por trás do Boring Gold Desenvolvi este EA porque estava cansado de procurar pelo "Santo Graal". Percebi que o trading institucional de ouro é sobre disciplina, não complexidade. Após 14 meses de resultados consistentes manualmente, codifiquei as regras neste robô para remover a emoção humana. Destaques: * Sem Grid ou Martingale por padrão. Filtro de Machine Learning (Regressão Linear). Stop Loss baseado em volatilidade (ATR). Preço promocional de la
Visual Dolphin Indicator
AL MOOSAWI ABDULLAH JAFFER BAQER
Visual Dolphin Indicator Unlock the rhythm of the market with the Visual Dolphin Indicator, your ultimate tool for identifying and capitalizing on market trends with clarity and confidence. Designed for both novice and experienced traders, this indicator eliminates the noise and guesswork, providing crystal-clear buy and sell signals directly on your chart. The Logic Behind the Waves The core of the Visual Dolphin Indicator is a sophisticated yet intuitive dual-wave system based on moving avera
Os compradores deste produto também adquirem
SuperScalp Pro
Van Minh Nguyen
5 (14)
SuperScalp Pro – Sistema avançado de indicador de scalping com múltiplos filtros SuperScalp Pro é um sistema avançado de indicador de scalping que combina o clássico Supertrend com múltiplos filtros inteligentes de confirmação. O indicador opera de forma eficiente em todos os timeframes de M1 a H4 e é especialmente adequado para XAUUSD, BTCUSD e principais pares Forex. Pode ser usado como sistema independente ou integrado de forma flexível a estratégias de trading existentes. O indicador integra
Azimuth Pro
Ottaviano De Cicco
5 (6)
PROMOÇÃO DE LANÇAMENTO O preço do Azimuth Pro está inicialmente definido em 299$ para os primeiros 100compradores. O preço final será de 499$ . A DIFERENÇA ENTRE ENTRADAS RETAIL E INSTITUCIONAIS NÃO É O INDICADOR — É A LOCALIZAÇÃO. A maioria dos traders entra em níveis de preço arbitrários, perseguindo momentum ou reagindo a sinais atrasados. As instituições esperam o preço atingir níveis estruturados onde oferta e demanda realmente mudam. Azimuth Pro mapeia esses níveis automaticamente: VWA
Divergence Bomber
Ihor Otkydach
4.89 (85)
Cada comprador deste indicador recebe adicionalmente, e de forma gratuita: A ferramenta exclusiva "Bomber Utility", que acompanha automaticamente cada operação, define os níveis de Stop Loss e Take Profit e fecha operações de acordo com as regras da estratégia; Arquivos de configuração (set files) para ajustar o indicador em diferentes ativos; Set files para configurar o Bomber Utility nos modos: "Risco Mínimo", "Risco Balanceado" e "Estratégia de Espera"; Um vídeo tutorial passo a passo que aju
Entry In The Zone and SMC Multi Timeframe is a real-time market analysis tool developed based on Smart Money Concepts (SMC). It is designed to analyze market structure, price direction, reversal points, and key zones across multiple timeframes in a systematic way. The system displays Points of Interest (POI) and real-time No Repaint signals, with instant alerts when price reaches key zones or when signals occur within those zones. It functions as both an Indicator and a Signal System (2-in-1), c
RelicusRoad Pro: Sistema Operacional Quantitativo de Mercado 70% DE DESCONTO ACESSO VITALÍCIO (TEMPO LIMITADO) - JUNTE-SE A 2.000+ TRADERS Por que a maioria dos traders falha mesmo com indicadores "perfeitos"? Porque eles operam Conceitos Únicos no vácuo. Um sinal sem contexto é uma aposta. Você precisa de CONFLUÊNCIA . RelicusRoad Pro não é um simples indicador de seta. É um Ecossistema Quantitativo de Mercado completo. Ele mapeia a "Estrada do Valor Justo", distinguindo ruído de rupturas estru
CGE Trading Suite
Carl Gustav Johan Ekstrom
5 (1)
CGE Trading Suite delivers the analytical edge typically reserved for professional trading desks. The platform integrates a full suite of analytical tools into one seamless workflow: dynamic grid mapping, liquidity behavior analysis, ECM, trend lines, MIDAS, trade cycles, and directional channel projections. Together, these provide a unified view of market structure and momentum. Directional clarity is further enhanced by the capital flow index, which measures currency basket strength to identif
Se você comprar este indicador, receberá meu Gerenciador de Operações Profissional + EA  GRATUITAMENTE. Primeiramente, vale ressaltar que este Sistema de Trading é um Indicador Não Repintado, Não Redesenho e Não Atrasado, o que o torna ideal tanto para o trading manual quanto para o automatizado. Curso online, manual e download de predefinições. O "Sistema de Trading Inteligente MT5" é uma solução completa de trading projetada para traders novos e experientes. Ele combina mais de 10 indicadores
FX Trend MT5 NG
Daniel Stein
5 (4)
FX Trend NG: A Nova Geração de Inteligência de Tendência Multi-Mercado Visão Geral FX Trend NG é uma ferramenta profissional de análise de tendências e monitoramento de mercado em múltiplos períodos de tempo. Permite compreender a estrutura completa do mercado em segundos. Em vez de alternar entre vários gráficos, você visualiza instantaneamente quais ativos estão em tendência, onde o momentum está enfraquecendo e onde existe alinhamento forte entre diferentes timeframes. Oferta de Lançamento
Power Candles MT5
Daniel Stein
5 (6)
Power Candles – Sinais de entrada baseados em força para qualquer mercado Power Candles leva a análise de força comprovada da Stein Investments diretamente para o seu gráfico de preços. Em vez de reagir apenas ao preço, cada candle é colorido com base na força real do mercado, permitindo identificar instantaneamente a construção de momentum, aceleração de força e transições limpas de tendência. Uma única lógica para todos os mercados Power Candles funciona automaticamente em todos os símbolos de
Meridian Pro
Ottaviano De Cicco
5 (1)
Meridian Pro: Matriz Profissional de Tendência Multi-Timeframe para MT5 Visão geral Meridian Pro é uma matriz de tendência multi-timeframe da Merkava Labs que comprime estado direcional, força, condição de momentum e concordância da matriz em um painel compacto. Um motor adaptativo, aplicado consistentemente de M1 a W1. Sem ajuste por símbolo. Sem acúmulo de indicadores. Uma leitura estruturada em todos os ativos e todos os timeframes. Oferta de lançamento — Obtenha o Meridian Pro por USD 99 (in
Trend Screener Pro MT5
STE S.S.COMPANY
4.84 (103)
Desbloqueie o poder da negociação de tendências com o indicador Trend Screener: sua solução definitiva de negociação de tendências, alimentada por lógica difusa e sistema de múltiplas moedas! Eleve sua negociação de tendências com o Trend Screener, o revolucionário indicador de tendências alimentado por lógica difusa. É um poderoso indicador de acompanhamento de tendências que combina mais de 13 ferramentas e recursos premium e 3 estratégias de negociação, tornando-o uma escolha versátil para to
[ My Products ] , [ My Channel ]   ,  [ LIVE SIGNAL ] HFT Spike Detector HFT Spike Detector é uma ferramenta profissional de monitoramento de ticks desenvolvida para analisar e medir em tempo real movimentos de preço de alta frequência (picos repentinos causados por HFT). O objetivo é permitir que você detecte valores anormais de slippage, lacunas de liquidez e saltos de preço em milissegundos causados pelo corretor, utilizando dados numéricos. Como ele analisa o fluxo de ticks em tempo real
Atomic Analyst MT5
Issam Kassas
3.94 (31)
Primeiramente, vale ressaltar que este Indicador de Negociação não repinta, não redesenha e não apresenta atrasos, tornando-o ideal tanto para negociação manual quanto automatizada. Manual do utilizador: configurações, entradas e estratégia. O Analista Atômico é um Indicador de Ação de Preço PA que utiliza a força e o momentum do preço para encontrar uma vantagem melhor no mercado. Equipado com filtros avançados que ajudam a remover ruídos e sinais falsos, e aumentam o potencial de negociação.
Ferramenta dos market makers. O Meravith irá: Analisar todos os timeframes e exibir a tendência atual em vigor. Destacar zonas de liquidez (equilíbrio de volume) onde o volume comprador e vendedor é igual. Mostrar todos os níveis de liquidez de diferentes timeframes diretamente no seu gráfico. Gerar e apresentar análise de mercado em formato de texto para sua referência. Calcular alvos, níveis de suporte e pontos de stop-loss com base na tendência atual. Calcular a relação risco/retorno das suas
OmniSync Projection
Antonio-alin Teculescu
5 (1)
Chronos Fractal Engine is an innovative price projection indicator for MetaTrader 5, designed to transform your technical analysis by intelligently identifying and projecting historical price patterns. Built upon an advanced correlation algorithm and the fractal principles of the market, this powerful tool visualizes potential future price movements, giving you a unique edge in your trading decisions. What is Chronos Fractal Engine? At its core, the Chronos Fractal Engine employs a sophisticat
ARICoins
Temirlan Kdyrkhan
ARICoin is a powerful trading companion designed to generate high-probability entry signals with dynamic TP/SL/DP levels based on volatility. Built-in performance tracking shows win/loss stats, PP1/PP2 hits, and success rates all updated live. Key Features: Buy/Sell signals with adaptive volatility bands Real-time TP/SL/DP levels based on ATR Built-in MA Filter with optional ATR/StdDev volatility Performance stats panel (Success, Profit/Loss, PP1/PP2) Alerts via popup, sound, push, or email Cust
Quantum TrendPulse
Bogdan Ion Puscasu
5 (22)
Apresentando   Quantum TrendPulse   , a ferramenta de negociação definitiva que combina o poder do   SuperTrend   ,   RSI   e   Stochastic   em um indicador abrangente para maximizar seu potencial de negociação. Projetado para traders que buscam precisão e eficiência, este indicador ajuda você a identificar tendências de mercado, mudanças de momentum e pontos de entrada e saída ideais com confiança. Principais características: Integração SuperTrend:   siga facilmente a tendência predominante do
Currency Strength Dashboard Pro Painel profissional de análise de força de moedas em tempo real para MetaTrader 5 . O indicador calcula e exibe a força de 8 moedas principais (EUR, USD, GBP, JPY, CHF, AUD, CAD, NZD) utilizando 28 pares de moedas simultaneamente em múltiplos timeframes. O painel oferece ao trader uma visão completa do mercado em um único olhar — sem cálculos adicionais ou necessidade de alternar entre gráficos. Método de cálculo O indicador é baseado em um método matemático avanç
Grabber System MT5
Ihor Otkydach
4.83 (23)
Apresento a você um excelente indicador técnico: Grabber, que funciona como uma estratégia de trading “tudo incluído”, pronta para usar. Em um único código estão integradas ferramentas poderosas de análise técnica de mercado, sinais de entrada (setas), funções de alertas e notificações push. Cada comprador deste indicador também recebe gratuitamente: Utilitário Grabber: ferramenta para gerenciamento automático de ordens abertas Vídeo tutorial passo a passo: como instalar, configurar e operar com
Apresentando       Quantum Breakout PRO   , o inovador Indicador MQL5 que está transformando a maneira como você negocia Breakout Zones! Desenvolvido por uma equipe de traders experientes com experiência comercial de mais de 13 anos,       Quantum Breakout PRO       foi projetado para impulsionar sua jornada comercial a novos patamares com sua estratégia de zona de fuga inovadora e dinâmica. O Quantum Breakout Indicator lhe dará setas de sinal em zonas de breakout com 5 zonas-alvo de lucro e su
FX Power MT5 NG
Daniel Stein
5 (31)
FX Power: Analise a Força das Moedas para Decisões de Negociação Mais Inteligentes Visão Geral FX Power é a sua ferramenta essencial para compreender a força real das principais moedas e do ouro em quaisquer condições de mercado. Identificando moedas fortes para comprar e fracas para vender, FX Power simplifica as decisões de negociação e revela oportunidades de alta probabilidade. Quer você prefira seguir tendências ou antecipar reversões usando valores extremos de Delta, esta ferramenta adap
Bill Williams Advanced
Siarhei Vashchylka
5 (11)
Bill Williams Advanced is designed for automatic chart analysis using Bill Williams' "Profitunity" system. The indicator analyzes four timeframes at once. Manual (Be sure to read before purchasing) Advantages 1. Analyzes the chart using Bill Williams' "Profitunity" system. Signals are displayed in a table in the corner of the screen and on the price chart. 2. Finds all known AO and AC signals, as well as zone signals. Equipped with a trend filter based on the Alligator. 3. Finds "Divergence Bar
Advanced Supply Demand MT5
Bernhard Schweigert
4.53 (15)
Atualmente com 33% de desconto! A melhor solução para qualquer Trader Novato ou especialista! Este indicador é uma ferramenta de negociação exclusiva, de alta qualidade e acessível porque incorporamos uma série de recursos proprietários e uma nova fórmula. Com esta atualização, você poderá mostrar fusos horários duplos. Você não só será capaz de mostrar um TF mais alto, mas também mostrar ambos, o TF do gráfico, MAIS o TF mais alto: MOSTRANDO ZONAS ANINHADAS. Todos os traders de Oferta e Demanda
RFI levels PRO MT5
Roman Podpora
3.67 (3)
O indicador mostra com precisão os pontos de reversão e as zonas de retorno de preço onde o   Principais players . Você identifica onde novas tendências estão se formando e toma decisões com máxima precisão, mantendo o controle sobre cada negociação. VERSION MT4     -    Revela seu potencial máximo quando combinado com o indicador   TREND LINES PRO. O que o indicador mostra: Estruturas de reversão e níveis de reversão com ativação no início de uma nova tendência. Exibição dos níveis de   TAKE P
Market Structure Order Block Dashboard MT5 é um indicador para MT5 focado em estrutura de mercado e conceitos ICT / Smart Money: HH/HL/LH/LL , BOS , ChoCH , além de Order Blocks , Fair Value Gaps (FVG) , liquidez (EQH/EQL, sweeps), sessões / Kill Zones e um Volume Profile integrado, com um dashboard compacto de confluência. Importante: é uma ferramenta de análise . Não executa operações (não é um EA). Bônus para compradores Após a compra, você pode receber 2 indicadores bônus (à sua escolha) da
Market Structure Patterns
Samuel Manoel De Souza
4.47 (19)
Disponível para   MT4   e   MT5 . Junte-se ao canal Market Structure Patterns para baixar os materiais disponíveis para estudos e informações adicionais. Postagens relacionadas: Market Structure Patterns - Introdução Além dos Order Blocks “Bonitinhos”: Utilizando Análise Volumétrica Real com Market Structure Patterns & Timeless Charts Market Structure Patterns   é um indicador baseado em   smart money concepts   que apresenta elementos de   SMC/ICT   capazes de elevar suas decisões de negociaç
Crystal Heikin Ashi Signals
Muhammad Jawad Shabir
5 (1)
Crystal Heikin Ashi Signals - Professional Trend & Signal Detection Indicator Advanced Heikin Ashi Visualization with Intelligent Signal System for Manual & Automated Trading Final Price: $149 ---------> Price goes up $10 after every 10 sales . Limited slots available — act fast . Overview Crystal Heikin Ashi Signals is a professional-grade MetaTrader 5 indicator that combines pure Heikin Ashi candle visualization with an advanced momentum-shift detection system. Designed for both manual traders
Veja qual estrategia realmente funciona no seu simbolo - antes de arriscar dinheiro real. Power Bar detecta barras de preco extremas em qualquer simbolo e qualquer timeframe, e entao faz backtest instantaneo de 3 estrategias de trading diferentes para que voce possa comparar taxas de acerto, fatores de lucro e P&L lado a lado. Tudo em um unico painel interativo. Sem suposicoes. Sem curve-fitting. Apenas dados. O que torna o Power Bar unico? A maioria dos indicadores fornece um sinal e deixa voc
Smart Stop Indicator – Precisão inteligente de stop-loss diretamente no seu gráfico Visão geral O Smart Stop Indicator é a solução ideal para traders que desejam definir seu stop-loss de forma clara e metódica, sem adivinhações ou decisões baseadas apenas na intuição. A ferramenta combina lógica clássica de price action (topos mais altos, fundos mais baixos) com um sistema moderno de detecção de rompimentos para identificar onde realmente deve estar o próximo nível lógico de stop. Seja em tend
Gann Made Easy   é um sistema de negociação Forex profissional e fácil de usar, baseado nos melhores princípios de negociação usando a teoria do sr. W. D. Gann. O indicador fornece sinais precisos de COMPRA e VENDA, incluindo níveis de Stop Loss e Take Profit. Você pode negociar mesmo em movimento usando notificações PUSH. Entre em contato comigo após a compra para receber instruções de negociação e ótimos indicadores extras gratuitamente! Provavelmente você já ouviu muitas vezes sobre os método
Mais do autor
Renko bars builder
Navdeep Singh
4.2 (5)
The indicator builds a Renko chart in the sub window for the current symbol. The bars are formed from live data and the desired bar size can be set in the inputs tab. Most importantly, because the Renko chart only uses price to construct bars and ignores time, the indicator can be applied to any time frame and same results can be achieved. Recommended usage As Renko charts are famous for eliminating noise so traders can use this tool to see clear picture of the trend to help their analysis, entr
FREE
ADR Bands
Navdeep Singh
4.5 (2)
Average daily range, Projection levels, Multi time-frame ADR bands shows levels based on the selected time-frame. Levels can be used as projections for potential targets, breakouts or reversals depending on the context in which the tool is used. Features:- Multi time-frame(default = daily) Two coloring modes(trend based or zone based) Color transparency  
FREE
ZigZag New
Navdeep Singh
4.33 (3)
Informative & optimized Zigzag, Accumulated volume, Price change   A rewrite of the traditional zigzag tool with new additions. Features:- Optimized code Displays accumulated volume between peaks Displays price change between peaks Usage:- Identify trend swings Identify high volume swings Compare price changes between swings Drawing Fibonacci tool on strong price change or high volume swings
FREE
RSI Scanner, Multiple Symbols and Timeframes, Graphical User Interface An indicator that scans multiple symbols added from the market watch and timeframes and displays result in a graphical panel. Features: Multi symbol Multi timeframe Alerts and Notifications Live Monitoring Sorting modes One click to change symbol and timeframe Inputs for RSI and scanner settings
FREE
Algorithmic Signals indicator   is not an indicator but a strategy that generates entry/exit signals. The entry arrows are formed after multiple conditions are met. The indicator is using an   Adaptive Algorithm   which automatically adjust to the symbol and time frame (see the screenshots below) . Signals can be used for scalping or even trend trading. Main features:- Non repainting signals Entry signals Exit signals Alert for price reaching 1 x ATR(14) (could be utilized for initial take prof
Stochastic force is an advanced version of the stochastic oscillator. Instead of using the regular price a more efficient price data is provided as an input for the oscillator which takes into account the price efficiency, volume and market noise. Also price is pre-filtered with the selected average type and then post-filtered by a hull moving average which provides a smooth transition of the oscillator. It eliminates maximum false signals and has the potential to become an integral part of any
This is the new version of the Algorithmic signals featuring a new algorithm. It is a blend of technical and candlestick analysis. Candlestick analysis are often ignored while creating technical strategies but this version has a feature to include that and make confirmations more strong.  Usage:- Traders can use the signals for buying and selling assets or even blend their own favorite indicators with it.
TDI Signals generates buy and sell arrows based on a TDI(Traders Dynamic Index) algorithm. It looks for price breakouts, continuations and reversals. By default it runs in the trend mode but user is provided with the option to change that to reversal mode. Trader can use the mode which compliments his/her trading style.  Usage:-   TDI Signals can be used as a stand alone indicator with context or even be added to strategies to make confirmations more strong. Volatility based stop loss, take pro
RSI Levels generates buy and sell arrows based on RSI analysis. Signals are based on extreme levels breakouts and can be further filtered by a volatility metric. Trader can use the mode which compliments his/her trading style.  Features:- Parameters for signal optimization and alerts. Usage:-   RSI Levels can be used as a stand alone indicator with context or even be added to strategies to make confirmations more strong. Volatility based stop loss, take profit & position sizing can be very helpf
The indicator helps the trader in identifying potential liquidity levels. The algorithm used in this indicator checks the behavior of the asset taking into account the price levels, momentum and volume analysis. Features:- Parameters for signal optimization and alerts. Usage:- The levels formed by the indicator can be helpful to traders in identifying potential entries, breakouts or reversals. it can assist traders of technical trading background or even pure price action trading. Examples of
Step force index is a modified version of the famous force index indicator. As the name suggests it incorporates a step feature to filter the force index values thus eliminating small fluctuations in the indicator. It also utilizes the smooth algorithm library thereby providing multiple smoothing options for the index values. This personal implementation makes it a more easy to use and a reliable tool. Main features A wide range of parameters for signals optimization Alerts, emails and push noti
CMA dashboard is designed to help traders in identifying trend on multiple timeframes and symbols. It displays a clear state of the overall trend at one place without the need to navigate between different charts and timeframes. This saves time and makes decision making process fast so that potential opportunities are not missed. It is based on Corrected moving averages available here Features Parameters for signal optimization Inputs for multiple timeframes and symbols  Usage Higher timeframe
IBB Candles is a tool that is based on the concept of Inverse Bollinger Bands. It compares price relative to state of the bands and plots candles with different colors defining the current state of the market i.e range | trend | strong trend. As the name suggests IBB(Inverse Bollinger Bands) is a technique which is completely different from the traditional Bollinger Bands and proves to be much more effective in analyzing market. This personal implementation makes this tool a more reliable option
Market structures, Market balance, Range breakouts This tools helps to identify areas of market ranges, structures and plots colored boxes on breakout of those areas. User is given the option to receive alerts and notifications on the formation of the blocks. The tool has the ability to become an essential part of a technical trading system or even pure price action trading. Usage:- An essential tool for price action or technical traders.  More information in the blog
Horizontal volume bars, Cluster analysis, Volume profile Volume in Range gets information about the accumulated volume in a specified vertical range and period in bars. The received data is then plotted on the chart as rectangular boxes with the volume quantity inside. Usage:- The tool acts as a support resistance levels but most importantly it should be used to check in which direction the price breaks out of the significant levels formed by this indicator and then actions to be taken on correc
This utility is specifically designed for No Nonsense Forex traders. What it does:- Let traders add or remove symbols to trade Editable boxes in panel for updating inputs Automatically applies money management to the trades Places all orders with a single click  How it calculates:- Two trades are opened per symbol By default max risk per trade is 1% By default total risk is 6% which can changed in inputs tab(recommended to keep it 6 or below)  On addition of symbols the total risk will be divide
Price breakouts, Levels, Multi-time frame Inside bars checks for price failure to break from the previous high/low and on breakout draws a breakout box on the chart. The choice of breakout price is given to the user i.e. close or high/low of bar. Alerts can be received on breakouts. Features:- Multi-time frame Alerts, notifications & emails Usage:- Breakout signals Check how price action is evolving with the help of boxes Get multi-time frame bias
Market Fractal Analysis, Fractal Swing, Market Flow Fractal Cycles looks for Similar Patterns in the Market that repeat themselves because of the Market Fractal Nature. These patterns are displayed with help of Graphical Objects and Alerts can be received on their arrival. Read the Blog for full information. Features:- Auto Detection of Patterns Customization for Color and Line Styles Alerts, Emails & Push Notifications 
50+ Candlestick Patterns, Simulated Trading Results, Top Five Performers Candle Analysis extends Candlesticks Pattern Analysis by not only identifying Patterns but also recording the Past Performance of the Patterns. What it Does:- Identifies and plots results on chart Displays Top Patterns for both Bullish and Bearish type.  Log can be printed in experts tab to see Simulated Trading results Displays All or Selected Patterns Alerts on Pattern formation More detailed information in Blog
The indicator helps the trader in identifying potential liquidity levels. The algorithm used in this indicator checks the behavior of the asset taking into account the price levels, momentum and volume analysis. Features:- Parameters for signal optimization and alerts. Usage:- The levels formed by the indicator can be helpful to traders in identifying potential entries, breakouts or reversals. it can assist traders of technical trading background or even pure price action trading.
IBB Candles is a tool that is based on the concept of Inverse Bollinger Bands. It compares price relative to state of the bands and plots candles with different colors defining the current state of the market i.e range | trend | strong trend. As the name suggests IBB(Inverse Bollinger Bands) is a technique which is completely different from the traditional Bollinger Bands and proves to be much more effective in analyzing market. This personal implementation makes this tool a more reliable optio
Horizontal volume bars, Cluster analysis, Volume profile Volume in Range gets information about the accumulated volume in a specified vertical range and period in bars. The received data is then plotted on the chart as rectangular boxes with the volume quantity inside. Usage:- The tool acts as a support resistance levels but most importantly it should be used to check in which direction the price breaks out of the significant levels formed by this indicator and then actions to be taken on correc
Market structures, Market balance, Range breakouts This tools helps to identify areas of market ranges, structures and plots colored boxes on breakout of those areas. User is given the option to receive alerts and notifications on the formation of the blocks. The tool has the ability to become an essential part of a technical trading system or even pure price action trading. Usage:- An essential tool for price action or technical traders.  More information in the blog
Market Fractal Analysis, Fractal Swing, Market Flow Fractal Cycles looks for Similar Patterns in the Market that repeat themselves because of the Market Fractal Nature. These patterns are displayed with help of Graphical Objects and Alerts can be received on their arrival. Read the   Blog   for full information. Features:- Auto Detection of Patterns Customization for Color and Line Styles Alerts, Emails & Push Notifications
50+ Candlestick Patterns, Simulated Trading Results, Top Five Performers Candle Analysis extends Candlesticks Pattern Analysis by not only identifying Patterns but also recording the Past Performance of the Patterns. What it Does:- Identifies and plots results on chart Displays Top Patterns for both Bullish and Bearish type.  Log can be printed in experts tab to see Simulated Trading results Displays All or Selected Patterns Alerts on Pattern formation More detailed information in   Blog
The indicator is designed to detect range market or consolidation areas on the chart. It does this by using the market volatility and price momentum. The indicator signals the start and stop of the range with icons on the chart and various  type of alerts options provided in the input settings. Usage: The indicator can be used to check the state of the market i.e. trending or ranging to make appropriate decision and use strategies designed for specific market state. Please see the attached video
Filtro:
Sem comentários
Responder ao comentário