RSI Dashboard MT5
- Indicadores
-
The Huy Phan
 Contact info:
+Email: huyphanthe47@gmail.com
+Skype: live:metatradereafx
+Telegram: huyphanthe47
Create a job for me: - Versión: 3.0
- Actualizado: 15 noviembre 2024
- Activaciones: 10
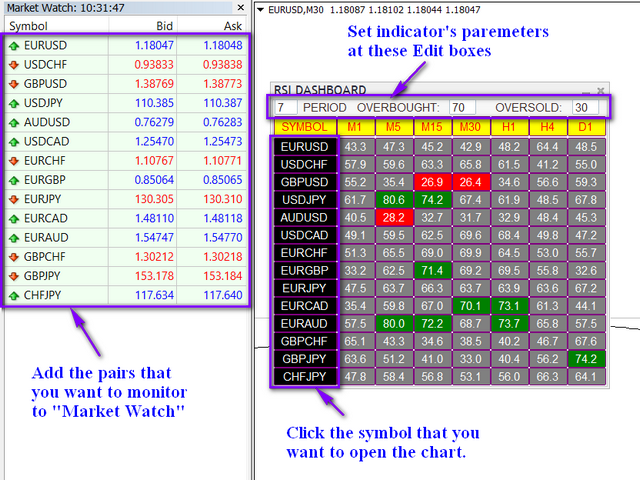
RSI Dashboard utiliza el valor del indicador Relative Strength Index. Los parámetros pueden ajustarse a través de los cuadros de edición de este panel.
Los pares a monitorizar se seleccionarán añadiéndolos a la Observación del Mercado (no es necesario establecer prefijos o sufijos), puede monitorizar tantos pares como desee.
Este cuadro de mandos controlará los marcos temporales más populares (M1,M5,M15,M30,H1,H4 y D1). Los colores se pueden personalizar.
Podemos echar un vistazo a muchos pares y muchos marcos de tiempo sin necesidad de abrir el gráfico. Además, podemos saltar al gráfico rápidamente si queremos.