Smooth Aroon MT4
- Indicadores
- Versión: 1.2
- Actualizado: 17 abril 2024
- Activaciones: 5

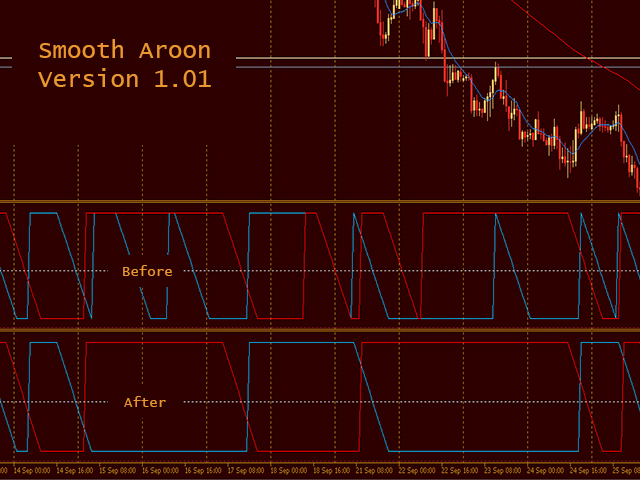
Smooth Aroon MT4 es una versión del Aroon Up and Down con suavizado y filtrado.
Características :
Suavizado :
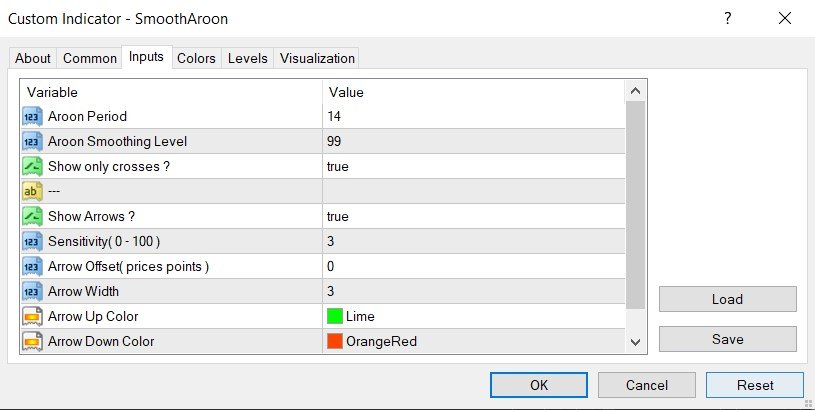
Dispone de suavizado de 0 a 99. Para suavizar una señal, busque el valor máximo de los puntos en cuestión y establezca el nivel de suavizado por encima del valor máximo.
Por ejemplo: si desea suavizar todas las señales por debajo de 30, debe ajustar el nivel de suavizado por encima de 30.
Esto también suaviza todas las señales por encima de 70, ya que el Aroon Up and Down oscila entre 0 y 100.
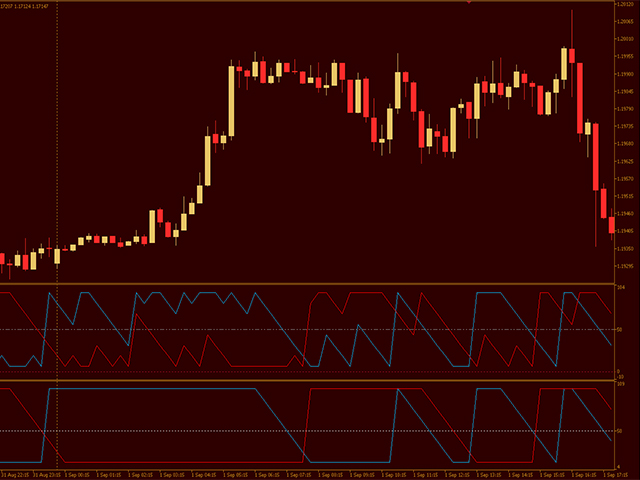
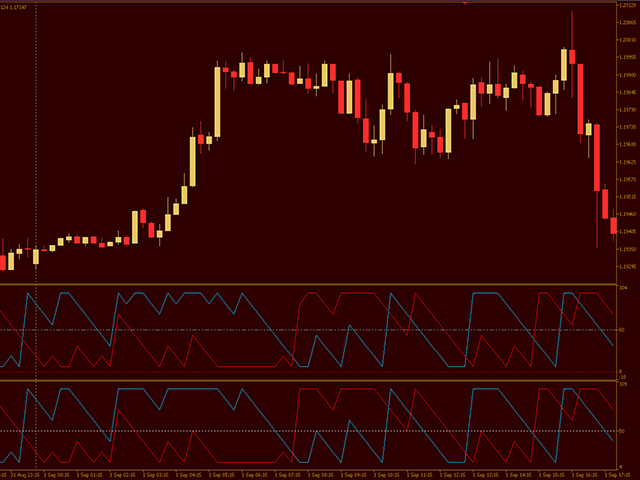
Filtrado :
Si sólo desea ver dónde se cruzan los valores de Aroon Up y Down, establezca"Mostrar sólo cruces" en verdadero.
El filtrado funciona con o sin suavizado
v1.02
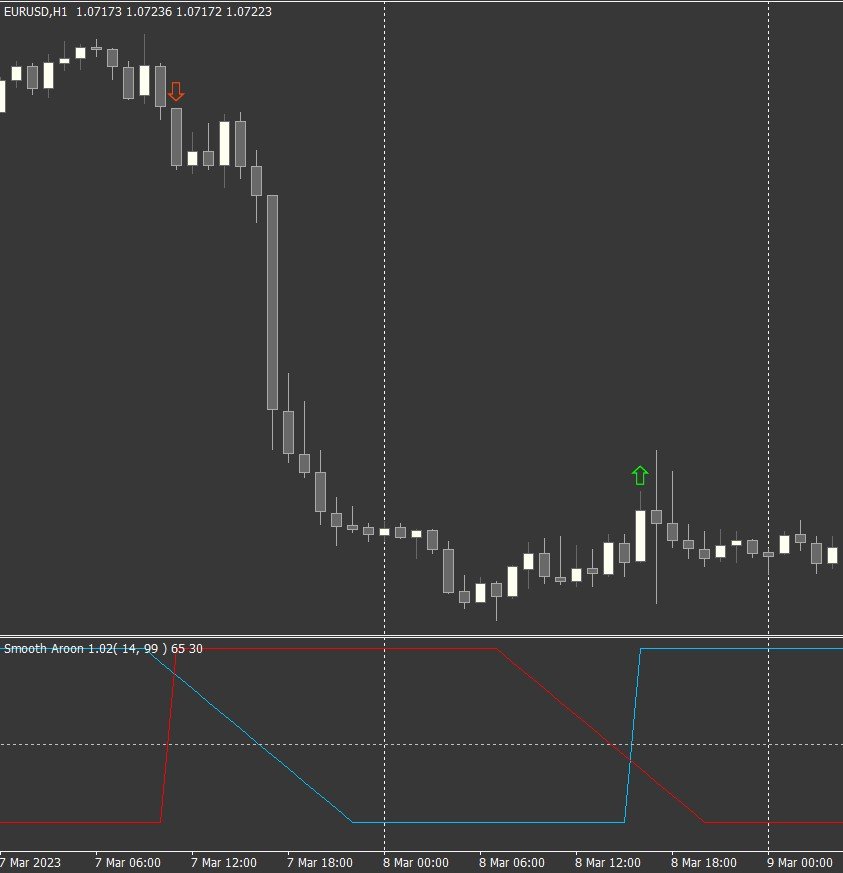
Mostrar flechas ? - dibuja flechas en la ventana principal del gráfico donde la línea ascendente del Aroon suavizado ha cruzado la línea descendente. Se dibuja una flecha apuntando hacia arriba cuando la línea Smooth Aroon Up cruza la línea Down yendo hacia arriba; la flecha opuesta se dibuja para el caso contrario.
Sensitivity - cuando la línea Smooth Aroon Up cruza la línea Down, se puede dibujar una flecha inmediatamente o después de que se haya alcanzado una cierta diferencia. Permite establecer cuánto debe cruzar la línea ascendente la descendente para que se dibuje una flecha(un número entero entre 0 y 100).
Desplazamiento de la flecha: desplaza la flecha hacia arriba la cantidad establecida.
Ancho de flecha - establece el tamaño de las flechas dibujadas
Color flecha arriba - establece el color de las flechas que apuntan hacia arriba
Color flecha abajo - establece el color de las flechas que apuntan hacia abajo
Actualizaciones:
Versión 1.02
1. Se ha añadido el modo "Mostrar flechas"
2. Añadido ajuste de sensibilidad
3. Añadida configuración de flechas : Desplazamiento, Anchura y Colores
Versión 1.01
1. El suavizado funciona para todos los periodos
2. Añadido modo "Mostrar sólo cruces
//---
ParaMT5: Smooth Aroon (1.02 próximamente)
//---
Disfrute
//---

Nice Indicator!