Smooth Aroon MT4
- 指标
- 版本: 1.2
- 更新: 17 四月 2024
- 激活: 5

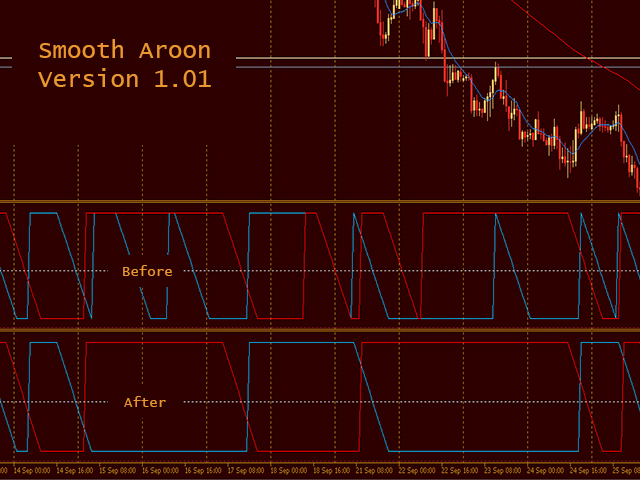
Smooth Aroon MT4 is a version of the Aroon Up and Down with smoothing and filtering.
Features :
Smoothing :
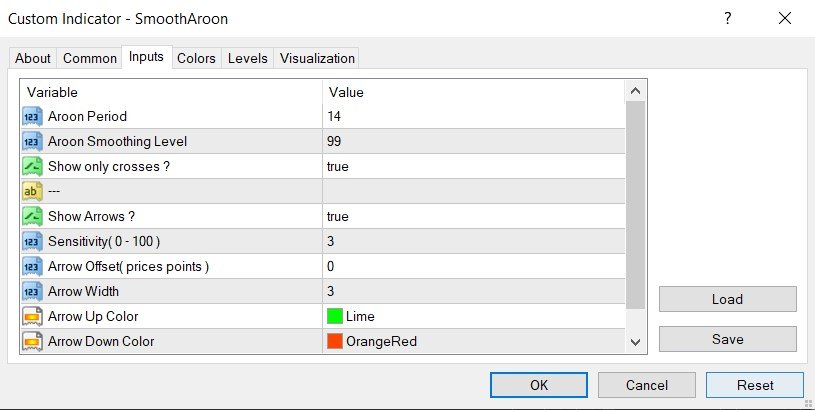
You have smoothing from 0 to 99. To smooth a signal, find the maximum value of the points in question then set the smoothing level above the maximum value.
For example : If you want to smooth all signals below 30, then you should set the smoothing level above 30
This also smooths all signals above 70, since the Aroon Up and Down Oscillates between 0 and 100.
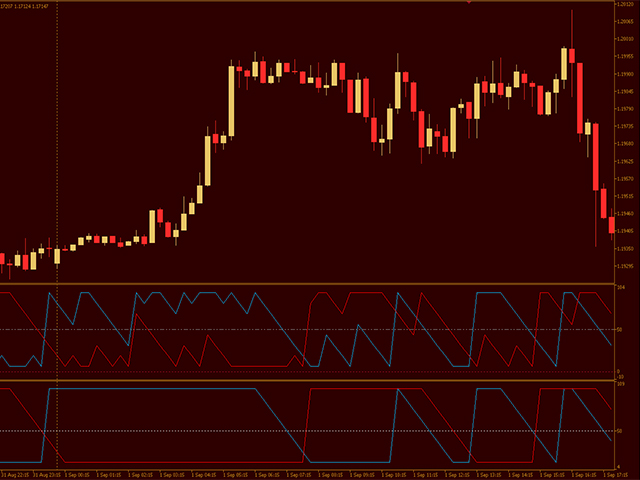
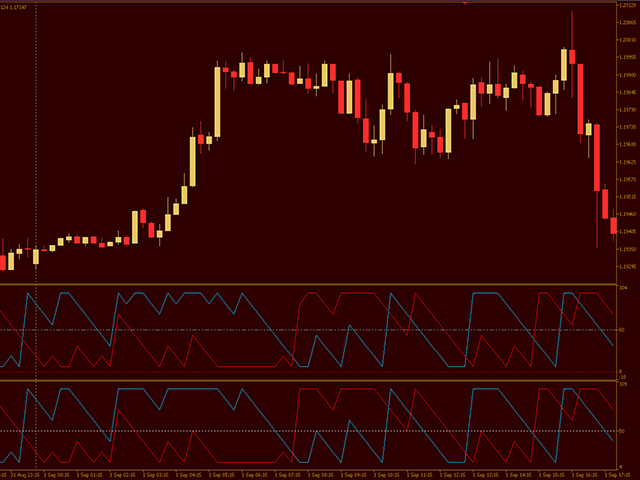
Filtering :
If you only want to see where Aroon Up and Down cross, set "Show only crosses ?" to true
Filtering works with or without smoothing
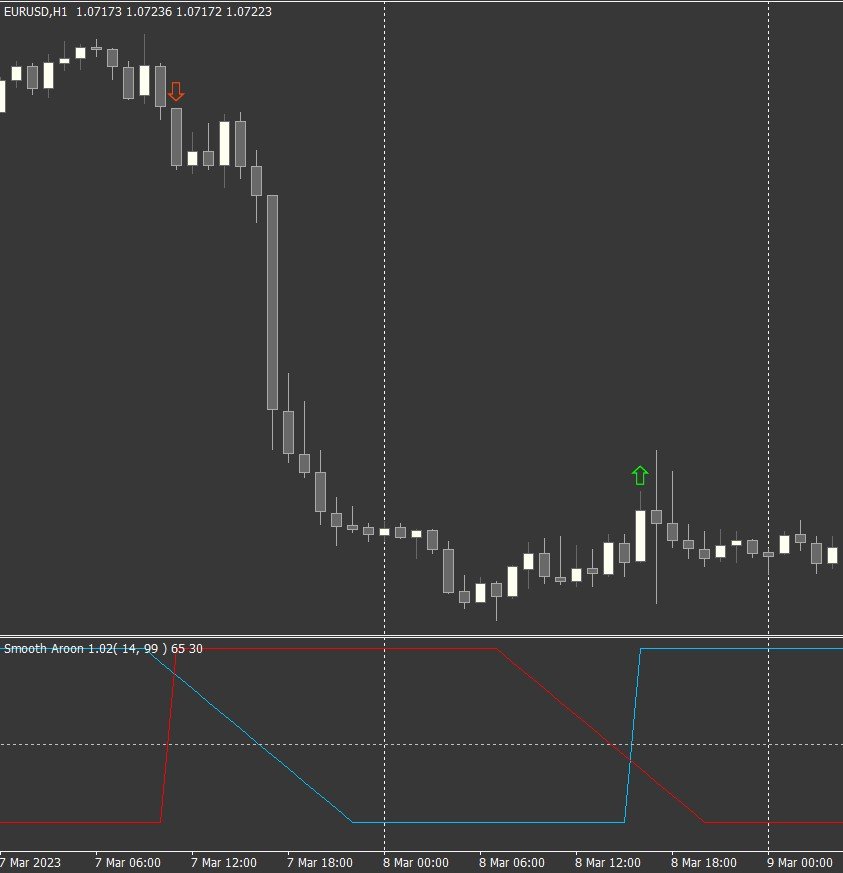
v1.02
Show Arrows ? - draws arrows on the main chart windows where the Smooth Aroon Up line has crossed the Down line. An arrow pointing up is drawn when the Smooth Aroon Up line crosses the Down line going upwards; the opposite arrow is draw for the opposite case.
Sensitivity - when the Smooth Aroon Up line crosses the Down line, an arrows can be drawn immediately or after a certain difference has been reached. This allows you to set by how much should the Up line cross the Down line for an arrow to be drawn.( a whole number between 0 and 100 )
Arrow Offset - moves the arrow upwards by the set amount
Arrow Width - sets the size of arrows drawn
Arrow Up Color - sets the color of arrows pointing up
Arrow Down Color - sets the color of arrows pointing down
Updates :
Version 1.02
1. Added "Show Arrows" mode
2. Added Sensitivity Setting
3. Added Arrow Settings : Offset, Width and Colors
Version 1.01
1. Smoothing works for all periods
2. Added "Show only crosses" mode
//---
For MT5 : Smooth Aroon (1.02 coming soon)
//---
Enjoy
//---

Nice Indicator!