WT Vwap 5 Bands
- Indicadores
-
Ricardo Almeida Branco
 Comencé a seguir la bolsa de valores brasileña en 2018, en una cuenta de demostración, y encontré interesante la cantidad de configuraciones utilizadas. Tomando en serio el aprendizaje e incluso la demostración, entendí que debía comenzar a programar para validar / descartar configuraciones.
 - Versión: 1.0
- Activaciones: 5
WT Vwap 5 Bandas
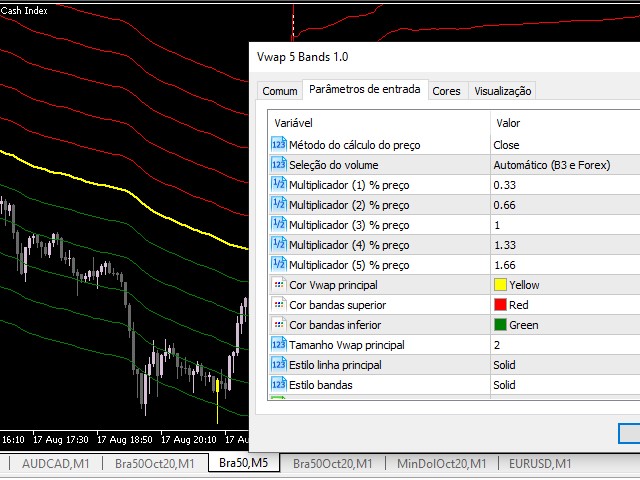
El indicador WT Vwap Bands es un indicador que combina precio y volumen, ayudando a mostrar si el precio está dentro del "precio justo", sobrecomprado o sobrevendido.
El código del indicador fue diseñado para el rendimiento y ya ha sido probado en una cuenta de trading real.
Además de las entradas visuales (color, grosor y estilo de línea), el usuario puede definir un valor% que depende del precio.
Los valores por defecto trabajan con la banda más distante al 1% del precio y luego dividiendo esta distancia en 3, es decir, 0.33% y 0.66% del precio.
Estos valores pueden necesitar ser cambiados dependiendo del activo o par que vaya a operar.
Este indicador puede ser usado en el probador de estrategias (funciona en demo) y también puede ser usado en un Asesor Experto (robot) para dar señales de entrada y salida.
¡Eso es!
¡Éxito y buenas operaciones!
El usuario no ha dejado ningún comentario para su valoración