CoioteChart
- Indicadores
- Versión: 1.2
- Actualizado: 27 enero 2023
- Activaciones: 5

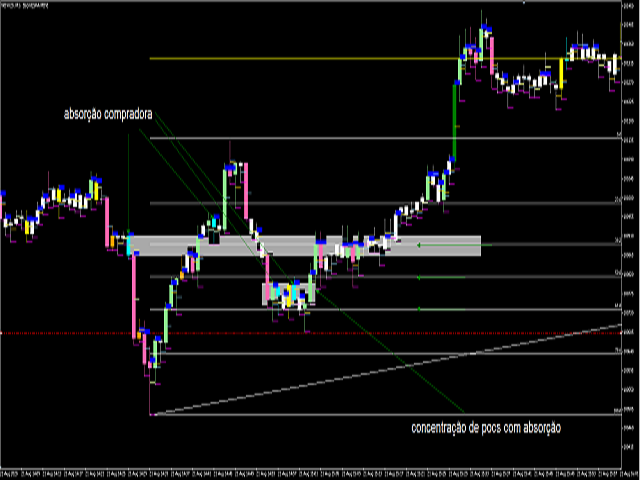
El indicador CoioteChart se ha creado para facilitar desde la lectura del contexto de mercado hasta la microestructura de la vela, facilitando los ajustes operativos y la toma de decisiones con gran eficacia.
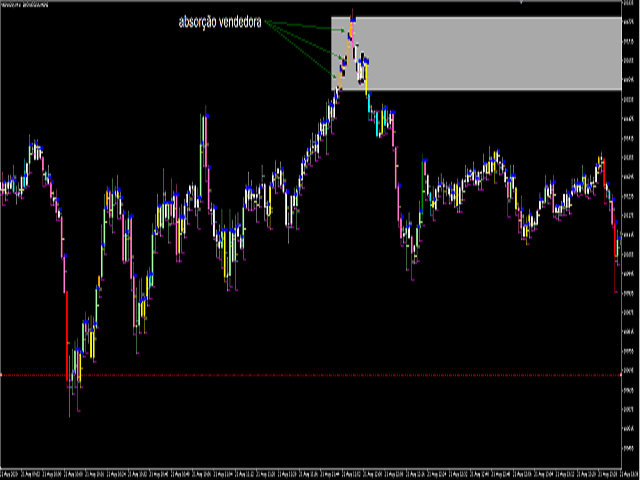
Posee un control para habilitar y deshabilitar la visualización de pocs, vwap, zonas de máxima y mínima negociación, pueden utilizarse fuentes de datos de tiempos gráficos para cálculos o utilizarse los ticks de agressão do time and trades, funciona con volumen real y volumen de ticks.
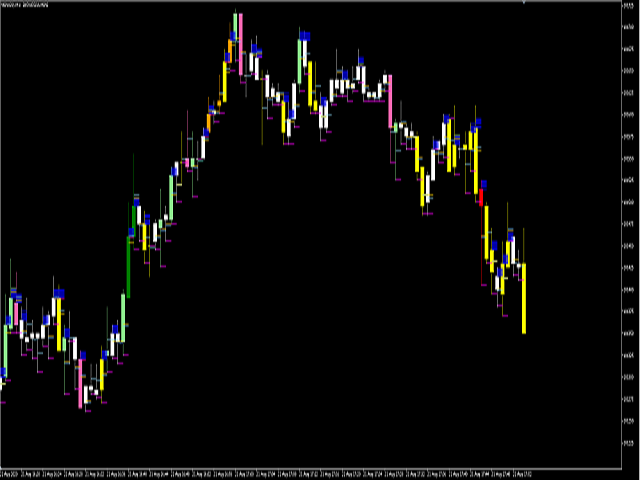
Los colores se atribuyen a partir del análisis de volumen y la variación del precio (esfuerzo x resultado) en relación con los últimos N (paramétrico) velas, siendo por patrón:
Verde(alta)/Vermelho(baja) -> mayor volumen, variación de precio por encima de la media.
Verde Claro (alta)/Rosa Claro (baja) -> volumen y variación de precio medio.
Azul Claro (baja) / Laranja (alta) -> volumen medio y variación de precio medio.
Amarelo -> volumen por debajo de la media, variación de precio por encima de la media.
Branco -> volumen y variación de precio por debajo de la media.
Se trazan automáticamente rótulos con regiones de soporte y resistencia, y alvéolos.