Angle Dashboard
- Indicadores
- Versión: 1.70
- Actualizado: 8 junio 2022
- Activaciones: 10

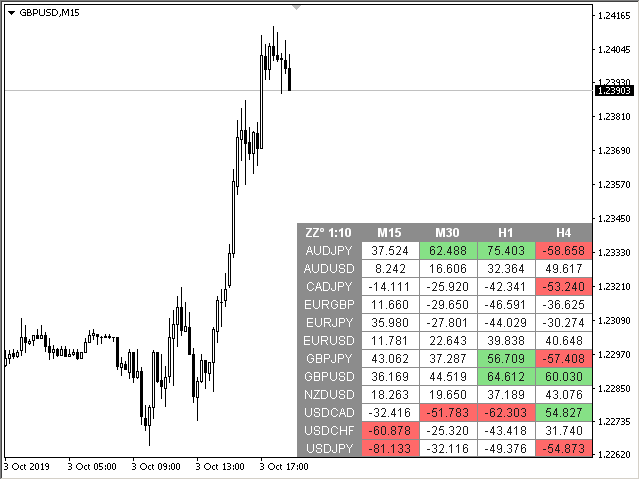
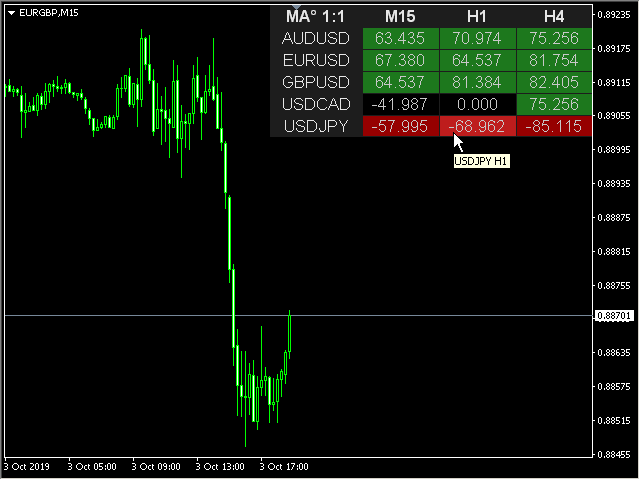
Este es un indicador multidivisa y multitiempo que calcula el ángulo entre dos puntos. Los puntos para medir el ángulo pueden tomarse del ZigZag (los dos últimos puntos), o de la Media Móvil (entre dos barras dadas), o pueden ser los precios de cierre de las barras.
La medición del ángulo es posible en grados o en radianes. Puede seleccionar la escala para el cálculo.
Para una mejor comprensión del indicador, puede estudiar el indicador gratuito Angle High Low.
En los parámetros puede especificar las divisas y plazos que desee. El indicador también puede enviar notificaciones cuando se cruzan los ángulos de sobrecompra y sobreventa. Al hacer clic en una celda con un período, se abrirá este símbolo y período.
Parámetros
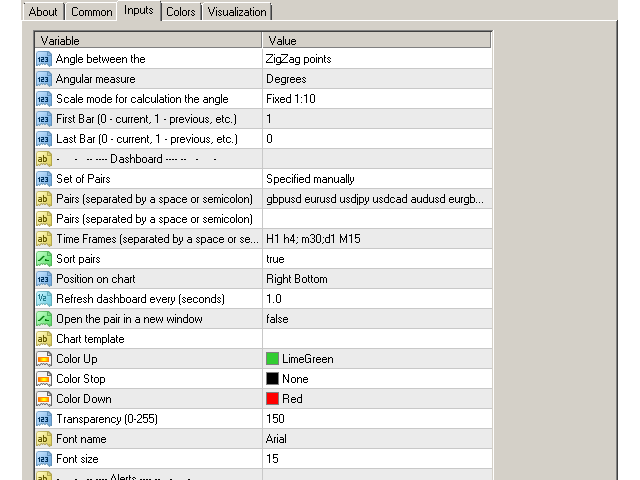
Ángulo entre - modo de cálculo del ángulo:
- Cierre de las barras - en los precios de cierre de las barras especificadas;- Puntos ZigZag - en los dos últimos puntos del ZigZag;- Barras MA - en los valores MA de las barras especificadas;
Medida angular - medida del ángulo en grados o radianes;
Modo de escala para el cálculo del ángulo - modo de escala. Fijo 1:1 - escala fija, los cálculos se realizan en la escala 1:1 del gráfico. Fijo 1:10 - escala fija 1:10, 1 unidad a lo largo del eje Y se multiplica por diez. Otras escalas cambian en consecuencia;
Primera Barra (0 - actual, 1 - anterior, etc.) - el número de la barra donde se encuentra el inicio de la esquina;
Última barra (0 - actual, 1 - anterior, etc.) - el número de la barra donde se encuentra el final de la esquina;
Tablero
Borrar el gráfico al inicio - borrar el gráfico al inicio;
Conjunto de pares - conjunto de símbolos
- Observación del Mercado - pares de la "Observación del Mercado";- Especificados manualmente - pares especificados manualmente, en los parámetros "Pares".- Par actual - mostrar sólo el par actual.
Pares (separados por un espacio o punto y coma) - lista de símbolos separados por espacios o punto y coma. Los nombres de las divisas deben escribirse exactamente igual que los del broker, manteniendo las mayúsculas y minúsculas y el prefijo/sufijo.
Plazos (separados por un espacio o punto y coma) - lista de plazos separados por espacios o punto y coma.
Ordenar pares - ordenar la lista de pares.
Posición en el gráfico - esquina para mostrar el panel en el gráfico.
Desplazamiento X (pix) - desplazar el panel a lo largo del eje X.
Desplazamiento Y (pix) - desplaza el panel a lo largo del eje Y.
Actualizar panel cada (segundos) - periodo de actualización para todos los pares y marcos temporales.
Abrir el par en una nueva ventana - abrir un símbolo en una nueva ventana del gráfico haciendo clic.
Plantilla del gráfico - nombre de la plantilla del gráfico, si el gráfico se abre en una nueva ventana.
Color Arriba - color de la celda si el indicador aumenta.
Color Abajo - color de la celda si el indicador disminuye.
Color Stop - color de la celda si el indicador no cambia.
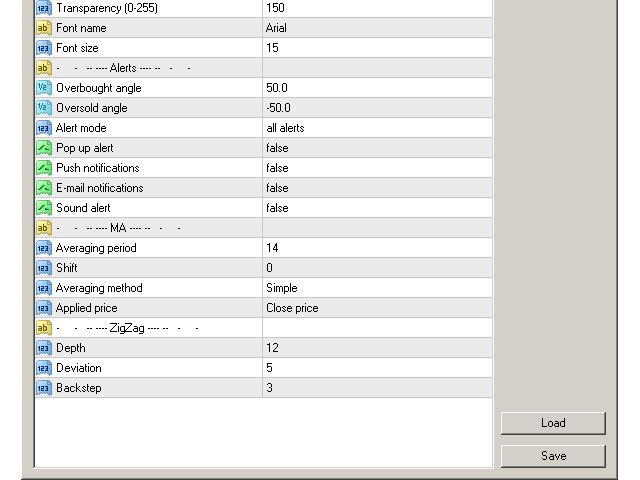
Transparencia (0-255) - transparencia del panel.
Nombre de fuente.
Tamaño de letra.
Alertas
Ángulo de sobrecompra - ángulo de sobrecompra, para alerta.
Ángulo de sobreventa - ángulo de sobreventa, para la alerta.
Timeframes for alerts (separados por un espacio o punto y coma) - lista de periodos para los que se enviará la alerta (separados por un espacio o punto y coma).
Alerta emergente.
Notificaciones push.
Notificaciones por correo electrónico .
Alerta sonora.
Media móvil
Período de promedio - Período de promedio para el cálculo (para MA).
Desplazamiento - Desplazamiento de MA. Desplazamiento de la línea de indicadores en relación con el gráfico por marco temporal (para MA).
Averaging method - Método de media móvil. (para MA).
Precio aplicado - Precio aplicado (para MA).
ZigZag
Profundidad - el número mínimo de velas, para las cuales Zigzag no dibujará el segundo máximo (o mínimo), si el último es Desviación menor (o mayor) que el anterior.
Desviación - el número mínimo de puntos entre los máximos/mínimos de dos velas adyacentes para que el Zigzag forme un máximo/ mínimo local.
Retroceso - el número mínimo de velas entre los máximos/mínimos locales.
Excellent product. MTF Angle is everything. It is a "scanner" with three "unique" indicators in one. Search the entire market. The three functions can be used simultaneously with alarms. Very satisfied. Honest price.