Smart Trading Signals
- Indicadores
-
Jinsong Zhang
 MT5 Articles List - Traders' Blogs: https://www.mql5.com/en/blogs/post/90
 - Versión: 1.21
- Actualizado: 20 noviembre 2021
- Activaciones: 5
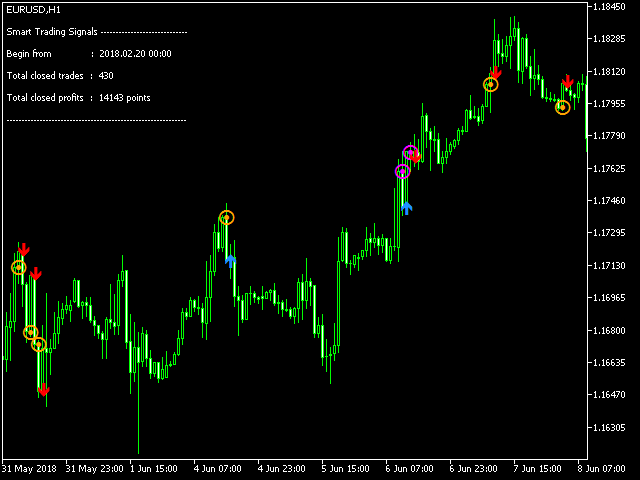
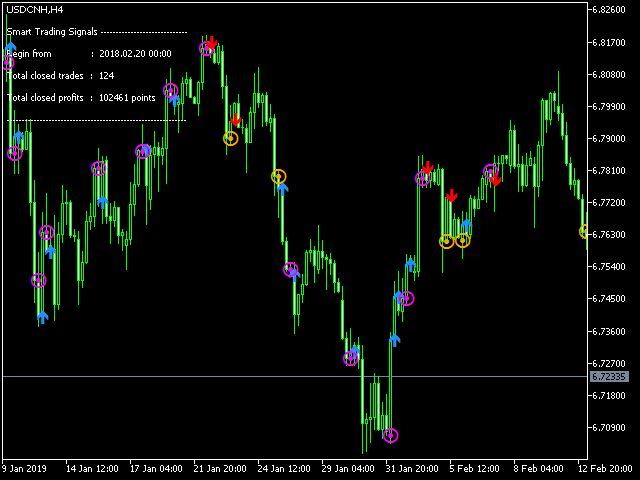
Es un indicador de autoaprendizaje.
Es necesario fijar una hora de inicio y descargar los datos históricos pertinentes para que aprenda.
Aprenda el menor número posible de reglas y dé la máxima libertad a los indicadores.
Por lo tanto, el principio de elegir el mejor resultado durante el periodo de aprendizaje no garantiza que todas las operaciones sean rentables.
En general, cuanto más largo sea el estudio, más fiables serán los resultados.
En el probador de estrategias, debe establecer el parámetro de tiempo antes de que comience la prueba para que el indicador tenga tiempo suficiente para aprender.
Los indicadores señalan una compra o una venta, que se distinguen por la dirección de la flecha.
El indicador también enviará señales de cierre que se distinguen por puntos de diferentes colores.