Smart Trading Signals

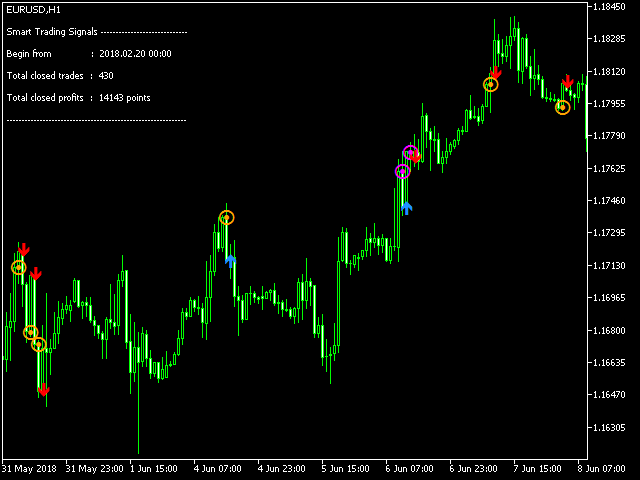
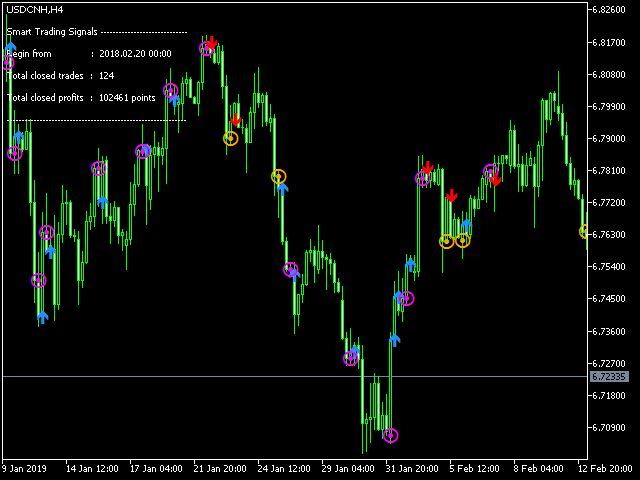
It's a self-learning indicator.
You need to set a starting time and download the relevant historical data for it to learn.
Learn as few rules as possible and give the maximum freedom to the indicators.
Therefore, the principle of choosing the best outcome during the learning period does not guarantee that every transaction is profitable.
In general, the longer the study, the more reliable the results.
In the strategy tester, you need to set the time parameter before the test starts so that the indicator has enough time to learn.
Indicators signal a buy or sell, distinguished by the direction of the arrow.
The indicator will also send out closing signals that distinguish by different coloured dots.


Produtos recomendados
Indicador único que implementa uma abordagem profissional e quantitativa para significar negociação de reversão. Ele capitaliza o fato de que o preço desvia e retorna à média de maneira previsível e mensurável, o que permite regras claras de entrada e saída que superam amplamente as estratégias de negociação não quantitativas. [ Installation Guide | Update Guide | Troubleshooting | FAQ | All Products ] Sinais de negociação claros Incrivelmente fácil de negociar Cores e tamanhos personalizáveis
Donchian Breakout And Rsi
Mattia Impicciatore
5 (1)
Descrição geral Este indicador é uma versão aprimorada do Canal Donchian clássico, enriquecida com funções práticas para o trading real. Além das três linhas padrão (máxima, mínima e linha do meio), o sistema detecta breakouts e os mostra visualmente com setas no gráfico, exibindo apenas a linha oposta à direção da tendência atual para uma leitura mais limpa. O indicador inclui: Sinais visuais : setas coloridas nos breakouts Notificações automáticas : alerta pop-up, push e e-mail Filtro RSI : pa
FREE
O indicador SMC Venom Model BPR é uma ferramenta profissional para os traders que trabalham com o conceito Smart Money (SMC). Identifica automaticamente dois padrões principais no gráfico de preços: FVG   (Fair Value Gap) é uma combinação de três velas, em que existe um gap entre a primeira e a terceira velas. Forma uma zona entre níveis onde não há suporte de volume, o que geralmente leva a uma correção de preço. BPR   (Balanced Price Range) é uma combinação de dois padrões FVG que formam uma
Before installing the HeatMap indicator make sure you are using a broker that gives you access to the Depth of market (DOM) !! This indicator creates a heatmap on your chart allowing you to see the buy or sell limit orders easily and in real time. You have the possibility to change the setting and the colors of the HeatMap in order to adapt to all markets and all charts. Here is an example of a setting you can use with the NASDAQ100 on the AMPGlobal broker :  https://www.youtube.com/watch?v=x0Y
Crash 1000 Scalping Indicator for the Crash 1000 Deriv Synthetic Index. Introduction The Crash 1000 Scalping Indicator is a specialized tool designed for the Crash 1000 index on the Deriv Synthetic market. This indicator is particularly useful for scalping on the M1 timeframe, helping traders to identify precise entry and exit points for buy positions. It is designed to be non-repainting, providing clear signals with audible alerts and push notifications, and is compatible with mobile devices th
Adjustable Consecutive Fractals  looks for 2 or more fractals in one direction and sends out a on screen alert, sound alert and push notification, for strong reversal points . Adjustable Consecutive Fractals, shows the fractals on chart along with a color changing text for buy and sell signals when one or more fractals appear on one side of price. Adjustable Consecutive Fractals is based Bill Williams Fractals . The standard Bill Williams fractals are set at a non adjustable 5 bars, BUT withe th
Was: $249  Now: $99   Market Profile defines a number of day types that can help the trader to determine market behaviour. A key feature is the Value Area, representing the range of price action where 70% of trading took place. Understanding the Value Area can give traders valuable insight into market direction and establish the higher odds trade. It is an excellent addition to any system you may be using. Inspired by Jim Dalton’s book “Mind Over Markets”, this indicator is designed to suit the
Boom kerdoskopos
David Chokumanyara
Boom Kerdoskopos Indicator – Sell With Confidence The Boom Kerdoskopos Indicator is a scalper’s dream for Boom markets on M1 timeframe . Built to protect you from spikes, it gives precise yellow down arrows for sell entries and red cross exit signals so you always know when to enter and leave the trade. With smart alerts (audible, push, email), you can trade stress-free and secure 8–10 safe candles every time. It’s perfect for scalpers who want fast, consistent profits. Why Traders Choose
Versão MT4: https://www.mql5.com/en/market/product/157433 Versão MT5: https://www.mql5.com/en/market/product/167286 O Volume Imbalance é uma ferramenta de visualização leve de Perfil de Volume + Desequilíbrio Delta, concebida para o ajudar a identificar zonas de preço de alta atividade, pressão direcional e áreas de preço "vazias" dentro de um intervalo de observação configurável. Ao contrário do perfil de volume clássico, que apenas mostra o volume total, este indicador divide cada nível de
A nova versão torna este indicador uma ferramenta completa para estudo, análise e operação de padrões probabilísticos. Suas funções incluem: Monitor de porcentagem de múltiplos ativos no gráfico. Martingales configuráveis. Vinte e um padrões pré-configurados, incluindo padrões Mhi e C3. Um editor de padrões avançado para armazenar até 5 padrões personalizados. Modo Backtest para testar resultados com relatório de perdas. Filtro de tendência. Filtro de hits. Opção de Ciclos de Martingale. Vários
The Supply and Demand Zone Indicator is a powerful and easy-to-use tool designed to help traders identify critical supply and demand zones on the chart. These zones can provide valuable insight into potential market reversals, breakouts, and important price levels where buyers or sellers are likely to take control. The best   FREE Trade Manager . If you want to create your own Hedging or Grid strategies without any coding make sure to check out the   ManHedger Key Features: Automatic Zone Detect
FREE
Matrix Currency
Augusto Martins Lopes
Matrix Currency - Ferramenta de Análise Multi-Timeframe O Matrix Currency é um indicador avançado para análise de força das moedas no mercado Forex, projetado para oferecer monitoramento eficiente e suporte estratégico nas suas operações de trading. Características Principais: Análise Multi-Timeframe : Monitora múltiplos períodos simultaneamente (M1 a MN1) com atualização em tempo real em uma matriz intuitiva. Sistema de Alertas : Notificações configuráveis, via pop-up, email e dispositivos móv
FREE
General Description In the simplest terms this is a contrarian intra-day scalping system. Built to try and let correct trades run as far as possible and flip the trade when indicated. The indicator looks at historical daily trading ranges to lay out levels at which it takes long and short positions based on the statistical levels. The indicator is built around index futures, mainly around S&P and the DOW but can be used an any futures contract mainly using AMP Futures to trade. The indicator is
Range Directional Force Indicator – Designed for You to Optimize! The Range Directional Force Indicator is a cutting-edge tool designed to empower traders by visualizing market dynamics and directional strength. Built to offer insights into market trends and reversals, this indicator is an invaluable asset for traders seeking precision in their strategies. However, it is important to note that this indicator is not optimized, leaving room for you to tailor it to your unique trading preferences.
This indicator builds a Pivot Anchored Volume Profile (VAP/VPOC approximation using tick volume) and automatically splits the profile into pivot-to-pivot segments , giving you a clean, TradingView-like view of where volume concentrated during each swing. It draws a horizontal histogram for every segment and highlights the Value Area and key levels, making it easy to spot acceptance/rejection zones, high-volume nodes, and potential support/resistance. Key Features Segmented Volume Profile (Pivot-
Turn your chart into a professional trading dashboard that shows where price is flowing and when the next shock is coming —without loading a single extra window. This indicator combines a price-following MA ribbon with a live news radar directly on the chart, giving you both trend and event risk in one glance. Trend Ribbon – Read the market bias instantly A smooth, step-style moving average ribbon follows price action bar by bar. Color change shows the active trend: aqua for bullish flow , gold
Your Trend Friend
Luigi Nunes Labigalini
5 (1)
A tendência é sua amiga! Veja a cor do indicador e faça suas operações nessa direção. Ele não repinta. Ou seja, depois que cada candle se fecha, a cor dele é definitiva e não irá se alterar. Você pode focar em movimentos mais curtos e rápidos ou tendências mais longas, basta testar o que melhor se encaixa no seu operacional de acordo com o ativo e tempo gráfico usado. Altere o parâmetro de entrada "Length" e o indicador irá se adaptar automaticamente (quanto maior ele for, maior a tendência an
Hello There, Today I want to show you my new researchable fore BUY SELL indicator, it work all asset, and also work Derive Volatility asset! it work all time frame, but i recommend start 5 minute to H1 when you receive a signal just take trade and stay wait for your take profit asset All Major Pair And minor IT WORK ALSO XAUUSD Fantastic results,  for more info,,, message us thank you   
The Antique Trend Indicator is a revolutionary trend trading and filtering solution with all the important features of a trend tool built into one tool! The Antique Trend indicator is good for any trader, suitable for any trader both for Forex and binary options. There is no need to configure anything, everything has been perfected by time and experience, it works great during flats and trends. The Antique Trend indicator is a tool for technical analysis of financial markets, reflecting curren
Cycles Forecast
Pooriya Alirezaee
This indicator is based on a mathematical formula and an ANN combined, designed to make a model(using previous prices) of the most recent market condition (any chart*) in order to use the model as a forecasting tool. *This indicator can operate on any chart/timeframe, but it's suggested you use multiple timeframes for each trade because this method relies solely on the time factor, you can not use this indicator to predict price volatility, but if it's fit correctly it will show you when the nex
Visual Cobra Momentum Wave Indicator
AL MOOSAWI ABDULLAH JAFFER BAQER
Visual Cobra Momentum Wave: Ride the Trend with Unmatched Clarity Unlock the true direction of the market and trade with newfound confidence. The Visual Cobra Momentum Wave is a professional-grade trend analysis tool designed to eliminate the noise and confusion of volatile markets. Instead of relying on lagging or conflicting signals, this indicator provides a single, clear visual guide, allowing you to identify and ride strong trends from their inception to their conclusion. For just $30, you
Advanced Fibonacci
Marius Ovidiu Sunzuiana
Fibonacci Advanced Indicator – Precision Meets Intelligence The Fibonacci Advanced Indicator is a cutting-edge technical analysis tool designed for traders who demand more than conventional retracement levels. Built on the foundational principles of Fibonacci mathematics, this indicator transcends tradition by integrating dynamic market behavior , multi-timeframe analysis , and adaptive algorithms to deliver high-probability trading zones with surgical accuracy. 1. Multiple Fibonacci Levels
1. Overview The Scalping PullBack Signal indicator is a powerful technical analysis tool designed to help traders identify scalping opportunities based on potential pullback and reversal signals. This tool is particularly useful on lower timeframes (below 15 minutes) but can also be applied on higher timeframes for longer-term trades. This indicator integrates several key analytical components, providing a comprehensive view of trends and potential entry/exit points, helping you make quick and e
FREE
Fibaction
Abdelkhalek Orabi
Indicator Name: Fibaction – price action candle Detector Description: Fibo Signal Boxes is a powerful Smart Money Concept (SMC)-inspired indicator that auto-detects price action candles. bullish hammers and shooting stars, then draws precise Fibonacci entry zones and multiple take-profit levels directly on the chart. as for the SL personally i use 40 pips rules  Key Features: Detects bullish hammer and shooting star reversal candles. Automatically draws Fibonacci entry and TP boxes. as
Arrow Trends – Clear Trade Entry Signals for MetaTrader 5 Arrow Trends is a professional arrow indicator for MetaTrader 5 designed to provide trade entry signals in the direction of the prevailing trend. Whether you are scalping, day trading, or swing trading, Arrow Trends helps you identify strong opportunities. Key Features: Non-Repainting Signals: Once an arrow appears, it never disappears. Trend-Focused Entries: Signals align with the dominant market direction. Multi-Timeframe Ready: From 1-
Uma das sequências numéricas é chamada de "Forest Fire Sequence". Foi reconhecida como uma das mais belas novas sequências. Sua principal característica é que essa sequência evita tendências lineares, mesmo as mais curtas. É esta propriedade que formou a base deste indicador. Ao analisar uma série temporal financeira, este indicador tenta rejeitar todas as opções de tendência possíveis. E somente se ele falhar, ele reconhece a presença de uma tendência e dá o sinal apropriado. Esta abordagem pe
Noize Absorption Index - is the manual trading system that measures the difference of pressure between bears forces and bulls forces. Green line - is a noize free index that showing curent situation. Zero value of index shows totally choppy/flat market.Values above zero level shows how powerfull bullish wave is and values below zero measures bearish forces.Up arrow appears on bearish market when it's ready to reverse, dn arrow appears on weak bullish market, as a result of reverse expectation.
Daily Volume Profile - See Where Smart Money Trades Stop guessing support and resistance. Start seeing where REAL volume is. The Daily Volume Profile indicator reveals the hidden structure of the market by showing exactly where trading activity concentrates at each price level. While most traders use lagging indicators, you'll see where institutional money positions itself - BEFORE the move happens. What You Get: → POC (Point of Control) - The most powerful S/R level of each day, shown as a cle
https://www.mql5.com/en/users/gedeegi/seller    The GEN indicator is a multifunctional technical analysis tool for the MetaTrader 5 (MT5) platform. It is designed to automatically identify and display key Support and Resistance (S&R) levels and detect False Breakout signals, providing clear and visual trading cues directly on your chart. Its primary goal is to help traders identify potential price reversal points and avoid market traps when the price fails to decisively break through key levels
FREE
Be notified of every color change of Heiken Ashi (HA) candles. The indicator will trigger past and new signals every time that HA candles change their colors. ( Note : this tool is based on the code of Heiken Ashi indicator developed by MetaQuotes Software Corp.) Features The signals are triggered at closing of last bar/opening of a new bar; Any kind of alerts can be enabled: Dialog Box, Email message, SMS notifications for smartphones and tablets, and Sound alerts; By default, up arrows are pl
Os compradores deste produto também adquirem
SuperScalp Pro
Van Minh Nguyen
5 (9)
SuperScalp Pro – Sistema avançado de indicador de scalping com múltiplos filtros SuperScalp Pro é um sistema avançado de indicador de scalping que combina o clássico Supertrend com múltiplos filtros inteligentes de confirmação. O indicador opera de forma eficiente em todos os timeframes de M1 a H4 e é especialmente adequado para XAUUSD, BTCUSD e principais pares Forex. Pode ser usado como sistema independente ou integrado de forma flexível a estratégias de trading existentes. O indicador integra
Se você comprar este indicador, receberá meu Gerenciador de Operações Profissional + EA  GRATUITAMENTE. Primeiramente, vale ressaltar que este Sistema de Trading é um Indicador Não Repintado, Não Redesenho e Não Atrasado, o que o torna ideal tanto para o trading manual quanto para o automatizado. Curso online, manual e download de predefinições. O "Sistema de Trading Inteligente MT5" é uma solução completa de trading projetada para traders novos e experientes. Ele combina mais de 10 indicadores
FX Trend MT5 NG
Daniel Stein
5 (4)
FX Trend NG: A Nova Geração de Inteligência de Tendência Multi-Mercado Visão Geral FX Trend NG é uma ferramenta profissional de análise de tendências e monitoramento de mercado em múltiplos períodos de tempo. Permite compreender a estrutura completa do mercado em segundos. Em vez de alternar entre vários gráficos, você visualiza instantaneamente quais ativos estão em tendência, onde o momentum está enfraquecendo e onde existe alinhamento forte entre diferentes timeframes. Oferta de Lançamento
Market Flow Pro
Gabriele Sabatino
4 (1)
Market Flow Pro Market Flow Pro is an intelligent trading advisor for the MetaTrader 5 platform, designed for automatic trading on financial markets using algorithmic analysis and strict risk management. -Key features: - Fully automatic trading 24/5 - Adaptive trend and momentum entry algorithm -  Built-in risk management - Flexible lot settings (fixed/auto-calculation) - Support for major currency pairs and indices - Optimised for operation on various timeframes  How it works Market
Divergence Bomber
Ihor Otkydach
4.89 (83)
Cada comprador deste indicador recebe adicionalmente, e de forma gratuita: A ferramenta exclusiva "Bomber Utility", que acompanha automaticamente cada operação, define os níveis de Stop Loss e Take Profit e fecha operações de acordo com as regras da estratégia; Arquivos de configuração (set files) para ajustar o indicador em diferentes ativos; Set files para configurar o Bomber Utility nos modos: "Risco Mínimo", "Risco Balanceado" e "Estratégia de Espera"; Um vídeo tutorial passo a passo que aju
Entry In The Zone and SMC Multi Timeframe is a real-time market analysis tool developed based on Smart Money Concepts (SMC). It is designed to analyze market structure, price direction, reversal points, and key zones across multiple timeframes in a systematic way. The system displays Points of Interest (POI) and real-time No Repaint signals, with instant alerts when price reaches key zones or when signals occur within those zones. It functions as both an Indicator and a Signal System (2-in-1), c
ARICoins
Temirlan Kdyrkhan
ARICoin is a powerful trading companion designed to generate high-probability entry signals with dynamic TP/SL/DP levels based on volatility. Built-in performance tracking shows win/loss stats, PP1/PP2 hits, and success rates all updated live. Key Features: Buy/Sell signals with adaptive volatility bands Real-time TP/SL/DP levels based on ATR Built-in MA Filter with optional ATR/StdDev volatility Performance stats panel (Success, Profit/Loss, PP1/PP2) Alerts via popup, sound, push, or email Cust
Grabber System MT5
Ihor Otkydach
4.82 (22)
Apresento a você um excelente indicador técnico: Grabber, que funciona como uma estratégia de trading “tudo incluído”, pronta para usar. Em um único código estão integradas ferramentas poderosas de análise técnica de mercado, sinais de entrada (setas), funções de alertas e notificações push. Cada comprador deste indicador também recebe gratuitamente: Utilitário Grabber: ferramenta para gerenciamento automático de ordens abertas Vídeo tutorial passo a passo: como instalar, configurar e operar com
Atomic Analyst MT5
Issam Kassas
4.03 (30)
Primeiramente, vale ressaltar que este Indicador de Negociação não repinta, não redesenha e não apresenta atrasos, tornando-o ideal tanto para negociação manual quanto automatizada. Manual do utilizador: configurações, entradas e estratégia. O Analista Atômico é um Indicador de Ação de Preço PA que utiliza a força e o momentum do preço para encontrar uma vantagem melhor no mercado. Equipado com filtros avançados que ajudam a remover ruídos e sinais falsos, e aumentam o potencial de negociação.
Quantum TrendPulse
Bogdan Ion Puscasu
5 (22)
Apresentando   Quantum TrendPulse   , a ferramenta de negociação definitiva que combina o poder do   SuperTrend   ,   RSI   e   Stochastic   em um indicador abrangente para maximizar seu potencial de negociação. Projetado para traders que buscam precisão e eficiência, este indicador ajuda você a identificar tendências de mercado, mudanças de momentum e pontos de entrada e saída ideais com confiança. Principais características: Integração SuperTrend:   siga facilmente a tendência predominante do
AriX
Temirlan Kdyrkhan
1 (4)
AriX Indicator for MT5 A powerful trend-following and signal-evaluation tool AriX is a custom MT5 indicator that combines Moving Averages and ATR-based risk/reward logic to generate clear buy/sell signals. It visualizes dynamic SL/TP levels, evaluates past trade outcomes, and displays win/loss statistics in a clean on-chart panel. Key features include: Buy/Sell signals based on MA crossovers ATR-based SL/TP1/TP2/TP3 levels with visual lines and labels Signal outcome tracking with real-time stat
Power Candles MT5
Daniel Stein
5 (6)
Power Candles – Sinais de entrada baseados em força para qualquer mercado Power Candles leva a análise de força comprovada da Stein Investments diretamente para o seu gráfico de preços. Em vez de reagir apenas ao preço, cada candle é colorido com base na força real do mercado, permitindo identificar instantaneamente a construção de momentum, aceleração de força e transições limpas de tendência. Uma única lógica para todos os mercados Power Candles funciona automaticamente em todos os símbolos de
Game Changer es un indicador de tendencia revolucionario, diseñado para usarse en cualquier instrumento financiero y transformar su MetaTrader en un potente analizador de tendencias. Funciona en cualquier marco temporal y facilita la identificación de tendencias, señala posibles reversiones, actúa como mecanismo de trailing stop y proporciona alertas en tiempo real para una respuesta rápida del mercado. Tanto si es un profesional experimentado como si es un principiante que busca una ventaja com
Este é um indicador para MT5 que fornece sinais precisos para entrar em uma negociação sem redesenhar. Ele pode ser aplicado a qualquer ativo financeiro: forex, criptomoedas, metais, ações, índices. Ele fornecerá estimativas bastante precisas e informará quando é melhor abrir e fechar um negócio. Assista o vídeo (6:22) com um exemplo de processamento de apenas um sinal que compensou o indicador! A maioria dos traders melhora seus resultados de negociação durante a primeira semana de negociação c
Smart Stop Indicator – Precisão inteligente de stop-loss diretamente no seu gráfico Visão geral O Smart Stop Indicator é a solução ideal para traders que desejam definir seu stop-loss de forma clara e metódica, sem adivinhações ou decisões baseadas apenas na intuição. A ferramenta combina lógica clássica de price action (topos mais altos, fundos mais baixos) com um sistema moderno de detecção de rompimentos para identificar onde realmente deve estar o próximo nível lógico de stop. Seja em tend
RFI levels PRO MT5
Roman Podpora
3.67 (3)
O indicador mostra com precisão os pontos de reversão e as zonas de retorno de preço onde o   Principais players . Você identifica onde novas tendências estão se formando e toma decisões com máxima precisão, mantendo o controle sobre cada negociação. VERSION MT4     -    Revela seu potencial máximo quando combinado com o indicador   TREND LINES PRO. O que o indicador mostra: Estruturas de reversão e níveis de reversão com ativação no início de uma nova tendência. Exibição dos níveis de   TAKE P
Trend Screener Pro MT5
STE S.S.COMPANY
4.84 (101)
Desbloqueie o poder da negociação de tendências com o indicador Trend Screener: sua solução definitiva de negociação de tendências, alimentada por lógica difusa e sistema de múltiplas moedas! Eleve sua negociação de tendências com o Trend Screener, o revolucionário indicador de tendências alimentado por lógica difusa. É um poderoso indicador de acompanhamento de tendências que combina mais de 13 ferramentas e recursos premium e 3 estratégias de negociação, tornando-o uma escolha versátil para to
LINHAS DE TENDÊNCIA PRO   -   Ajuda a entender onde o mercado está realmente mudando de direção. O indicador mostra inversões de tendência reais e pontos onde os principais participantes retornam ao mercado. Você vê     Linhas BOS   Análise de tendências e níveis-chave em prazos maiores — sem configurações complexas ou ruídos desnecessários. Os sinais não são repintados e permanecem no gráfico após o fechamento da barra. VERSÃO MT4   -   Revela seu potencial máximo quando combinado com o   indic
Order Block Pro (MQL5) – Versão 1.0 Autor: KOUAME N'DA LEMISSA Plataforma: MetaTrader 5 Descrição: Order Block Pro é um indicador avançado projetado para detectar automaticamente Blocos de Ordem de alta e baixa no seu gráfico. Ao analisar velas de consolidação seguidas de velas de impulso fortes, o indicador identifica áreas-chave onde o preço provavelmente se acelerará. Ideal para traders que desejam: Identificar pontos de entrada e saída precisos. Detectar zonas dinâmicas de suporte e resistê
FX Power MT5 NG
Daniel Stein
5 (31)
FX Power: Analise a Força das Moedas para Decisões de Negociação Mais Inteligentes Visão Geral FX Power é a sua ferramenta essencial para compreender a força real das principais moedas e do ouro em quaisquer condições de mercado. Identificando moedas fortes para comprar e fracas para vender, FX Power simplifica as decisões de negociação e revela oportunidades de alta probabilidade. Quer você prefira seguir tendências ou antecipar reversões usando valores extremos de Delta, esta ferramenta adap
ARIPoint
Temirlan Kdyrkhan
ARIPoint is a powerful trading companion designed to generate high-probability entry signals with dynamic TP/SL/DP levels based on volatility. Built-in performance tracking shows win/loss stats, PP1/PP2 hits, and success rates all updated live. Key Features: Buy/Sell signals with adaptive volatility bands Real-time TP/SL/DP levels based on ATR Built-in MA Filter with optional ATR/StdDev volatility Performance stats panel (Success, Profit/Loss, PP1/PP2) Alerts via popup, sound, push, or email Cu
Azimuth Pro
Ottaviano De Cicco
5 (4)
PROMOÇÃO DE LANÇAMENTO O preço do Azimuth Pro está inicialmente definido em 299$ para os primeiros 100compradores. O preço final será de 499$ . A DIFERENÇA ENTRE ENTRADAS RETAIL E INSTITUCIONAIS NÃO É O INDICADOR — É A LOCALIZAÇÃO. A maioria dos traders entra em níveis de preço arbitrários, perseguindo momentum ou reagindo a sinais atrasados. As instituições esperam o preço atingir níveis estruturados onde oferta e demanda realmente mudam. Azimuth Pro mapeia esses níveis automaticamente: VWA
Apresentando       Quantum Breakout PRO   , o inovador Indicador MQL5 que está transformando a maneira como você negocia Breakout Zones! Desenvolvido por uma equipe de traders experientes com experiência comercial de mais de 13 anos,       Quantum Breakout PRO       foi projetado para impulsionar sua jornada comercial a novos patamares com sua estratégia de zona de fuga inovadora e dinâmica. O Quantum Breakout Indicator lhe dará setas de sinal em zonas de breakout com 5 zonas-alvo de lucro e su
RelicusRoad Pro: Sistema Operacional Quantitativo de Mercado 70% DE DESCONTO ACESSO VITALÍCIO (TEMPO LIMITADO) - JUNTE-SE A 2.000+ TRADERS Por que a maioria dos traders falha mesmo com indicadores "perfeitos"? Porque eles operam Conceitos Únicos no vácuo. Um sinal sem contexto é uma aposta. Você precisa de CONFLUÊNCIA . RelicusRoad Pro não é um simples indicador de seta. É um Ecossistema Quantitativo de Mercado completo. Ele mapeia a "Estrada do Valor Justo", distinguindo ruído de rupturas estru
FX Dynamic MT5
Daniel Stein
5 (5)
FX Dynamic: Acompanhe a Volatilidade e as Tendências com Análise ATR Personalizável Visão Geral FX Dynamic é uma ferramenta poderosa que utiliza cálculos de Average True Range (ATR) para fornecer aos traders insights incomparáveis sobre a volatilidade diária e intradiária. Ao configurar limites de volatilidade claros —por exemplo, 80%, 100% e 130%—, você pode identificar rapidamente oportunidades de lucro ou receber alertas quando o mercado ultrapassar faixas normais. FX Dynamic se adapta ao f
FX Levels MT5
Daniel Stein
5 (13)
FX Levels: Suporte e Resistência com Precisão Excepcional para Todos os Mercados Visão Geral Rápida Procurando um meio confiável de identificar níveis de suporte e resistência em qualquer mercado—incluindo pares de moedas, índices, ações ou commodities? FX Levels combina o método “Lighthouse” tradicional com uma abordagem dinâmica de vanguarda, fornecendo uma precisão quase universal. Baseado em nossa experiência real com corretores e em atualizações automáticas diárias mais as de tempo real,
Trend indicator AI mt5
Ramil Minniakhmetov
5 (15)
O indicador Trend Ai é uma ótima ferramenta que irá melhorar a análise de mercado de um trader, combinando a identificação de tendências com pontos de entrada acionáveis e alertas de reversão. Este indicador permite que os usuários naveguem pelas complexidades do mercado forex com confiança e precisão Além dos sinais primários, o indicador Trend Ai identifica pontos de entrada secundários que surgem durante retrações ou retrações, permitindo que os comerciantes capitalizem as correções de preço
Market Structure Order Block Dashboard MT5 é um indicador para MT5 focado em estrutura de mercado e conceitos ICT / Smart Money: HH/HL/LH/LL , BOS , ChoCH , além de Order Blocks , Fair Value Gaps (FVG) , liquidez (EQH/EQL, sweeps), sessões / Kill Zones e um Volume Profile integrado, com um dashboard compacto de confluência. Importante: é uma ferramenta de análise . Não executa operações (não é um EA). Bônus para compradores Após a compra, você pode receber 2 indicadores bônus (à sua escolha) da
Trend Hunter MT5
Andrey Tatarinov
5 (3)
Trend Hunter é um indicador de tendência para trabalhar nos mercados Forex, criptomoeda e CFD. Uma característica especial do indicador é que ele segue a tendência com confiança, sem alterar o sinal quando o preço ultrapassa ligeiramente a linha de tendência. O indicador não é redesenhado; um sinal para entrar no mercado aparece após o fechamento da barra. Ao avançar ao longo de uma tendência, o indicador mostra pontos de entrada adicionais na direção da tendência. Com base nesses sinais, você
Ultimate SMC Indicator
Hicham Mahmoud Almoustafa
1 (1)
Ultimate SMC PRO – Smart Money Concepts Indicator (Order Blocks, FVG, Liquidity, BOS) for MetaTrader 5 Ultimate SMC PRO is a professional trading indicator designed to visualize Smart Money Concepts directly on the chart. The indicator combines several institutional trading tools in one system to help traders identify potential high-probability trading zones. ULTIMATE SMC INDICATOR — COMPLETE TRADING GUIDE The indicator analyzes market structure, liquidity behavior and price imbalance to highl
Mais do autor
。。。。。。。。。。。。。。。。。。。。。。。。。。。。。。。。。。。。。。。。。。。 This indicator is based on Bollinger Bands indicator. It helps user clearly know the Band is expand or contract. The method of use is the same as the traditional Brin channel index. Users can use different color areas to distribute forest channel indicators in expansion or contraction stage. -------------------------------------------------------------------------------------------
FREE
Reverse TradeCopier for Followers can copy trades from an account that is running   Reverse TradeCopier for Source . Features: Copies trades from one source (master) account to multiple following (slave) accounts. Allow investor (read only) password for source (master) account. There are no complicated settings and input parameters, everything is easy. Works with different brokers. Works with different quotes symbols (EURUSD_FX, eurusd_m, etc.). Can copy orders from 4-digit quotes platform to 5-
FREE
If you want something as below: Sell FOREX trading signal. Manage multiple accounts. Follow the trading from somebody. "TradeCopier_follow" and   "TradeCopier_source"   can help you! Features: Copying from one source (master) account to multiple follower (slave) accounts. Allow investor (read only) password for the source (master) account. There are no complicated settings and input parameters, everything is easy. Works with different Brokers. Works with different symbols (EURUSD_FX, eurusd_m, e
FREE
The Synchronized Charts script allows comparing bars of different symbols or different periods of the same symbol. Attach the script to a chart and move bars or change the scale, all opened chart will move synchronously with the current one. The bars on different charts aligned to the border according to their open time. Please be sure the relevant history datas have been downloaded before synchronize charts. 。。。。。。。。。。。。。。。。。。。。。。。。。。。。。。。。。。。。。。。。。。。。。。。。。。
This product is used to check the foreign exchange market history datas. Good quality historical datas is important for traders to perform market analysis or back testing. But the quality of historical datas provided by various foreign exchange brokers is uneven. Sometimes we notice missing k-line sequences, but sometimes it is not easy to detect them. This product helps users locate these missing locations.If there are many gaps in a given period of time on a chart, you need to be careful about
Some trading strategies are suitable for the quiet market with less volatility, while others are suitable for the volatile and violent market. Either way, traders should have a clear measure of how hot or cold the market is. This product is convenient for traders to compare the degree of cold heat of different trading varieties, or the trading heat of the same trading variety in different time periods. You can put it on different charts to get the intuition. It's easy to see which is more hot an
This indicator is used to indicate the difference between the highest and lowest prices of the K line, as well as the difference between the closing price and the opening price, so that traders can visually see the length of the K line. The number above is the difference between High and Low, and the number below is the difference between Close and Open. This indicator provides filtering function, and users can only select K lines that meet the criteria, such as positive line or negative lin
Some traders don't like expose Take Profit/Stop Loss level in their positions, this Expert Advisor can help them. Put it to chart and set Take Profit/Stop Loss pips (0 means ignore), it watch the price of the symbol on chart and close the position if price reach Hidden TP/SL level. It hide user's TP/SL price in effect. Welcome to contact me. 。。。。。。。。。。。。。。。。。。。。。。。。。。。。。
This script allows traders to easily close positions if their profit/loss reaches or exceeds a value specified in pips. The script allows users to easily close positions if their profit/loss reaches or exceeds a value specified in pips. Please set slippage value first. Sometimes some positions do not close due to high volatility of the market. Please set larger slippage or restart the script. ...................................................................................................
Script to Delete Pending Orders Sometimes you placed many Pending Orders and then you want delete certain kind of these orders, this script can help you! Usage: Download and drag and drop this script to the chart. Check "Allow AutoTrading" in "Common" tab and set input parameters in "Inputs" tab. Input Parameters: TypeOfPending: which type Order you would delete. mySymbol: which Symbol you would delete. The input format of the Symbol is such as "EURUSD" or "eurusd".
The script allows to easily watch the date and time of several cities selected by the user from more than 30 important cities all over the world. It also shows GMT, Server time and Local time. The cities on the screen are automatically sorted by the date and time. You can save your setting on the Inputs tab and use them in future. Notice: Daylight saving time is not considered.
Some trading strategies are suitable for the quiet market with less volatility, while others are suitable for the volatile and violent market. Either way, traders should have a clear measure of how hot or cold the market is. This product is convenient for traders to compare the degree of cold heat of different trading varieties, or the trading heat of the same trading variety in different time periods. You can put it on different charts to get the intuition. It's easy to see which is more hot an
Painting Deals
Jinsong Zhang
4.67 (3)
Painting Deals on active chart. It allows analyzing trade history on an account to which you have an investor (read only) password. Type of the arrow displayed indicated the deal type: Right Arrow means In and In/Out deals Arrow Left Left means Out deals. Blue arrows are for Buy deals and Red arrows are for Sell deals. The indicator displays deals in the real time mode, it also displays their Stop Loss and Take Profit levels. Put the mouse over the arrows to see the details of deals including op
The script shows statistics of trades for the specified period. For example, if you want to know the details of trades of the ATC2010 Winner ( bobsley ): Login with his account using the investor (read-only) password (MetaTrader5); Open the chart of his trading symbol (EURUSD); Run this script on the chart; Specify 2010.10.1 in "date from", and the diagram will be shown.
The Synchronized Charts script allows comparing bars of different symbols or different periods of the same symbol. Attach the script to a chart and move bars or change the scale, all opened charts will move synchronously with the current one. The bars on different charts aligned to the border according to their open time. Please be sure the relevant history datas have been downloaded before synchronize charts.
This script allows traders to easily close positions if their profit/loss reaches or exceeds a value specified in pips. The script allows users to easily close positions if their profit/loss reaches or exceeds a value specified in pips. Please set slippage value first. Sometimes some positions do not close due to high volatility of the market. Please set larger slippage or restart the script. ............................................................................................
This script notifies a user about different events by playing sounds, sending emails and text messages to a mobile device. The following events are supported: New deals (in/in out/out). Expiration of Pending orders. The terminal disconnected. The terminal or the script closed. Please set a notification type for each event separately. If you need notifications via Email, please make sure that the settings on the Email tab are correct. If you need to receive notifications on a mobile device, pleas
This script alerts a user via sounds and alert box at the end of a countdown. It is like an alarm clock. There are 2 ways to start counting down: Set a value of remaining minutes. Example: if you need an alert after 1 hour, set it to 60. Set countdown end time. If you like to use a custom sound for the alert, copy your sound files to "terminal_path\Sounds" folder and set the exact file name in the input parameters. The sound file must be in *.wav format.
This product is used to check the foreign exchange market history datas. Good quality historical datas is important for traders to perform market analysis or back testing. But the quality of historical datas provided by various foreign exchange brokers is uneven. Sometimes we notice missing k-line sequences, but sometimes it is not easy to detect them. This product helps users locate these missing locations.If there are many gaps in a given period of time on a chart, you need to be careful about
SmartMA
Jinsong Zhang
This is a trend indicator, as you can see here. When the white line is above the red, it means a bull market. Conversely, the white line below the red line is a bear market. This index is suitable for long - term trading and is suitable for most trading varieties. --------------------------------------------------------------------------------------------
This indicator let user clearly see Buy/Sell signals. When a bar is closed and conditions meet, arrow signal will come up at Close Price, up is Buy and down is Sell. It works on all Timeframes. And you can set sound alert when signals come up.
This indicator is used to compare the relative strength of the trade on the chart against the other several selected symbols. By comparing the price movement of each traded variety based on the same base day, several trend lines of different directions can be seen, reflecting the strong and weak relationship between the several different traded varieties, so that we can have a clearer understanding of the market trend. For example, you can apply this indicator on a EurUSD chart and compare it w
.................................. This script is intended to help users to get information about ticks and spreads (e.g. ticks count, minimum/maximum/average spread). It can export reports in the CSV format with this information. Traders can see spread statistics in real time in the chart window It is useful for comparing spreads of different brokers. --------------------------------------------------------------------------
This is visualization tool based on the Depth of Market. It works with the symbols that have the Depth of Market available. It's a visual indicator that shows the volume of each Bid/Ask price and ratio of total volume of Bids/Asks. Note: check if your broker supports DOM before purchasing. 。。。。。。。。。。。。。。。。。。。。。。。。。。。。。。。。。。。。。。。。。。。。。。。。。。。 。。。。。。。。。。。。。。。。。。。。。。。。。。。。。。。。。。。。。。。。。。。。。。。。。。。
This indicator is used to compare the relative strength of the trade on the chart against the other two selected symbols. By comparing the price movement of each traded variety based on the same base day, three trend lines of different directions can be seen, reflecting the strong and weak relationship between the three different traded varieties, so that we can have a clearer understanding of the market trend. For example, you can apply this indicator on a EurUSD chart and compare it with curre
Most time the market is in a small oscillation amplitude. The Trade Area indicator helps users to recognize that time. There are 5 lines in this indicator: Area_high, Area_middle, Area_Low, SL_high and SL_low. Recommendations: When price is between Area_high and Area_Low, it's time to trade. Buy at Area_Low level and sell at Area_high level. The SL_high and SL_low lines are the levels for Stop Loss. Change the Deviations parameter to adjust SL_high and SL_low.
This indicator is used to indicate the difference between the highest and lowest prices of the K line, as well as the difference between the closing price and the opening price, so that traders can visually see the length of the K line. The number above is the difference between High and Low, and the number below is the difference between Close and Open. This indicator provides filtering function, and users can only select K lines that meet the criteria, such as positive line or negative line.
This script allows you to compare quotes and spreads from different trading servers or brokers to identify a server/broker that offers the best bid/ask price and the tightest spread. It can be compared with up to six different servers or brokers at a time, and it is easy to find the best quote provider by score. Usage: Open up to 6 MetaTrader client terminals, login to different servers/brokers, and then start the script on each terminal's chart.
Rocket Projectile
Jinsong Zhang
1 (1)
This is a multi-currency paired trading system.I won't go into the details of how it works, but what the user needs to care about is how it actually works. It is highly recommended that you download the product and test it thoroughly, including back testing with the historical data and foward testing in the simulated account. As this EA trades multiple currency pairs, relevant historical data will be automatically downloaded at the first time of its historical review, with data volume around 6GB
This tool is used to generate a K - line reflection chart of a currency pair for foreign exchange transactions. For example, if the currency pair is EURUSD, a custom currency pair named EURUSD_ref is generated and a chart for that currency pair is opened. The price of a custom pair of currency is the inverse of the price of the original pair, which is the equivalent of a new pair of currency, the USDEUR. The usage is simple, put it on any chart, the new chart will open, and then draw the corr
Filtro:
Sem comentários
Responder ao comentário